
 ?Mathematical formulae have been encoded as MathML and are displayed in this HTML version using MathJax in order to improve their display. Uncheck the box to turn MathJax off. This feature requires Javascript. Click on a formula to zoom.
Abstract
Our study investigates metabolic changes occurring at dry-off and the contribution of milk yield (MY) in such alterations. Thirteen Holsteins were dried off at 55 days from expected calving day (assumed as 0 days from dry-off, DFD) and divided in two groups according to their average daily MY in the last week of lactation, assuming a cut-off of 15 kg·d−1: low MY (7 cows) and high MY (6 cows). From −7 to 34 DFD dry matter intake (DMI) and rumination time were measured. Blood samples were collected at −7, 2, 7, 27 and 34 DFD to assess an haematological and metabolic profile and at −7, 7 and 34 DFD to test functions of circulating white blood cell (WBC) through ex vivo challenges. Data were included in a mixed model for repeated measures assuming MY at dry-off, time and their interaction as fixed effects. After dry-off, DMI was reduced and rumination time was increased in all the animals. High MY cows had greater DMI and rumination time than low MY cows. In blood, WBC counts decreased at 7 DFD and increased the production of pro-inflammatory cytokines at 7 and 34 DFD. Plasmatic concentrations of liver enzymes indicators, positive acute phase proteins (APPs); and nitrogen species increased after dry-off. Conversely, negative APPs and antioxidant species decreased. Those alterations were more marked in high MY animals. This study suggests that dry-off decreased liver function, triggered a systemic inflammation and depleted antioxidant systems, especially in the group of cows with high MY at dry-off.
Inflammation, liver dysfunctions and altered redox balance has been detected after dry-off in all the animals.
Cows with highest milk yield before halting of milk removal faced the most severe metabolic challenges.
Such founding indicates the management of dry-off as a key point for dairy cows health.
Highlights
Introduction
The dry period of dairy cows is defined as the time between cessation of milking and resumption of milk production at a subsequent calving. This phase allows the development of the mammary gland and the turnover of the secretory tissue (Oliver and Sordillo Citation1988) and its essential to maximise milk yield in the following lactation. At dry-off, milk residuals in the mammary gland induce cellular distension and stimulate the release of autocrine mediators (i.e. feedback inhibitor of lactation protein) that act as inhibitor of milk synthesis (Wilde et al. Citation1998; Capuco and Akers Citation1999), while fragments arise from the hydrolysis of caseins acts as putative mediators of mammary gland involution (Shamay et al. Citation2003).
At dry-off, the priority in redistribution of energy and protein sources shift from mammary gland to foetus (Dingwell et al. Citation2001). Adaptation to dry ration decreases the surface area of rumen papillae (Dieho et al. Citation2016). Furthermore, halting of milk removal affects mammary gland both at gross and cellular levels, increasing the susceptibility to infections (Putman et al. Citation2018). Finally, the hunger related to feed restriction and the modification of social structure after regrouping could induce psychological stress in weaker animals (von Keyserlingk et al. Citation2008). Nevertheless, the dry-off did not receive as much attention as other challenging periods, such as transition to calving, and only recent concerns about animal welfare promoted a deeper investigation of dry-off as a cause of metabolic stress (Odensten et al. Citation2005; Zobel et al. Citation2015). Consequently, milk yield higher than 12.5 kg·d−1 (intended as a sum of the milking bouts at the day of dry-off) has been identified as a negative factor for dairy cow’s health (Rajala-Schultz et al. Citation2005). In fact, increased udder pressure that follows milking interruption could induce severe pain (Silanikove et al. Citation2013) triggering a raise of stress-related hormones immediately after dry-off (Bertulat et al. Citation2013). Glucocorticoids and catecholamines interact with specific receptors on immune cells regulating different pathways (i.e. nuclear factor kappa-light-chain-enhancer of activated B-cells and cyclic AMP response element binding protein). Such interactions modify the transcription of genes encoding for a variety of cytokines. Altered cytokines production could dysregulate immune function up to early lactation, with a sufficient magnitude to have health implications (Padgett and Glaser Citation2003; Trevisi et al., Citation2015), and suggesting stress occurring at dry-off to be related with severe immune dysfunction happening during the peripartal period of dairy cows (Trevisi et al. Citation2010). Although a wide background exists regarding the ‘safety threshold’ to dry-off a cow, none evaluated the contribution of high or low MY prior to dry-off in affecting metabolic changes after milking interruption.
Based on above, our objective is to investigate some aspects of metabolic, oxidative and immune changes occurring after an abrupt dry-off during the whole dry period of cows having an average milk yield higher or lower than 15 kg·d−1 in the last week of lactation. Such a threshold has been chosen according to the safety level proposed by Rajala-Schultz et al. (Citation2005) to drying off a cow. Our hypothesis is that abrupt dry-off can negatively affect inflammatory parameters during the dry period, especially in cows with high milk yields at the end of lactation.
Materials and methods
Experimental design and animal management
The trial was carried out at Università Cattolica del Sacro Cuore research dairy barn (Experiment Station, San Bonico, Piacenza, Italy) in accordance with Italian laws on animal experimentation (DL n. 26, 04/03/2014) and ethics (Authorization of Italian Health Ministry N 1047/2015-PR). A group of 13 Italian Holsteins dairy cows (number of lactations: 1.9 ± 1.1; milk yield in the last lactation: 11,547.8 ± 2576 kg; average lactation length: 353.1 ± 54 days [mean ± SD]) were raised in individual tied stalls with controlled environmental conditions (room temperature of 20 °C, relative humidity of 65%, 14 hours of light) and dried off at 55 days from expected calving day (assumed as 0 days from dry-off, DFD) with a deep milking and a treatment with a mammary antibiotic (Mamyzin A; Haupt Pharma Latina S.r.l, Borgo San Michele – Latina, Italy). Before dry-off, cows were milked twice a day, at 4:00 am and pm, and milk yield was recorded. All the cows were individually fed with a component diet. Before dry period, animals received 1 kg of concentrate every 3 kg of produced milk. Since −7 days from dry-off the concentrate was gradually reduced till the complete elimination at dry-off (Phase 1). After dry-off, animals received only grass hay till 10 DFD. From 11 DFD till the end of the experimental period, animals received a hay-based ration with soybean meal and corn silage (Phase 2). Same batches of hays and corn silage were used during the trial. Feeds were collected fortnightly and, after dry matter determination, samples were pooled for subsequent analyses. Feeds and diet composition are shown in Table .
Table 1. Composition and characteristics of the experimental diets fed during the two experimental phases.
From −7 to 34 DFD periodical checks were performed and blood samples were collected regularly, according to the time schedule shown in Figure and described in the following sections. In addition, the health status of cows was monitored recording all clinical diseases appeared from −7 DFD till 30 days from subsequent calving. To investigate the effect of milk yield, after dry-off animals were retrospectively divided in two groups according to their average milk yield in the last week of lactation (19.9 ± 8.6 kg·d−1), assuming a cut-off of 15 kg·d−1: low milk yield (LM; 7 cows; average milk yield in the last week of lactation: 10.6 ± 3.7; milk yield in the last lactation: 10,984 ± 2477 kg; average length of the last lactation: 360.6 ± 51 days [mean ± SD]) and high milk yield (HM; 6 cows; average milk yield in the last week of lactation: 16.5 ± 5.3; milk yield in the last lactation:11,503 ± 2402 kg; average length of the last lactation: 340.0 ± 50 days [mean ± SD]).
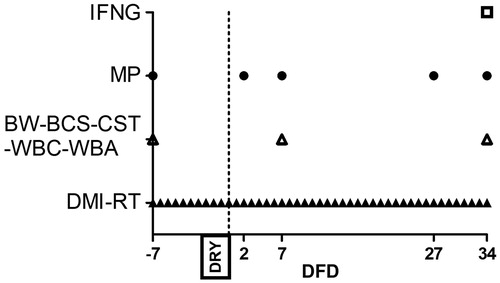
Figure 1. Scheduled time point, expressed as day from dry off (DFD), for dry matter intake and rumination time measurement (DMI-RT), body weight and body condition score determination, white blood cells profiling, whole blood stimulation assay and carrageenan skin test performance (BW-BCS-WBC-WBA-CST), haematic metabolic profile (MP), interferon gamma release assay (IFNG).
Body weight, body condition score, dry matter intake and rumination time
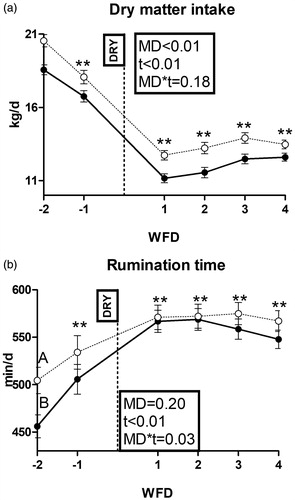
The body weight was measured with a single walking-in scale, and the body condition score (BCS) was determined from the same operator with a 1–5 scale (Agricultural Development and Advisory Service Citation1986) at −7, 7 and 34 DFD. BCS variation (ΔBCS) was calculated as the difference between data at −7 and 34 DFD. The daily dry matter intake was measured weighting the amounts of feed administered and residuals for each cow. Rumination time was registered using the Ruminact system (SCR Europe, Podenzano, PC, Italy) and expressed on a daily base (Figure ).
Health status
The body temperature was measured daily with a rumen bolus (DVM System TempTrack™, HerdStrong, LLC, Greeley, CO). Mastitis were diagnosed by visual evaluation of abnormal milk from each quarter and SCC analysis on suspicious cases, retained placenta when the foetal membranes were not expelled within 24 h after calving, endometritis and metritis according to Sheldon et al. (Citation2006), milk fever, displacement of abomasum and pneumonia by a veterinary diagnosis. Diarrhoea was diagnosed on visual evaluation of faeces consistency and colour through the faecal score method (Ireland-Perry and Stallings Citation1993), assuming diarrhoeic faeces those have a faecal score ≤2.
Blood samples collection
Blood samples were harvested through jugular venipunction in evacuated collection tubes (BD Vacutainer; BD and Co., Franklin Lakes, NJ) before the morning feeding. Samples were used to perform different assays (Figure ).
Metabolic profile assessment
For metabolic profile assessment (Figure ), samples were collected at −7, 2, 7, 27 and 34 DFD into heparinised tubes and processed as described by Calamari et al. (Citation2016). After collection, samples were centrifuged, and packed cells volume was determined. A clinical auto-analyzer (ILAB-650, Instrumentation Laboratory, Lexington, MA) was used to determine the concentration of glucose, non-esterified fatty acids (NEFA), beta-hydroxybutyrate (BHB), urea, creatinine, Ca, P, Mg, Na, K, Cl, Zn, aspartate amino transferase-glutamate oxaloacetate transaminase (AST-GOT), gamma glutamyl transferase (GGT), alkaline phosphatase (ALP), total protein, haptoglobin, ceruloplasmin, albumin, total bilirubin, cholesterol and globulin in accordance with Calamari et al. (Citation2016). Furthermore, reactive oxygen metabolites (ROMt), ferric reducing antioxidant power (FRAP), nitrate (NO3), nitrite (NO2) and nitric oxides (NOx) were determined according to Jacometo et al. (Citation2015), paraoxonase according to Bionaz et al. (Citation2007), thiol groups according to Minuti et al. (Citation2014), myeloperoxidase according to Bradley et al. (Citation1982) and advanced oxidation protein products (AOPP) according to Hanasand et al. (Citation2012). Finally, l- and d-lactic acid were determined with a commercial kit (K-DLATE, Megazyme Co., Wicklow, Ireland). A multi-detection microplate reader (BioTek Synergy 2, Winooski, VT) and commercial kits for ELISA method were used to determine the concentration of interleukin 1-beta (IL-1B; ESS0029; Thermo Scientific, Frederick, MD) and interleukin 6 (IL-6; ESS0027; Thermo Scientific, Frederick, MD) according to Jahan et al. (Citation2015) and those of serum amyloid alpha (SAA; TP-802, Tridelta D.L., Ireland). Commercial kits for cytokines were validated for cell culture media, and, thus, a validation on plasma has been performed previously (Mezzetti et al. Citation2019). Furthermore oxygen reactive antioxidant capacity (ORAC) were determined with a fluorometric method according to Jacometo et al. (Citation2015). Retinol, tocopherol and β-carotene were analysed by reverse-phase HPLC (LC-4000, Jasco Europe, Carpi MO, Italy), as described by Jahan et al. (Citation2015). Further details on the analytical procedures adopted in blood analysis are reported in Supplementary File 1.
White blood cells profile
For the white blood cells (WBC) profile (Figure ), samples were collected with K-EDTA tubes at −7, 7 and 34 DFD and analysed with Cell-DYN 3700 (Abbott Diagnostic Division, Santa Clara, CA). A laser optic assay was used to determine the amounts of total WBC, neutrophils, monocytes and eosinophils. The amount of red blood cells, haematocrit, number of platelets and mean platelet volume were determined via electrical impedance assay. The amount of haemoglobin was determined using spectrophotometry assay.
Whole blood stimulation assay
For whole blood stimulation assay (WBA, Figure ), blood samples were collected at −7, 7 and 34 DFD with heparinised serum tubes and stimulated with 0 (baseline), 0.01 (low dose; L) and 5 µg/mL (high dose; H) of bacterial lipopolysaccharides (LPS, Escherichia coli O111:B4; Sigma-Aldrich Company Ltd., Cambridge, UK, Cat. No. L3012), according to the method of Røntved et al. (Citation2005), adapted by Jahan et al. (Citation2015). After WBA, plasma samples were stored at −80 °C for the measurement of glucose, l- and d-lactic acid, IL-1B, IL-6, NOx, NO2 and NO3. Variation of plasma parameters after WBA with L and H doses of LPS were expressed as fold change relative to the baseline.
Interferon gamma release assay
For the interferon gamma (IFNG) release assay, whole blood samples were also collected into heparinised tubes at 34 DFD (Figure ). After collection, the tubes were stored in vertical position in a warm bath at a temperature of 38 °C and transported to the laboratory within 20 min for the stimulation procedure. Whole blood was used in an IFNG release assay for Mycobacterium avium (internal method IZSLER, MP 13/011). Briefly, two 1-mL aliquots of each blood sample were distributed in a 24-well plate. One well was supplemented with 100 µl of a 1:10 dilution of Mycobacterium avium purified protein derivative (PPD, IZS Umbria e Marche, Perugia, Italy) to PBS, and 1 well with 100 µl of sterile PBS as control. The plate was positioned in a heated incubator (Grant Boekel, HIR10 M) set to a temperature of 38 °C and with a relative humidity of 95% for 24 h. After incubation, the blood was centrifuged at 8500 × g for 16 min at 4 °C and plasma was stored at −20 °C until use. Plasma was later thawed and analysed in a sandwich ELISA assay for bovine IFNG with a couple of monoclonal antibodies, as previously described (Trevisi et al. Citation2014). Results were evaluated in terms of optical density difference (ΔOD) between avian PPD-stimulated and control wells.
Carrageenan skin test
The carrageenan skin test (CST) was performed according to the method of King (Citation1993), adapted by Jahan et al. (Citation2015), to evaluate peripheral immune responses at −7, 7 and 34 DFD (Figure ). The skin thickness was measured using a skinfold calliper (cat# 470119-588, VWR, USA) immediately before carrageenan injection (0 days), then 2 and 9 days after the injection. The total response to each challenge was calculated as the area under the curve of the thickness, measured at day 2 and day 9, subtracting the thickness measured at day 0.
Statistical analysis
Data in the tables are presented as mean and standard error. Before analysis, the normality of distributions was verified for each parameter by reckoning skewness and kurtosis according to the Shapiro test of SAS. Non-normally distributed parameters were normalised through natural logarithms (among plasma parameters the IL-1B, IL-6, L-lactic acid, haptoglobin, SAA, NEFA, thiol groups, AOPP and β-carotene, among WBA the fold changes of D-lactic acid, IL-1B, IL-6, NO2, NO3 and NOx and the total response to CST). Original values for log-transformed parameters have been presented in the Supplementary File 6. Incidence of health problems recorded during the study was evaluated by χ2 analysis (Freq procedure, SAS Inst. Inc., Cary, NC). Data of body weight, BCS, dry matter intake, rumination time, metabolic profile, WBC profile, WBA and CST were submitted to ANOVA using a mixed model for repeated measures (Mixed procedure, SAS Inst. Inc., Cary, NC). The statistical model included the fixed effect of milk yield at dry-off (MD; LM and HM), time (t) and their interaction (MD × t)
where yijk is the response at time k on animal j in MD group i, µ is the overall mean, αi is a fixed effect of MD group i, δij is a random effect of animal j in MD group i, τk is a fixed effect of time k, (ατ)ik is a fixed interaction effect of MD group i with time k, and eijk is random error at time k on animal j in MD group i. For those parameters that were measured daily (dry matter intake and rumination time) time effect considered the average weekly value, while for other parameters (BW, BCS, metabolic profile, WBC profile, WBA and CST) it considered single DFD. The time was considered as a repeated measure within the cow, and the cow was assumed as a random effect. For WBA, the dose (D; L and H) and the full interaction effect (MD × t×D) also were considered. The analysis was carried out using three covariance structures: autoregressive order, compound symmetry and spatial power with their heterogeneous counterparts. These were ranked according to their Akaike information criterion, with the one having the lowest Akaike information criterion being eventually chosen (Littell et al. Citation1998). Pairwise comparisons were done using the least significant difference test. For t effect, pairwise comparisons were done between data collected before dry-off (−7 DFD for body weight, BCS, metabolic profile, WBC profile, WBA and CST; −2 weeks from dry-off for dry matter intake and rumination time) and subsequent observations. Data of ΔBCS and IFNG release assay were analysed by a one-way ANOVA (GLM procedure, SAS Inst. Inc., Cary, NC), considering only the fixed effect of MD. Post-hoc comparisons were discussed when the p value for main effect was ≤.05. Main effects at p ≤ .10 are discussed in the context of tendencies.
Results
Body weight, body condition score, dry matter intake, rumination time and health status
Body weight was affected by time, while no effect appeared on BCS (Supplementary File 2). Both dry matter intake and rumination time were affected by time (Figure ). Dry matter intake was higher in HM than LM cows (p < .01) and rumination time was higher in HM than LM cows at −2 weeks from dry-off (p < .01).
Figure 2. Pattern of dry matter intake (a) and rumination time (b) in dairy cows with an average milk production lower (LM; solid line) or higher than 15 L·d−1 (HM; dotted line) in the week prior to dry off. MD is the effect of milk yield at dry off; t is time effect (**p < .01); MD × t is the interaction effect (A/B is p < .01); WFD is weeks from dry off; DRY is dry-off day (−55 days from expected calving).
No clinical diseases were recorded during the whole experimental period, and no MD effect was detected on the incidence of diseases in the first month of the following lactation (Supplementary File 3).
Metabolic profile
Haematocrit, energy, protein and mineral metabolism biomarkers
The packed cell volume was affected by time (Figure ). Among energy metabolism biomarkers, NEFA, BHB, l- and d-lactic acid were affected by time (Figure ). l-Lactic acid was higher in HM than LM cows at −7 DFD (p < .01; Figure ). Glucose did not show any effect (Supplementary File 4(a)). Among protein metabolism biomarkers, creatinine and urea were affected by time (Figure ). Creatinine tended also to be higher in HM than LM cows (p = .08). Among mineral metabolism biomarkers, Ca, Mg, P, Cl and Zn were affected by time (Figures ). Ca, Mg and K resulted higher in HM than LM cows (p = .03; = .06 and <.01; Figures , respectively). Na concentration did not show any effect (Supplementary File 4(b)).
Figure 3. Time course of packed cell volume (a) and plasma concentrations of NEFA (b), β-hydroxybutyrate (c), l-lactic acid (d), d-lactic acid (e), creatinine (f), urea (g), calcium (h) and magnesium (i) in dairy cows with an average milk production lower (LM; solid line) or higher than 15 L·d−1 (HM; dotted line) in the week prior to dry-off. MD is the effect of milk yield at dry-off; t is time effect (**p < .01; *p < .05; †p < .1); MD × t is the interaction effect (A/B is p < .01); DFD is days from dry-off; DRY is dry-off day (−55 days from expected calving); Log indicates data expressed as log-transformed.
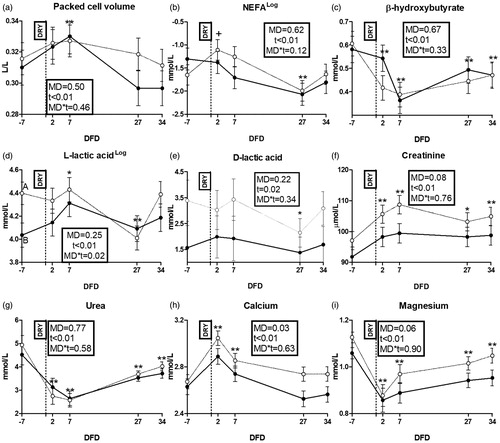
Figure 4. Time course of plasma concentrations of phosphorus (a); potassium (b), chlorine (c), zinc (d), γ-glutamyl transferase (e), bilirubin (f), alkaline phosphatase (g), protein (h) and globulin (i) in dairy cows with an average milk production lower (LM; solid line) or higher than 15 L·d−1 (HM; dotted line) in the week prior to dry-off. MD is the effect of milk yield at dry-off; t is time effect (**p < .01; *p < .05; †p < .1); MD × t is the interaction effect; DFD is days from dry-off; DRY is dry-off day (−55 days from expected calving).
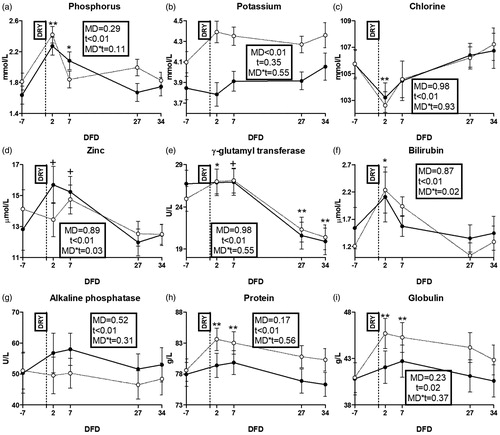
Liver function and inflammatory status biomarkers
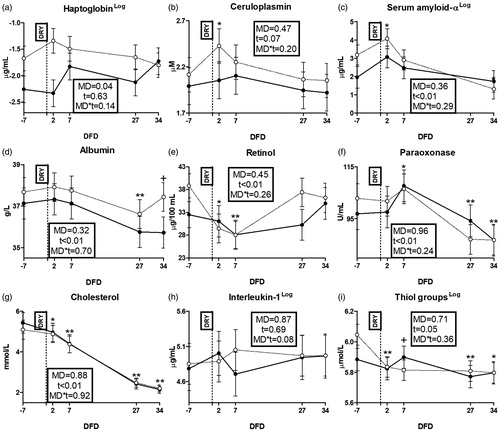
Among liver function biomarkers, GGT, bilirubin and ALP were affected by time (Figure ) while AST-GOT did not show any effect (Supplementary File 4(c)). Among inflammation biomarkers, total protein and globulin were affected by time (Figure ), while no effect appeared on myeloperoxidase (Supplementary File 4(d)). Among positive acute phase proteins (APP) indicators, ceruloplasmin and SAA were affected by time (Figures ), while haptoglobin resulted higher in HM than LM cows (p = .04; Figure ). Among negative APP indicators, albumin, retinol, paraoxonase and cholesterol were affected by time (Figure ). Among cytokines, IL-1B resulted numerically higher in HM than LM cows from 7 DFD to the end of the experimental period (Figure ). There was no effect on IL-6 concentration (Supplementary File 4(e)).
Figure 5. Time course of plasma concentrations of haptoglobin (a); ceruloplasmin (b); serum amyloid-α (c), albumin (d), retinol (e), paraoxonase (f), cholesterol (g), interleukin-1 (h) and thiol groups (i) in dairy cows with an average milk production lower (LM; solid line) or higher than 15 L·d−1 (HM; dotted line) in the week prior to dry-off. MD is the effect of milk yield at dry-off; t is time effect (**p < .01; *p < .05; †p < .1); MD × t is the interaction effect; DFD is days from dry-off; DRY is dry-off day (−55 days from expected calving); Log indicates data expressed as log-transformed.
Oxidant status biomarkers
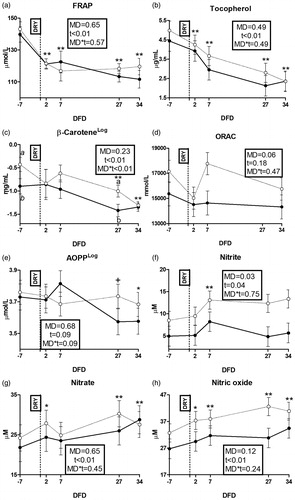
Among antioxidant systems biomarkers, thiol groups, FRAP, tocopherol and β-carotene were affected by time (Figures ). HM cows had higher concentrations of β-carotene at −7 and 27 DFD (p < .1 and <.05, respectively; Figure ) and tendentially higher concentrations of ORAC (p = .06; Figure ) than LM cows. Among oxidative damage biomarkers, a tendency for a time effect was detected for AOPP (Figure ). Among oxidant species, nitrite, nitrate and nitric oxides were affected by time (Figure ). Nitrite concentrations was higher in HM than LM cows (p = .03). No effect appeared on ROMt (Supplementary File 4(f)).
Figure 6. Time course of plasma concentrations of ferric reducing antioxidant power (FRAP; a); tocopherol (b), β-carotene (c), oxygen reactive antioxidant power (ORAC; d), advanced oxidation protein product (AOPP; e), nitrite (f), nitrate (g) and nitric oxide (h) in dairy cows with an average milk production lower (LM; solid line) or higher than 15 L·d−1 (HM; dotted line) in the week prior to dry-off. MD is the effect of milk yield at dry-off; t is the time effect (**p < .01; *p < .05; †p < .1); MD × t is the interaction effect (a/b is p < .05; a/b is p < .1); DFD is days from dry-off; DRY is dry-off day (−55 days from expected calving); Log indicates data expressed as log-transformed.
White blood cells profile, whole blood stimulation assay, interferon gamma release assay and carrageenan skin test
Among WBC profile (Table ), total WBC, neutrophils, monocytes, eosinophils, red blood cells, haemoglobin and haematocrit were affected by time. Platelets resulted numerically higher in HM than LM cows at 34 DFD. The mean platelet volume was lower in HM than LM cows (p = .06).
Table 2. White blood cells profile in dairy cows with an average milk production lower (LM) or higher (HM) than 15 L·d−1 in the week prior to dry-off.
Fold changes of cytokines after WBA were affected by time and had the greatest increase at the highest LPS dose (p < .01; Table ). Fold change of glucose tended to decrease and those of l-lactic acid increased by increased LPS dose (p = .06 and .03, respectively) while those of d-lactic acid was not affected by LPS treatment (Table ). Fold change of NOx tended to increase by increased LPS dose (p = .08) with a tendency for a higher response in LM cows before dry-off (p < .1) while those of NO2 was affected by time, independently from the LPS dose. Fold change of NO3 was not overall affected by WBA (Table ).
Table 3. Fold changes of cytokines after a whole blood stimulation assay with a low (L) or high (H) dose of bacterial lipopolysaccharides (LPS) in dairy cows with an average milk production lower (LM) or higher (HM) than 15 L·d−1 in the week prior to dry-off.
Table 4. Fold changes of glucose and metabolites thereof after a whole blood stimulation assay with a low (L) or high (H) dose of bacterial lipopolysaccharides (LPS) in dairy cows with an average milk production lower (LM) or higher (HM) than 15 L·d−1 in the week prior to dry-off.
Table 5. Fold changes of nitrite, nitrate and nitric oxides after a whole blood stimulation assay with a low (L) or high (H) dose of bacterial lipopolysaccharides (LPS) in dairy cows with an average milk production lower (LM) or higher (HM) than 15 L·d−1 in the week prior to dry-off.
Response to IFNG release assay and CST did not show any effect (Supplementary File 5(a,b)).
Discussion
Effects of dry-off on metabolism and immune system of dairy cows
Approaching to dry-off is related to physiological and nutritional changes that deeply affect nutrients requirements and feeding behaviour in dairy cows (Dingwell et al. Citation2001). These changes could justify the likelihood to develop a metabolic stress condition, even though the magnitude and duration of variations induced from dry-off in biomarkers related to wellbeing has been poorly investigated. Our results suggest that adaptation to high fibre content of dry ration had reduce dry matter intake and increased rumination time at dry-off. The further reduction of dry matter intake and the increase of body weight observed in late dry period suggests a reduction of the rumen volume driven by foetal growth, as two-thirds of the development of foetus are completed during this phase (Dingwell et al. Citation2001). A light mobilisation of lipid sources occurred at two DFD, as suggested by the tendency towards increased NEFA levels detected, although the lack of any effect on glucose and BHB indicates that glycaemia was not modified, and that liver has been able to fully oxidise the amount of NEFA received. Previous studies found similar patterns of energy metabolism biomarkers at dry-off paired with the decrease in insulin concentration (Odensten et al. Citation2005; Putman et al. Citation2018). Fat mobilisation could occur during the last week of lactation consequently to the hormonal response to the withdrawn of concentrates while milk production was still maintained, but adrenaline released at dry-off as a consequence of the milk stasis in the mammary gland could also have a role in the process (Dingwell et al. Citation2001). In fact, adrenaline is known to provide the primary stimulus for the mobilisation of NEFA from adipose tissue during a stressing event (Buckle Citation1962). The reduction of NEFA levels observed at 7 DFD suggests a mitigation of stressing conditions and a reduction of energy requirements (also reflected by the decreased dry matter intake) to occur after dry-off.
Changes in diet composition and feeding behaviour could partially account for the increase of lactate and for the reduction of BHB and urea levels found in plasma after dry-off. In fact, fluctuations of rumen pH occurring during adaptation to dry ration inhibit bacterial utilisation of lactate increasing its efflux to blood (Counotte and Prins Citation1981). On the other hand, a half of haematic BHB is directly related to the ruminal production of butyric acid (Church Citation1979), while plasmatic urea is paired with its concentration in rumen fluid (Marini and Van Amburgh Citation2003; Odensten et al. Citation2005), and both parameters are known to decrease in rumen during dry period consequently to the higher fibre content of the ration and the lower feed intake of the animals in comparison to lactation. Furthermore, blood urea partially arises from amino acids deamination (Broderick and Clayton Citation1997) and its lower level reflects also a lower utilisation of amino acids in gluconeogenetic processes in order to face the energy deficit after dry-off. This interpretation, together with the increased creatinine level after dry-off, suggests the interruption of milk synthesis to have reduced protein requirements, increasing the amount of amino acids addressed to anabolic processes. Indeed, creatinine is the product of the metabolism of one of the main molecules for the storage of energy in the muscle (i.e. phosphocreatine), and it is thus a direct indicator of muscular body mass (Hayden et al. Citation1992).
Effects of dry-off on mineral metabolism are mainly related to the interrupted milking routine. The presence of higher levels of Ca immediately after dry-off is consistent with previous results (Putman et al. Citation2018). Such an increase could arise from the sudden interruption of the mammary gland uptake from the haematic circulating pool of calcium. A contribution of the increased udder pressure arise from the stasis of milk residuals could also be hypothesised, as the tight junctions between epithelial cells are weaken during this phase, increasing paracellular transport of calcium in blood (Aslam and Tucker Citation1998). Both processes had a transient effect during milk stasis phase only, as the decreased calcium concentration observed from two DFD up to the end of the experimental period suggests the recovery of homeostasis in its haematic pool and the exhaustion of milk residuals in the mammary gland. The role of calcium-regulating hormones on phosphorus homeostasis account for the detection of similar trends for haematic Ca and P concentrations in our experiment, while the lower concentration of Mg found after dry-off was in agreement with its strong direct relationship with milk production (Cavestany et al. Citation2005).
Early involution of mammary gland that occurs at the beginning of dry period implies an important contribution of leukocytes (Putman et al. Citation2018). In our study, reduction of WBC, neutrophils and monocytes populations in blood observed after dry-off are consistent with results of Putman et al. (Citation2018) and are related to the migration of those cells to the mammary gland during acute involution (Atabai et al. Citation2007). The increased concentration of eosinophils in blood after dry-off is also consistent with results of Putman et al. (Citation2018), even though the interpretation is less certain. State that eosinophils are related to allergies and parasites (Gouon-Evans et al. Citation2000), it has been hypothesised that it may represent a subclinical hypersensitivity to the milk residuals in mammary gland after milking interruption (Putman et al. Citation2018). Such changes in leukocytes populations in blood are also paired with their augmented sensitivity to biological stressors, as reflected from our results of WBA test with LPS. In fact, increased production of interleukins and NO2 after dry-off reflects a greater production of metabolites related to inflammation and of oxidant species.
Leukocytes activation during involution phase could be seeing as a main cause of the systemic inflammatory status observed after dry-off, and reflected from trends of plasma parameters (Castell et al. Citation1989). Metabolic inflammation typically affects liver metabolism, implying severe losses in hepatic functions (Bertoni et al. Citation2008), and this is consistent with the increased GGT and bilirubin concentrations found in our cows during the first week after dry-off . In fact, GGT is an enzyme involved in AA metabolism that increase in blood mostly due to liver damages (Rodriguez-Jimenez et al. Citation2018), while bilirubin results from degradation of red blood cells, and its clearance depends on liver enzymes functioning (van den Top et al. Citation1996). A shift of anabolic priority of the liver named acute phase also occurs during systemic inflammations (Bertoni et al. Citation2008). In particular, the liver produces more α-globulins, known as positive APP, i.e. haptoglobin, ceruloplasmin and SAA (Ceciliani et al. Citation2012). This is consistent with the increased globulins and total proteins observed in our cows during the first week after dry-off, that could be driven from the α-globulins fraction, as they are paired to the increase in ceruloplasmin and SAA (Crisman et al. Citation2008). Conversely, the liver reduces the synthesis of albumin, retinol binding protein, paraoxonase and lipoproteins during the acute phase (Bertoni et al. Citation2008; Bertoni and Trevisi Citation2013) and the drop of retinol found at two DFD in our cows is thus consistent with a systemic inflammation occurred at dry-off. The incapacity to detect any sign of inflammation on blood concentrations of haptoglobin, albumin, paraoxonase and cholesterol (an indicator of lipoproteins synthesis) could depend on the different sensitivity to acute phase of these APPs. In fact, haptoglobin is known to peak instantaneously during acute phase, while negative APPs could require a longer time to reflect inflammatory conditions (Bertoni and Trevisi Citation2013; Minuti et al. Citation2015).
An increase in nitrate and nitrite concentrations found in blood after dry-off is consistent with results of Putman et al. (Citation2018), who related it to the altered redox status during early involution of the mammary gland. On the other hand, the increase of nitric oxide could be related to WBC activities at mammary level, as it is mainly produced by activated macrophages as a cytotoxic agent (Coleman Citation2001). Accumulation of such nitrogen species is known to trigger oxidative damages on macromolecules, as nitric oxide exerts a direct oxidative action, while nitrite is converted in nitrating agent for lipids and proteins by MPO during the neutrophils activation (Dedon and Tannenbaum Citation2004). Body effort to contain such oxidative damages could account for the depletion of antioxidant systems after dry-off, explaining the decrease in haematic thiol groups, tocopherol and β-carotene levels. In fact, thiol groups (and specifically glutathione) allow the reduction of a wide spectrum of hydroperoxides participating in the glutathione peroxidase enzymatic complex functioning (Sordillo and Aitken Citation2009), tocopherol is involved in the reduction of the chain propagation and amplification of lipid peroxidation process, while β-carotene indirectly participate in the protection against oxidative stress maintaining other antioxidant molecules in the reduced form (Ghiselli et al. Citation1995). Consumption of antioxidant systems in containing oxidative damages, together with their dysregulation during a systemic inflammatory status (Celi Citation2011), could account for the decrease in the general indicators of body antioxidant capacity (i.e. FRAP) observed after dry-off.
The reduction in AOPP found at 27 and 34 DFD suggests a decreased activity of leukocytes in mammary gland during dry period. In fact, AOPP represent a synthetic marker of protein oxidation exerted by hypochlorous acid, that is produced by MPO during neutrophils activation (Celi and Gabai Citation2015), and its reduction suggest the interruption of leukocytes contribution in mammary remodelling. The increased blood concentration of retinol and the decreased concentrations of positive APP and bilirubin found at 27 DFD suggest that the interruption of leukocytes activities in mammary gland allowed the organism to face the systemic inflammation occurred at milking interruption, recovering homeostasis in liver metabolism. On the other hand, the altered redox balance did not seem to ameliorate, as the production of nitrogen species and the consumption of antioxidant systems (thiol groups, FRAP, tocopherol and β-carotene) continued up to 34 DFD. At least for β-carotene and tocopherol, a contribution of the increased vitamins requirements in growing foetus could be hypothesised in such a reduction.
High milk yield at dry-off is related to greater stress in dry period
The risk related to dry-off a cow with a milk yield higher than 25 kg·d−1 has been deeply investigated previously (Dingwell et al. Citation2001; Rajala-Schultz et al. Citation2005). In this respect, the adoption of an average milk yield of 15 kg·d−1 in our study demonstrate that ‘safety threshold’ to dry-off a cow could be much lower, as haematic biomarkers allowed the detection of important alteration in the body homeostasis to occur in animals having the highest milk yield at dry-off. The higher dry matter intake found in HM cattle could be related to the higher production requirements driven by the higher milk production at dry-off, and the greater rumination time is consistent with the greater feed consumption. This is also in agreement with their greater pre dry-off lactate concentration that could be related to sustained high demand for glucose by the mammary gland, resulting in greater Cori cycle activity in other tissues, relative to the LM cows. Furthermore, linkage of Ca and Mg with milk production (Dingwell et al. Citation2001) explains the higher concentration of these minerals found in HM cows. In fact, higher mineral requirements related to production in those animals could lead to higher circulating minerals concentrations as soon as cows were dried-off. Those differences demonstrate that HM cows faced deeper changes during the metabolic adaptation to dry-off, reflecting a greater risk to develop metabolic stress in those animals. HM cows showed greater concentrations of haptoglobin and NO2 after dry-off, indicating that acute phase had a longer duration and that these animals required a longer time to recover homeostasis (Bertoni et al. Citation2008; Bertoni and Trevisi Citation2013; Osorio et al. Citation2014). The greater degree of inflammation is consistent with a longer mammary tissue remodelling phase in HM cows, probably related to the greater amount of parenchymatic tissue (Arslan et al. Citation2013; Putman et al. Citation2018). Despite that, higher blood concentrations of β-carotene and ORAC found both before and after dry-off suggested a greater antioxidant power in HM cows. Furthermore, lower fold variation of NOx found at WBA before dry-off suggested a less marked oxidant production in their WBC. State the relationship between stress, inflammation, oxidant molecules and metabolic disorders (Biswas and Lopez-Collazo Citation2009; Van Knegsel et al. Citation2014) our data suggest high milk yield at dry-off to increase the likelihood of diseases in dry period. Nevertheless, the greater antioxidant availability in blood of our HM cows suggests a greater scavenge capacity against oxidant molecules produced during inflammatory processes, and thus their greater ability to cope with such a potentially harmful condition.
Conclusions
Dry-off has been revealed as a challenging phase in high-yielding cow’s career, related to deep changes in feeding behaviour, metabolism and immune parameters. An inflammation occurred at dry-off in all the animals, probably because of leukocytes contribution in the involution phase of mammary gland, impairing liver function and altering redox balance during the early dry period. Animals with higher milk yield at dry-off showed the worst condition, and this could probably be related to the deeper metabolic changes they faced at dry-off consequently to milking interruption. This study highlights the dry-off as a challenging phase to manage dairy cows’ health and could depose for a relationship between dry-off and immune alteration that typically occurs around calving time. In order to demonstrate this, a study where cows are followed up during the subsequent lactation for all the parameters measured in the current experiment should be performed.
Ethical Approval
This study complied with Italian laws on animal experimentation (DL n. 26, 04/03/2014) and ethics (authorization of the Italian Ministry of Health n. 1047/2015-PR).
Supplemental Material
Download MS Word (932.1 KB)Acknowledgements
Heartfelt thanks would be given to professors Massimo Bionaz (Oregon State University) and Gianfranco Gabai (University of Padova) for precious suggestions provided during paper writing.
Disclosure statement
The authors declare that there is no conflict of interest associated with the paper. The authors alone are responsible for the content and writing of this article.
Additional information
Funding
Related Research Data
References
- Agricultural Development and Advisory Service. 1986. Condition scoring of dairy cows. Publication 612. Ministry of Agriculture, Fisheries Food (PubI.). Lion House, Alnwick, Northumberland NE66 2PF, UK.
- Arslan F, Smeets MB, Buttari B, Profumo E, Riganò R, Akeroyd L, Kara E, Timmers L, Sluijter JP, van Middelaar B, et al. 2013. Lack of haptoglobin results in unbalanced VEGFα/angiopoietin-1 expression, intramural hemorrhage and impaired wound healing after myocardial infarction. J Mol Cell Cardiol. 56:116–128.
- Aslam M, Tucker WB. 1998. Influence of intramammary infusion of calcium on the calcium status of periparturient lactating dairy cows1. J Dairy Sci. 81:1883–1888.
- Atabai K, Sheppard D, Werb Z. 2007. Roles of the innate immune system in mammary gland remodeling during involution. J Mammary Gland Biol Neoplasia. 12:37–45.
- Bertoni G, Trevisi E. 2013. Use of the liver activity index and other metabolic variables in the assessment of metabolic health in dairy herds. Vet Clin North Am Food Anim Pract. 29:413–431.
- Bertoni G, Trevisi E, Han X, Bionaz M. 2008. Effects of inflammatory conditions on liver activity in puerperium period and consequences for performance in dairy cows. J Dairy Sci. 91:3300–3310.
- Bertulat S, Fischer-Tenhagen C, Suthar V, Möstl E, Isaka N, Heuwieser W. 2013. Measurement of fecal glucocorticoid metabolites and evaluation of udder characteristics to estimate stress after sudden dry-off in dairy cows with different milk yields. J Dairy Sci. 96:3774–3787.
- Bionaz M, Trevisi E, Calamari L, Librandi F, Ferrari A, Bertoni G. 2007. Plasma paraoxonase, health, inflammatory conditions, and liver function in transition dairy cows. J Dairy Sci. 90:1740–1750.
- Biswas SK, Lopez-Collazo E. 2009. Endotoxin tolerance: new mechanisms, molecules and clinical significance. Trends Immunol. 30:475–487.
- Bradley PP, Priebat DA, Christensen RD, Rothstein G. 1982. Measurement of cutaneous inflammation: estimation of neutrophil content with an enzyme marker. J Invest Dermatol. 78:206–209.
- Broderick GA, Clayton MK. 1997. A statistical evaluation of animal and nutritional factors influencing concentrations of milk urea nitrogen. J Dairy Sci. 80:2964–2971.
- Buckle RM. 1962. The stimulating effects of adrenaline and anterior pituitary hormones on the release of free fatty acids from the adipose tissue. J Endocrinol. 25:189–198.
- Calamari L, Ferrari A, Minuti A, Trevisi E. 2016. Assessment of the main plasma parameters included in a metabolic profile of dairy cow based on Fourier Transform mid-infrared spectroscopy: preliminary results. BMC Vet Res. 12:4.
- Capuco AV, Akers RM. 1999. Mammary involution in dairy animals. J Mammary Gland Biol Neoplasia. 4:137–144.
- Castell JV, Gómez-Lechón MJ, David M, Andus T, Geiger T, Trullenque R, Fabra R, Heinrich PC. 1989. Interleukin-6 is the major regulator of acute phase protein synthesis in adult human hepatocytes. FEBS Lett. 242:237–239.
- Cavestany D, Blanc JE, Kulcsar M, Uriarte G, Chilibroste P, Meikle A, Febel H, Ferraris A, Krall E. 2005. Studies of the transition cow under a pasture-based milk production system: metabolic profiles. J Vet Med Ser A. 52:1–7.
- Ceciliani F, Ceron JJ, Eckersall PD, Sauerwein H. 2012. Acute phase proteins in ruminants. J Proteomics. 75:4207–4231.
- Celi P. 2011. Oxidative stress in ruminants. In: Mandelker L, Vajdovich P, editors. Totowa (NJ): Humana Press.
- Celi P, Gabai G. 2015. Oxidant/antioxidant balance in animal nutrition and health: the role of protein oxidation. Front Vet Sci. 2:48.
- Church DC. 1979. Nutrition. 2nd ed. Corvallis (OR): O & B Books.
- Coleman JW. 2001. Nitric oxide in immunity and inflammation. Int Immunopharmacol. 1:1397–1406.
- Counotte GHM, Prins RA. 1981. Regulation of lactate metabolism in the rumen. Vet Res Commun. 5:101–115.
- Crisman MV, Scarratt WK, Zimmerman KL. 2008. Blood proteins and inflammation in the horse. Vet Clin North Am Equine Pract. 24:285–297.
- Dedon PC, Tannenbaum SR. 2004. Reactive nitrogen species in the chemical biology of inflammation. Arch Biochem Biophys. 423:12–22.
- Dieho K, Bannink A, Geurts IAL, Schonewille JT, Gort G, Dijkstra J. 2016. Morphological adaptation of rumen papillae during the dry period and early lactation as affected by rate of increase of concentrate allowance. J Dairy Sci. 99:2339–2352.
- Dingwell RT, Kelton DF, Leslie KE, Edge VL. 2001. Deciding to dry-off: does level of production matter? In: National Mastitis Council Annual Meeting Proceedings. Madison, WI: National Mastitis Council. p. 69–79.
- Ghiselli A, Serafini M, Maiani G, Azzini E, Ferro-Luzzi A. 1995. A fluorescence-based method for measuring total plasma antioxidant capability. Free Radic Biol Med. 18:29–36.
- Gouon-Evans V, Rothenberg ME, Pollard JW. 2000. Postnatal mammary gland development requires macrophages and eosinophils. Development. 127:2269–2282.
- Hanasand M, Omdal R, Norheim KB, Gøransson LG, Brede C, Jonsson G. 2012. Improved detection of advanced oxidation protein products in plasma. Clin Chim Acta. 413:901–906.
- Hayden JM, Bergen WG, Merkel RA. 1992. Skeletal muscle protein metabolism and serum growth hormone, insulin, and cortisol concentrations in growing steers implanted with estradiol-17β, trenbolone acetate, or estradiol-17β plus trenbolone acetate. J Animal Sci. 70:2109–2119.
- Ireland-Perry RL, Stallings CC. 1993. Fecal consistency as related to dietary composition in lactating holstein cows. J Dairy Sci. 76:1074–1082.
- Jacometo CB, Osorio JS, Socha M, Corrêa MN, Piccioli-Cappelli F, Trevisi E, Loor JJ. 2015. Maternal consumption of organic trace minerals (4-Plex) alters calf systemic and neutrophil mRNA and microRNA indicators of inflammation and oxidative stress. J Dairy Sci. 98:7717–7729.
- Jahan N, Minuti A, Trevisi E. 2015. Assessment of immune response in periparturient dairy cows using ex vivo whole blood stimulation assay with lipopolysaccharides and carrageenan skin test. Vet Immunol Immunopathol. 165:119–126.
- King JN. 1993. The use of intradermal carrageenan in calves to estimate the dose of oxindanac, a nonsteroidal anti-inflammatory drug. Can J Vet Res. 57:215–222.
- Littell RC, Henry PR, Ammerman CB. 1998. Statistical analysis of repeated measures data using SAS procedures. J Anim Sci. 76:1216.
- Marini JC, Van Amburgh ME. 2003. Nitrogen metabolism and recycling in Holstein heifers. J Anim Sci. 81:545–552.
- Mezzetti M, Minuti A, Piccioli-Cappelli F, Amadori M, Bionaz M, Trevisi E. 2019. The role of altered immune function during the dry period in promoting the development of subclinical ketosis in early lactation. J Dairy Sci. 102:9241–9258.
- Minuti A, Ahmed S, Trevisi E, Piccioli-Cappelli F, Bertoni G, Jahan N, Bani P. 2014. Experimental acute rumen acidosis in sheep: consequences on clinical, rumen, and gastrointestinal permeability conditions and blood chemistry. J Anim Sci. 92:3966–3977.
- Minuti A, Bani P, Piccioli-Cappelli F, Uboldi O, Bacciu N, Trevisi E. 2015. Metabolic and biochemical changes in plasma of the periparturient rabbit does with different litter size. Animal. 9:614–621.
- Odensten MO, Chilliard Y, Holtenius K. 2005. Effects of two different feeding strategies during dry-off on metabolism in high-yielding dairy cows. J Dairy Sci. 88:2072–2082.
- Oliver SP, Sordillo LM. 1988. Udder health in the periparturient period. J Dairy Sci. 71:2584–2606.
- Osorio JS, Trevisi E, Ji P, Drackley JK, Luchini D, Bertoni G, Loor JJ. 2014. Biomarkers of inflammation, metabolism, and oxidative stress in blood, liver, and milk reveal a better immunometabolic status in peripartal cows supplemented with Smartamine M or MetaSmart. J Dairy Sci. 97:7437–7450.
- Padgett DA, Glaser R. 2003. How stress influences the immune response. Trends Immunol. 24:444–448.
- Putman AK, Brown JL, Gandy JC, Wisnieski L, Sordillo LM. 2018. Changes in biomarkers of nutrient metabolism, inflammation, and oxidative stress in dairy cows during the transition into the early dry period. J Dairy Sci. 101:9350–9359.
- Rajala-Schultz PJ, Hogan JS, Smith KL. 2005. Short communication: association between milk yield at dry-off and probability of intramammary infections at calving. J Dairy Sci. 88:577–579.
- Rodriguez-Jimenez S, Haerr KJ, Trevisi E, Loor JJ, Cardoso FC, Osorio JS. 2018. Prepartal standing behavior as a parameter for early detection of postpartal subclinical ketosis associated with inflammation and liver function biomarkers in peripartal dairy cows. J Dairy Sci. 101:8224–8235.
- Røntved CM, Andersen JB, Dernfalk J, Ingvartsen KL. 2005. Effects of diet energy density and milking frequency in early lactation on tumor necrosis factor-alpha responsiveness in dairy cows. Vet Immunol Immunopathol. 104:171–181.
- Shamay A, Shapiro F, Leitner G, Silanikove N. 2003. Infusions of casein hydrolyzates into the mammary gland disrupt tight junction integrity and induce involution in cows. J Dairy Sci. 86:1250–1258.
- Sheldon IM, Lewis GS, LeBlanc S, Gilbert RO. 2006. Defining postpartum uterine disease in cattle. Theriogenology. 65:1516–1530.
- Silanikove N, Merin U, Shapiro F, Leitner G. 2013. Early mammary gland metabolic and immune responses during natural-like and forceful drying-off in high-yielding dairy cows. J Dairy Sci. 96:6400–6411.
- Sordillo LM, Aitken SL. 2009. Impact of oxidative stress on the health and immune function of dairy cattle. Vet Immunol Immunopathol. 128:104–109.
- Trevisi E, Jahan N, Bertoni G, Ferrari A, Minuti A. 2015. Pro-inflammatory cytokine profile in dairy cows: consequences for new lactation. Ital J Anim Sci. 14:285–292.
- Trevisi E, Zecconi A, Bertoni G, Piccinini R. 2010. Blood and milk immune and inflammatory profiles in periparturient dairy cows showing a different liver activity index. J Dairy Res. 77:310–317.
- Trevisi E, Zecconi A, Cogrossi S, Razzuoli E, Grossi P, Amadori M. 2014. Strategies for reduced antibiotic usage in dairy cattle farms. Res Vet Sci. 96:229–233.
- van den Top AM, Geelen MJH, Wensing T, Wentink GH, van 'T Klooster AT, Beynen AC. 1996. Higher postpartum hepatic triacylglycerol concentrations in dairy cows with free rather than restricted access to feed during the dry period are associated with lower activities of hepatic glycerolphosphate acyltransferase. J Nutr. 126:76–85.
- Van Knegsel ATM, Hammon HM, Bernabucci U, Bertoni G, Bruckmaier RM, Goselink RMA, Gross JJ, Kuhla B, Metges CC, Parmentier HK, et al. 2014. Metabolic adaptation during early lactation: key to cow health, longevity and a sustainable dairy production chain. CAB Rev Perspect Agric Vet Sci Nutr Nat Resour. 9:1–15.
- von Keyserlingk MAG, Olenick D, Weary DM. 2008. Acute behavioral effects of regrouping dairy cows. J Dairy Sci. 91:1011–1016.
- Wilde CJ, Addey CV, Bryson JM, Finch LM, Knight CH, Peaker M. 1998. Autocrine regulation of milk secretion. Biochem Soc Symp. 63:81–90.
- Zobel G, Weary DM, Leslie KE, von Keyserlingk MAG. 2015. Invited review: cessation of lactation: effects on animal welfare. J Dairy Sci. 98:8263–8277.