
 ?Mathematical formulae have been encoded as MathML and are displayed in this HTML version using MathJax in order to improve their display. Uncheck the box to turn MathJax off. This feature requires Javascript. Click on a formula to zoom.
Abstract
The objective of this work was to evaluate the effects of breed and heterosis on the estimates of genetic parameters of 305-day milk yield (305MY), by fitting milk yield data to the Wood, Mixed Log, Morgan, and Wilmink non-linear models. A total of 258,891 test-day milk yield records of 37,965 Holstein (H), Gyr (G), and Girolando (1/2 H, 1/4 H, 3/4 H, 3/8 H, 5/8 H and 7/8 H genetic groups) cows from 1840 herds were collected in the state of Minas Gerais, Brazil, in the period of 1998 to 2014. The pedigree file included 36,640 animals, 3677 bulls and 24,472 cows. The genetic parameters were obtained by one-character analysis using the AIREMLF90 software. The heritability estimates of 305MY, and of 305MY fitted to the different nonlinear models ranged from 0.14 to 0.20. Most genetic groups had heterosis effect, with the greatest effects for 305MY on 1/2 H (1/2 Holstein × 1/2 Gyr) cows, presenting a milk yield of 1112.73 kg higher than the average of their parents. The results indicate that most genetic groups of Girolando present heterosis effect for 305MY estimated through nonlinear models, and the possibility of obtaining moderate genetic gains when these animals are subjected to selection procedures.
The use Girolando cows in production systems in Brazil has shown positive results of production.
This greater productive efficiency may be because of heterosis on the production and adaptation of these animals.
The effect of breed and heterosis can be included in traditional models for the improvement of selection.
HIGHLIGHTS
Introduction
Strategies for crossbreeding Bos taurus taurus with Bos taurus indicus are important in Brazil to achieve the balance between yield and adaptability of animals to adverse conditions in the country (Santos et al. Citation2013) and explore the benefits of heterosis and complementarity originated from the crossbreeding between different breeds (Canaza-Cayo et al. Citation2014).
The first crosses between Gyr and Holstein cattle intending to form the Girolando breed started in the 1940s (Facó et al. Citation2002; Silva et al. Citation2015). The use of this breed in production systems in Brazil has shown positive results of production. Silva et al. (Citation2016) reported an increase of 41% in milk production of Girolando cows between 2000 and 2014. Although Girolando cows present lower milk production than Holstein cows, they present greater resistance to ectoparasites and hot weather and greater productive efficiency when farmed in medium to low technological production systems (Facó et al. Citation2002; McManus et al. Citation2008). This greater productive efficiency may be because of heterosis on the production and adaptation of these animals. This shows the need for conducting studies on the effect of heterosis in milk production of Girolando cows.
The use of mathematical models to describe milk production during lactation in genetic breeding programmes (Hossein-Zedeh Citation2017) allows the establishment of strategies to optimising the selection, and the search for efficient and profitable genotypes (Oliveira et al. Citation2007). Moreover, these models allow the evaluation of different components of the lactation curve of the animals, such as milk yield peak, yield peak time, and lactation persistency. Knowing the mathematical model that best fits the lactation curve enables the estimation of genetic parameters and prediction of genetic values. Moreover, the effect of breed and heterosis can be included in traditional models for the improvement of selection procedures for the traits of economic importance that are affected by these variables.
In the literature, there are several models widely used to describe lactation curves of different breeds. There are also those models that have not yet been used for this purpose, especially in the Girolando breed. Therefore, several of those models were used to study heterosis in this breed. Therefore, the objective of this work was to evaluate the effects of breed and heterosis on the estimates of genetic parameters of 305-day milk yield (305MY), by fitting test day milk yield records to the Wood, Mixed Log, Morgan, and Wilmink non-linear models.
Material and methods
Data
Milk production data were obtained from the Association of Holstein Breeders of Minas Gerais, Brazilian Association of Dairy Gyr, and Brazilian Association of Girolando. The dataset consisted of 258,891 test day milk yield records of 37,965 cows from 1840 herds, which were collected in the state of Minas Gerais, Brazil, in the period of 1998 to 2014. These cows were from the Holstein (H), Gyr (G), and Girolando breeds. Six genetic crossbreedings of Holstein (H) × Gyr (G) crossbreeds (1/4 H, 3/4 G (1/4 H); 3/8 H, 5/8 G (3/8 H); 1/2 H, 1/2 G (1/2 H); 5/8 H, 3/8 G (5/8 H); 3/4 H, 1/4 G (3/4 H); 7/8 H, 1/8 G (7/8 H)) were used; animals from these groups are officially called Girolando in Brazil.
The effect of breed and heterosis on the 305-day milk yield (305MY) was evaluated by fitting the test day milk yieldsrecords to the Wood (305MY-WD), Mixed Log (305MY-ML), Morgan (305MY-MG), and Wilmink (305MY-WL) models.
Only first lactation cows were maintained for the analyses, considering complete lactations (305 days in milk) when the cow had a minimum of 4 and maximum of 10 test days. The test-day milk yield, and 305-day milk yield records were not considered when the daily milk yield was not between 3 kg and 45 kg. The production data were edited and the breed group, heterosis coefficient, genetic group of the animal, genetic group of the sire, genetic group of the dam, and number of cows were determined (Table ).
Table 1. Number of cows per genetic group according to heterosis coefficient.
The contemporary groups (CG) were defined by herd-year of calving in the 305MY analysis. Only CG with at least three controls of cows from at least two bulls were considered. Two calving periods were considered, October to March and April to September. The pedigree file included 36,640 animals, 3677 bulls and 24,472 cows. The birth period of animals in the pedigree file was 1979 to 2009, and included the Holstein, Gyr, and Girolando breeds.
Lactation curve models
The nonlinear models used to fit the test day milk yield data along the lactation of the Holstein, Gyr, and Girolando animals were:
Wood gamma model (WD) (Wood Citation1967):
Mixed Log (ML) (Guo and Swalve Citation1995):
Morgan model (MG) (Thornley and France Citation2007):
Wilmink model (WL) (Wilmink Citation1987):
Statistical analyses
The normal distribution test of milk production levels for different genetic groups was applied. Data were tested for non-normality by the Shapiro–Wilk and Kolmorgorov–Smirnov test. The non-linear models were adjusted to the milk yield records as the iteration method of Gauss–Newton.
The models were tested using root mean square error (RMSE), Akaike’s information criterion (AIC), and Bayesian information criterion (BIC).
RMSE (generalised standard deviation) was calculated using the equation:
wherein RSS is residual sum of squares, n is the number of observations (data points), and p is the number of parameters of the equation.
AIC was calculated using the equation (Burnham and Anderson Citation2002):
BIC was calculated using the equation:
The lowest numerical values of RMSE, AIC and BIC indicated the better fit when comparing the different models.
Breed and heterosis effects
The proportion of genes was calculated for each cow using the equation:
where
is the porportion of genes from breed
in the progeny,
is the proportion of breed
in the sire, and
is the proportion of breed
in the dam.
Coefficients of specific heterosis in a given cross were calculated between any pair of the dairy breeds using the following identity (Dickerson Citation1973):
where
is the coefficient of expected heterosis between fractions of breeds
and
in the progeny,
and
are proportions of breeds
and
in the sire, and
and
are proportions of breed
and
in the dam.
These specific effects of heterosis were used for the six genetic groups of Girolando, because the distribution of cows across coefficients of expected heterosis was suitable for this purpose (Penasa et al. Citation2010). The coefficient of general heterosis for each cow was obtained by summing previously calculated coefficients of specific heterosis.
Genetic parameters
The 305MY was evaluated by fitting the test day milk yields records to the 305MY-WD, 305MY-ML, 305MY-MG, and 305MY-WL models, later they were analysed by means of the animal model, in one-character analysis. The components of variance were estimated by the maximum likelihood-restricted method, using a derivative-free algorithm, using the software AIREMLF90 (Misztal et al. Citation2014). The convergence criterion was 1 × 10⁻¹².
Model and analysis
The model included the direct additive genetic effect and the residual effect as random, the systematic effects of GC, breed, heterosis, and the covariant cow age (linear and quadratic effect). The model can be represented in matrix form by the equation:
wherein
is the vector of records for 305MY;
is the vector of the fixed effects,
is the vector of random animal effects, including animals without records;
is the vector of random residual effects, e ∼ NID (0,
); and
and
are incidence matrices assigning observations to fixed and random animal effects, respectively.
Results
Considering all models, the lowest mean RMSE (Table ) was found for the G group, followed by the 7/8 H, and 5/8 H groups. The lowest mean AIC and BIC were found in the 1/4 H group.
Table 2. Quality-of-fit of 305-day milk yield means to Wood (WD), Mixed Log (ML), Morgan (MG) and Wilmink (WL) models.
The highest milk production was found for cows of the H group (Table ), followed by the 7/8 H, 1/2 H, and 3/4 H groups, regardless of the 305MY fitting. Contrastingly, cows in the G group had the lowest performance for 305MY, 305MY-WD, 305MY-ML, 305MY-MG and 305MY-WL.
Table 3. Least mean squares and standard errors for 305-day milk yield (kg) in different non-linear models for Holstein cows (H), Gyr (G), and different genetic groups of the Girolando breed.
The genetic variance estimates for 305MY were higher than those obtained by the 305MY-WD, 305MY-ML, and 305MY-WL (Table ). Similar results were found for estimates of residual variance. Heritability estimates for 305MY (0.14 ± 0.01), and similar estimates were found for 305MY-WD (0.18 ± 0.02), and 305MY-WL (0.17 ± 0.02). The highest estimates of heritability were found for 305MY-MG (0.20 ± 0.02).
Table 4. Estimates of variance components and heritability (h2) of 305-day milk yield (kg) estimated by different nonlinear models.
The effect of breed (Table ) showed that only cows of group 7/8 H presented positive performance (440.95 kg to 305MY). The effects of breed found in the different genetic groups for 305MY-ML, 305MY-MG, and 305MY-WL were similar to those found for 305MY. The 305MY-WD estimate was the one that most differed from the 305MY.
Table 5. Breed effect with standard error estimated by the Wood (WD), Mixed Log (ML), Morgan (MG), and Wilmink (WL) models.
The effect of heterosis (Figure ) was higher for animals with heterosis coefficients of 1.0, represented by the 1/2 H group, with superior milk yields to their parents 1112.73 kg, 875.09 kg, 1421, 46 kg, 1335.83 kg, and 1433.35 kg for 305MY, 305MY-WD, 305MY-ML, 305MY-MG, and 305MY-WL, respectively. The estimated heterosis decreased with decreasing the heterosis coefficient, which was zero for the heterosis coefficient of 0.250 (7/8 H). The animals with heterosis coefficients of 0.375 and 0.406 were from the same genetic group (3/4 H), but from different crosses (Table ) and did not present heterosis effect for 305MY, 305MY-WD, 305MY-ML, 305MY-MG, and 305MY-WL. However, the animals with heterosis coefficients of 0.438, 0.469, and 0.500 represented by the 5/8 H group had positive heterosis effect for 305MY, 305MY-ML, 305MY-MG, and 305MY-WL.
Figure 1. Estimation of heterosis (kg) for 305-day milk yield (305MY) according to the heterosis coefficient of the different genetic groups of Girolando cows, obtained by the Wood’s model (305MY-WD), Mixed Log function (305MY-ML), Morgan model (305MY-MG) and Wilmink model (305MY-WL).
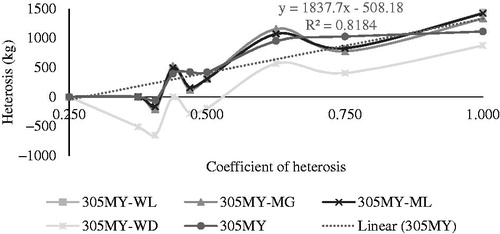
Different from other models, the 305MY-WD indicated that only animals with heterosis coefficients of 0.625 (566.86 kg), 0.750 (404.49 kg), and 1.0 (875.09 kg) were affected by positive heterosis.
The linear regression of the heterosis curves of the animals with heterosis coefficients of 0.250 to 1.0 presented trends of 1837.70 kg, 1800.10 kg, 2173.3 kg, 2080.10 kg, and 2203.20 kg for 305MY, 305MY-WD, 305MY-ML, 305MY-MG, and 305MY-WL, respectively (Table ). The R2 values ranged from 0.64 to 0.81. The WD model underestimated the effect of heterosis for all animals, regardless of their heterosis coefficients (Figure ).
Table 6. Linear regression of the heterosis curve.
Discussion
The breed composition of cows affected the 305-day milk yield (305MY) (Table ); cows with higher proportion of Holstein genes (H, 7/8 H, 3/4 H, and 1/2 H) had higher milk yield than cows with higher proportion of Gyr genes (1/4 H and 3/8 H). The mean 305MY of Holstein cows was 2726.94 kg higher than that of Gyr cows.
The effect of genetic groups on 305MY in Girolando cows in Brazil was also observed by McManus et al. (Citation2008), and Balancin Júnior et al. (Citation2014). Balancin Júnior et al. (Citation2014) identified the genetic groups 7/8 H, 3/4 H and 1/2 H as the ones with the highest milk production. McManus et al. (Citation2008) found higher mean 305MY for the 3/4 H group, followed by the 1/2 H, 3/8 H and 1/4 H.
When test day milk yield records were fitted to the different nonlinear models (WD, ML, MG, and WL), the highest averages were found for the H group, followed by the 7/8 H, 1/2 H, and 3/4 H; and the lowest were found for the G group. The different models (WD, ML, MG, and WL) followed the same trend of the 305MY. However, when evaluating the quality-of-fit criteria, larger differences for 305MY estimated by nonlinear models were found, with differences between fitting models varying according to the genetic group.
The WD model presented the lowest differences between mean 305MY estimates for the H and 7/8 H groups. This result agrees with the RMSE, AIC and BIC found, which were lower in these groups (H and 7/8 H) through the WD model. Torshizi et al. (Citation2011) evaluated different non-linear models in primiparous Holstein cows in Irãn and found a lower RMSE for the WD model when compared to the WL model, showing a better prediction of milk production. The Wood model is one of the best and most popular mathematical models to describe lactation curves in dairy cattle (Gradiz et al. Citation2009; Macciotta et al. Citation2011).
The WL model was the one that best described the 305MY for the G, 1/2 H, and 1/4 H groups; it presented the lowest differences between the mean 305MY estimates and lowest RMSE, AIC, and BIC. Contrastingly, Bangar and Verma (Citation2017) evaluated different non-linear models for Gyr cows in India and found better prediction using the WD model, in terms of RMSE and AIC, when compared to the WL model. WD and WL models have been successfully used for fitting individual lactation curves of dairy cattle (Macciotta et al. Citation2005; Torshizi et al. Citation2011).
The ML and WL models were the ones that best described the milk production of cows of the 3/4 H, 3/8 H, and 5/8 H groups, regarding the difference between the production estimated by the models and the observed production (305MY). However, they presented a high quality-of-fit variation for these genetic groups when tested by the RMSE, AIC and BIC criteria. This variation in the quality-of-fit of the models for the lactation curve depends not only on the mathematical functions, but on the calving order of the cows (Şeahin et al. Citation2015), and biological nature of the lactation itself, which varies randomly between the cows (Gantner et al. Citation2010). Despite only primiparous cows from the same region were used, the analyses were performed with different genetic groups and individual lactations; this may have caused these quality-of-fit variations.
The 305MY and its variation was estimated by different mathematical models; thus, it probably affected the variation of the heritability estimates, which were moderated. These moderate and expected heritability indicates that the additive genetic action had limited effect, and genetic and environmental factors were important in its expression (Dangar and Vataliya Citation2017). Similarly, Kim et al. (Citation2009) found heritability of 0.14 to 305MY in Holstein cows. Low heritability for 305MY were also found by Singh et al. (Citation2001) (0.11) and Ulmek (Citation1990) (0.12) for the Gyr breed. Higher heritability for 305MY in Girolando cows were reported by Canaza-Cayo et al. (Citation2018) (0.27) and Facó et al. (Citation2008) (0.21). The differences in heritability estimates found in these studies can be attributed to several factors, such as production level, population size, analysis model, variable assessed (fitted, or total milk production), and environmental effects (Canaza-Cayo et al. Citation2018). Regardless of the variations between heritability estimates by the mathematical models for 305MY, all estimates showed moderate heritability, that is, these mathematical models can be used to estimate genetic parameters of milk production at 305 days. Therefore, effects of heterosis on other characteristics can be studied, such as the peak and persistence of lactation, in further genetic evaluations fitted to nonlinear models.
The effect of heterosis is important in different Girolando genetic groups in Brazil, when evaluating 305-day milk yield (Facó et al. Citation2002, Citation2008). Animals with heterosis coefficient of 1.0 (1/2 H) presented a greater heterosis effect to 305MY, as well as when fitted to the different nonlinear models (305MY-WD, 305MY-ML, 305MY-MG and 305MY -WL) (Figure ). This result was expected because heterosis is more intense in this group because the parental breeds were more genetically distant (Wentworth Citation1927). When parental breeds have different alleles, or frequency of different alleles, offspring will show greater heterogeneity and heterosis compared to crosses between parental breeds with similar allele frequencies (Sorensen et al. Citation2008). This is fully expressed in animals 1/2 H, in which all pairs of genes have one gene from each breed.
Heterosis effects for 305MY, 305MY-ML, 305MY-MG and 305MY-WL were observed in all heterosis coefficients, except for animals with coefficients of 0.250, 0.375 and 0.406 (Figure ). This indicates that most genetic groups had higher average milk production at 305 days than their parents. These results demonstrate the importance of heterosis in the expression of milk production of cows in populations composed of animals of different genetic groups, such as the Girolando breed in Brazil. Thus, it is noteworthy that the inclusion of the heterosis effect in the models used in the genetic evaluation of the breed to predict the genetic values of bulls is of fundamental importance, possibly increasing the prediction accuracy.
In practical terms, such results reveal to breeders and industry that it is possible to increase performance gains through simple processes of exploiting the effect of heterosis among zebu. If this effect can be obtained by careful combination of genetic material (animals of different breed proportions), this gain can be achieved without raising production costs.
According to McManus et al. (Citation2008), animals that showed heterosis effects may have better adaptation to the environment to which they were subjected. The term adaptation in this case should be understood in a broad sense. It means that the types of genes acting on the genotypes of Girolando animals make them to have better performances.
Contrastingly, animals from the 3/4 H group from different crosses (Table ) with heterosis coefficients of 0.375 and 0.406 did not show positive heterosis effect for 305MY, or for the 305MY fitted to the different non-linear models. This may have occurred due to the loss of positive epistatic effects resulting from the gene recombination that occurs by crossings (Facó et al. Citation2008). Breakdown of favourable epistatic interactions may occur in the recombination process during meiosis when the breeds involved in the crossing are selected in different directions for a long time (Dickerson Citation1973). According to Facó et al. (Citation2008), the genetic recombination observed in some types of mating produces detrimental effects to milk production.
Canaza-Cayo et al. (Citation2018) found better productive performance for the 3/4 H and 7/8 H groups and attributed this result to the improved environment of these herds, which favoured the performance of animals with higher proportion of Holstein genes. However, animals with heterosis coefficients of 0.438 and 0.469 (5/8 H group) from different crosses showed a positive heterosis effect (Table ). The 5/8 H group is composed of pure animals of the Girolando breed and come from different parents. Thus, heterosis does not guarantee that crosses can bring favourable epistatic interactions. In this case, a subsequent selection programme is important because the large genetic compositions of the Girolando breed can guarantee moderate genetic gains for milk production and contribute to the improvement of the productive efficiency of the herd when properly used in breeding programmes (Canaza-Cayo et al. Citation2018).
The evaluation of the heterosis effect showed that only the Wood model differed from the other nonlinear models (ML, MG, and WL) when estimating milk production at 305 days (Figure ). This denotes that the estimates obtained by the other models (ML, MG and WL) were more similar to 305MY than that obtained by the WD model. The quality-of-fit of the models is shown by several factors, such as the differences between races (Khan et al. 2012), and individual production, which varies between lactations of the same animal (Gantner et al. Citation2010). Therefore, not all cows in the same herd have the same lactation curves, especially when there is a genetic distance such as that between the H (Bos taurus taurus) and G (Bos taurus indicus) groups.
The lactation curve found for Holstein cows can be divided into three phases: ascending, peak, and descending (Cruz et al. Citation2009). However, it is different in zebu breeds and their crosses, the lactation curve is generally composed of two segments, the initial production, and the rate of decline (Cobuci et al. Citation2001). Thus, WD model presented the best fit for milk production records on the day of the control of animals of the H and 7/8 H group, that is, for the animals with a higher proportion of Holstein genes. This may have caused the WD model to have a poor estimating of the heterosis effect of the different genetic groups that make up the Girolando breed when compared to the other models studied.
Conclusions
The estimated lactation curve for cows of different Girolando genetic groups is dependent on the mathematical model chosen. It is utopian to expect a single model to properly adjust the lactation curves of various genetic groups. The effect of heterosis on milk yield was important for most of the breed genetic groups, and 1/2 H 1/2 G animals presented higher heterosis among the groups. A careful combination of genetic material (animals of different racial proportions) enables breeders and the dairy industry to benefit from the performance gains generated by heterosis without rising production costs. Considering the observed importance of heterosis it is essential that the genetic evaluation processes of the breed consider the heterosis effect to predict the genetic values of bulls and cows in order to increase their prediction accuracy.
Ethical approval
All authors declare that this study follows the principles of the Declaration of Helsinki.
Acknowledgments
The authors thank the Associação dos Criadores de Gado Holandês de Minas Gerais (ACGHMG); the Associação Brasileira dos Criadores de Gir Leiteiro (ABCGIL); the Associação Brasileira de Girolando (ABCG); the Empresa Brasileira de Pesquisa Agropecuária – EMBRAPA Gado de Leite for providing the data and Coordenação de Aperfeiçoamento de Pessoal de Nível Superior – Brasil (CAPES), for funding part of this study – Finance Code 001.
Disclosure statement
No potential conflict of interest was reported by the authors.
Related Research Data
References
- Balancin Júnior A, Prata MA, Moreira HL, Vercesi Filho AE, Cardoso VL, El Faro L. 2014. Avaliação de desempenho produtivo e reprodutivo de animais mestiços do cruzamento. Bol Ind Anim. 71:357–364.
- Bangar YC, Verma MR. 2017. Non-linear modelling to describe lactation curve in Gir crossbred cows. J Anim Sci Technol. 59:1–7.
- Burnham KP, Anderson DR. 2002. Model selection and multimodel inference: a practical-theoretic approach, 2nd ed. Berlin: Springer-Verlag.
- Canaza-Cayo AW, Lopes PS, Cobuci JA, Martins MF, Silva M. 2018. Genetic parameters of milk production and reproduction traits of Girolando cattle in Brazil. Ital J Anim Sci. 17:22–30.
- Canaza-Cayo AW, Lopes PS, Silva M, Cobuci JA, Torres RA, Martins MF, Arbex WA. 2014. Estrutura populacional da raça Girolando. Cienc Rural. 44:2072–2077.
- Cobuci JA, Euclydes RF, Teodoro RL, Verneque RS, Lopes PS, Silva MA. 2001. Aspectos genéticos e ambientais da curva de lactação de vacas da raça Guzerá. R Bras Zootec. 30:1204–1211.
- Cruz GRB, Ribeiro MN, Pimenta Filho EC. 2009. Estimativas de parâmetros de curvas de lactação de bovinos. Arch Zootec. 58:695–704.
- Dangar N, Vataliya P. 2017. Heritability of production and reproduction traits in Gir cattle. Int J Livest Res. 94:46–49.
- Dickerson G.E. 1973. Inbreeding and heterosis in animals. In: Lush JL; American Dairy Science Association; American Society of Animal Science; Poultry Science Association, editors. Proceedings of the Animal Breeding and Genetics Symposium in honor of Dr. Jay L. Lush. Champaign (IL): American Society of Animal Science. p. 54–77.
- Facó O, Lôbo R.N.B, Martins Filho R, Martins GA, Oliveira SMP, Azevêdo D. 2008. Efeitos genéticos aditivos e não-aditivos para características produtivas e reprodutivas em vacas mestiças Holandês × Gir. R Bras Zootec. 37:48–53.
- Facó O, Lôbo RNB, Martins Filho R, Moura AA. 2002. Análise do desempenho produtivo de diversos grupos genéticos Holandês × Gir no Brasil. R Bras Zootec. 31:1944–1952.
- Gantner V, Jovanovac S, Raguz N, Solic D, Kuterovac K. 2010. Nonlinear vs. Linear Regression models in lactation curve prediction. BJAS. 16:794–800.
- Gradiz L, Alvarado L, Kahi AK, Hirooka H. 2009. Fit of Wood’s function to daily milk records and estimation of environmental and additive and non-additive genetic effects on lactation curve and lactation parameters of crossbred dual purpose cattle. Livest Sci. 124:321–329.
- Guo Z, Swalve HH. 1995. Modelling of the lactation curve as a sub-model in the evaluation of test day records. Proceedings of the Interbull Meeting; Sep 7–8; Prague. Interbull Bulletin No. 11.
- Hossein-Zadeh G|N. 2017. Application of growth models to describe the lactation curves for test-day milk production in Holstein cows. J Appl Anim Res. 45:145–151.
- Kim BW, Lee D, Jeon J, Lee J. 2009. Estimation of genetic parameters for milk production traits using a random regression test-day model in Holstein cows in Korea. Asian Australas J Anim Sci. 22:923–930.
- Macciotta NPP, Dimauro C, Rassu SPG, Steri R, Pulina G. 2011. The mathematical description of lactation curves in dairy cattle. Ital J Animal Sci. 10:e51–223.
- Macciotta N.P.P, Vicario D, Cappio-Borlino A. 2005. Detection of different shapes of lactation curve for milk yield in dairy cattle by empirical mathematical models. J. Dairy Sci. 88:1178–1191.
- McManus C, Teixeira RA, Dias LT, Louvandini H, Oliveira E. 2008. Características produtivas e reprodutivas de vacas Holandesas e mestiças Holandês × Gir no Planalto Central. R Bras Zootec. 37:819–823.
- Misztal I, Tsuruta S, Lourenco D, Aguilar I, Legarra A, Viterizica Z. 2014. Manual for BLUPF90 family of programs. http://nce.ads.uga.edu/wiki/lib/exe/fetch.php?media=blupf90_all2.pdf
- Oliveira VC, Fontes CAA, Siqueira JG, Fernandes AM, Sant´Ana AF, Chambela Neto A. 2007. Produção de leite e desempenho dos bezerros de vacas nelores e mestiças. R Bras Zootec. 36:2074–2081.
- Penasa M, De Marchi M, Dal Zotto R, De Jong G, Bittante G, Cassandro M. 2010. Heterosis effects in a black and white dairy cattle population under different production environments. Livest Sci. 131:52–57.
- Santos DJA, Peixoto M, Borquis RRA, Verneque RS, Panetto JCC, Tonhati H. 2013. Genetic parameters for test-day milk yield, 305-day milk yield, and lactation length in Guzerat cows. Livest Sci. 152:114–119.
- Şeahin A, Ulutaş Z, Arda Y, Yüksel A, Serdar G. 2015. Lactation curve and persistency of anatolian buffaloes. Ital J Anim Sci. 14:150–157.
- Silva M, Canazo-Cayo AW, Lopes OS, Cobuci JA, Martins MF, Paiva LC, Cembranelli MAR, Ferreira MBD, Panetto J. 2015. Programa de Melhoramento Genético da Raça Girolando: do teste de progênie às avaliações genômicas. Inf Agropec. 36:35–40.
- Silva M, Martins MF, Cembranelli MAR, Paiva LC, Panetto JCC, Alves BRC, Campos MM, Carvalho BC. 2016. Programa de Melhoramento Genético da Raça Girolando– Sumário de Touros – Resultado do Teste de Progênie – Junnho/2016. Juiz De Fora: Embrapa Gado De Leite, 2016. 50 (Embrapa Gado de Leite, Documentos, 190). https://www.embrapa.br/busca-de-publicacoes//publicacao/1050998/girolandobreed-genetic-improvement-program—sire-summary—progeny-test-results—june-2016
- Singh R, Arora VK, Goel R. 2001. Genetic studies on first lactation traits of Sahiwal Cattle. Indian J Anim Res. 35:147–149.
- Sorensen A, Muir DD, Knight CH. 2008. Extended lactation in dairy cows: effects of milking frequency, calving season and nutrition on lactation persistency and milk quality. J Dairy Res. 75:90–97.
- Thornley JHM, France J. 2007. Mathematical models in agriculture. 2nd ed. Wallingford: CABI Publishing.
- Torshizi EM, Aslamenejad AA, Nassiri MR, Farhangfar H. 2011. Comparison and evaluation of mathematical lactation curve functions of Iranian primiparous Holsteins. S Afr J Anim Sci. 41:104–115.
- Ulmek BR. 1990. Genetic studies of production traits in Gir Cattle [dissertation]. Sardar Krushinagar: Gujarat Agricultural University.
- Wentworth EN. 1927. Practical considerations in crossbreeding. J Anim Sci. 1:42–49.
- Wilmink J.B.M. 1987. Adjustment of test-day milk, fat and protein yields for age, season and stage of lactation. Livest Sci. 16:335–348.
- Wood P. 1967. Algebraic model of the lactation curve in cattle. Nature. 216:164–165.