
Abstract
In this study, the effects of hormones (prolactin, insulin, and growth hormone) on triglyceride (TG) content and the mRNA expression of genes involved in hormone receptor and milk component synthesis were evaluated in bovine mammary epithelial cells that were cultured in two-dimensional (2D) and three-dimensional (3D) systems. TG content was measured with a TG determination kit, and expression of genes were measured with real-time quantitative polymerase chain reactions (RT-qPCR).The expression of these genes and TG content increased significantly in the 3D model compared to those in the 2D model. Moreover, hormone supplementation markedly upregulated the mRNA expression of genes related to hormone receptors and milk component synthesis. A pyramid and interaction effect among hormone supplementation and culture model was obvious. The 3D model is more conducive to study the effect of hormones on genes expression, especially for genes expression relies on response to lactogenic hormones.
The expression of genes and TG content increased in the 3D model compared to those in the 2D model.
Hormone supplementation upregulated the mRNA expression of genes related to hormone receptors and milk component synthesis.
The 3D model is more conducive to study the effect of hormones on gene expression related to hormone receptors and milk component synthesis.
Highlights
Introduction
Mammary gland development during pregnancy and lactation is a sophisticated process requiring the coordinate involvement of many systemic and paracrine lactogenic hormones and growth factors. Lactogenic hormone plays a central role in mammogenesis, lactogenesis, and galactopoiesis. Among these hormones, prolactin is one of the major hormones involved in bovine mammary epithelial cells (BMECs) proliferation and differentiation during pregnancy and is essential for galactopoiesis in most mammalian species (Lacasse et al. Citation2016). In ruminants, the systemic administration of growth hormone markedly increases milk yield, milk fat and lactose synthesis in the mammary gland (Zhou et al. Citation2008). Studies to date have shown that insulin plays an important role in milk protein production at the gene transcriptional and post-transcriptional level (Menzies et al. Citation2010). Choi and Mason (Citation2000) demonstrated that insulin and prolactin act synergistically to enhance the translation of β-casein-encoding mRNA. Moreover, maximal induction of the major milk protein-encoding genes (i.e. α-casein) requires growth hormone (Sakamoto et al. Citation2005). In the last decade, most studies confirming the positive effect of prolactin (Shao et al. Citation2013; Ponchon et al. Citation2017), insulin(Menzies et al. Citation2010; Shao et al. Citation2013), and growth hormone (Sakamoto et al. Citation2005; Zhou et al. Citation2008) on the BMECs, but of note, most of studies have been carried out using one/two of above hormones. However the development of the mammary gland needs a complex of hormones, including oestrogen, progesterone, adrenal corticoids, prolactin and growth hormone to achieve substantial milk production after parturition (Neville et al. Citation2002). Hence considering aforementioned results, we selected the most important hormones, including prolactin, insulin and growth hormone, and investigated the coordinate effect of these hormones on the genes related to hormone receptors and milk component synthesis in BMECs.
Using an appropriate culture system is the first step to improve the development and maintain histological features of the BMECs. Because of the absence of glandular structure, BMECs grown in two-dimensional (2D) culture models can neither fully reflect the physiological features of epithelial cells nor maintain the tissue-specific architecture (forced polarity, flattened cell shape), and mechanical/biochemical signals (Yamada & Cukierman Citation2007). However, most researchers use 2D cultures because of their simplicity and low cost. Intriguingly, three-dimensional (3D) cultured BMECs can undergo spatial cell growth on a porous, extracellular matrix (ECM)-like scaffolding structure, which mimics several important characteristics of in vivo glandular architecture and facilitates the maintenance of appropriate cell physiology (Hsiao et al. Citation2012a, Citation2012b). Most in vitro studies have confirmed the morphology and biological function of BMECs in 3D culture models (Debnath et al. Citation2002; Murtag et al. Citation2004; Xian et al. Citation2005; Shandilya et al. Citation2016; Li et al. Citation2017). Besides, some studies found that 3D culture system can induce expression of casein in BMECs (Shandilya et al. Citation2016; Zhan et al. Citation2017; Li et al. 2018). Of note, until now, most of the studies focussed on the difference between 2D and 3D culture system, but there have been no reports about the difference response of BMECs to hormones between 2D and 3D culture system. Although studies have claimed that 3D culture system can bridge the gap between in vitro and in vivo, it still has the pros and cons. It is sometimes hard to choose the optimum model to do the research, especially when we have no clue about how the gene expression changes are in BMECs growing in 2D and 3D culture system with different treatments. Hence, we investigated the coordinate effect of these hormones on the TG content and the expression of genes related to hormone receptors and milk component synthesis in BMECs, and, secondly, we focussed on comparing difference between 2D and 3D culture system in response of genes expression in BMECs exposed to hormones treatment.
Experimental design and treatments
In this study, a 2 × 2 factorial experimental design was used. Two types of cell culture models (i.e. 2D and 3D) and two hormone treatments (-PIG: 0 ng/mL prolactin + 0 ng/mL insulin + 0 ng/mL growth hormone and + PIG: 100 ng/mL prolactin + 10 ng/mL insulin + 30 ng/mL growth hormone) were applied (Xing Citation2017). BMECs growing in 2D and 3D culture system were incubated with/without hormones at 37 °C and 5% CO2 for 48 h. Triglyceride (TG) content and the expression of genes related to hormone receptors and milk component synthesis in BMECs were measured.
Two-dimensional cell culture model
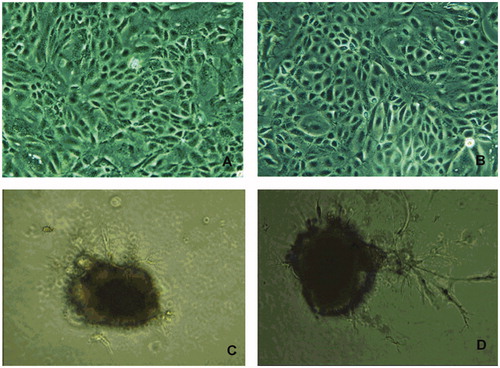
BMECs were isolated from the mammary glands of healthy, multiparous, mid-lactating Holstein cows as described previously (Li et al. Citation2017). Briefly, approximately 1 cm3 mammary gland tissues were digested with 500 U/mL of collagenase II (Sigma-Aldrich, St. Louis, MO, USA, MB2665) for 1 h at 37 °C and 5% CO2 and filtered through an 80-nylon mesh filter to remove any larger tissue fragments. The filtered liquid was centrifuged at 280 ×g for 5 min, and cell pellets (6 × 10⁶ cells/well) were then cultured in proliferation medium containing Dulbecco’s modified Eagle’s medium-F12 (DMEM-F12, HyClone, South Logan, UT, SH30023.01B) supplemented with foetal bovine serum (FBS, 10%, HyClone, SH30084.03), hydrocortisone (1 ng/mL, Sigma-Aldrich, H0888), glutamine (2 mmol/L, Sigma-Aldrich, G3126), epidermal growth factor (10 ng/mL, Gibco, Grand Island, NY, USA, E3477), insulin-transferrin-selenium(5 μg/mL, Sigma-Aldrich, I3146) and penicillin-streptomycin (10,000 U/L, Harbin Pharmaceutical Group, China) at 37 °C with 5% CO2. Approximately 48 h after seeding, the cells formed a confluent monolayer and the medium was changed to lactogenic medium with or without lactogenic hormones, additionally containing DMEM-F12 supplemented with hydrocortisone, glutamine, epidermal growth factor, 1% penicillin–streptomycin for 48 h. Lactogenic hormones (PIG) included 100 ng/mL of prolactin (Sigma-Aldrich, L6520), 10 ng/mL of insulin (I550) and 30 ng/mL of growth hormone (Raybiotech, Atlanta, USA, 228-10528-3). Each treatment was performed with nine replicates for 48 h in lactogenic medium. The photos of BMECs growing in 2D culture system were taken after 48 h using a phase-contrast microscopy (Olympus, Tokyo, Japan) (Figure ). After stimulation with hormones, cells were washed three times with cold PBS and were collected after spun at 280 ×g in a centrifuge for 8 min.
Figure 1. Morphology of 2D and 3D cultured bovine mammary epithelial cells (BMECs). Note: (A, B) Morphology of two-dimensional cultured bovine mammary epithelial cells with/without PIG (100×). (C, D). Morphology of three-dimensional cultured bovine mammary epithelial cells with/without PIG (100×). PIG: prolactin + insulin + growth hormone.
Three-dimensional cell culture model
Epithelial cells were cultured in Matrigel as described previously (Li et al. Citation2017). In brief, 1 mL of Matrigel (Corning, NY, 356234) was added to each well of the culture plates and spread evenly with a pre-cooled pipette using sterile techniques. After incubating the Matrigel for at least 30 min (to allow it to solidify) in a cell culture incubator with 5% CO2 at 37 °C, cells were seeded at a density of 6.0 × 10⁶ cells/well in DMEM-F12 media supplemented with 5% FBS, 2% Matrigel, 1 ng/mL of hydrocortisone, 2 mM of glutamine, 5 μg/mL of insulin-transferrin-selenium, and penicillin-streptomycin. Cells were re-fed with differentiation medium daily for 36 h. Then, the medium was changed to DMEM with or without PIG and cells were maintained for 48 h. Cells growing on top of the Matrigel layer were observed by confocal microscopy (Olympus, Tokyo, Japan) upon the formation of alveoli-like structures or mammospheres (Figure ). After stimulation with hormones,3D-cultured cells growing in Matrigel were depolymerised on ice by using cell recovery solution (Corning, NY, 354253), and then cells were collected after spun at 280 ×g in a centrifuge for 8 min.
Identification of BMECs
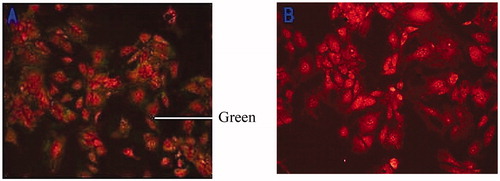
Small sterilised pieces of glass were placed in a 6-cm Petri dish in which the BMECs were inoculated. The glass was removed when the cells grew to be 70–80% and washed 3 times with PBS. The BMECs was fixed for 30 min with 4% polyformaldehyde (Sigma, P6148) at room temperature, treated with 0.5% tritonx-100 (Sigma, T9284) for 10 min, and washed with PBS for 5 min 3 times. The cells were sealing treated with PBS contains 1% gelatine for 30 min and incubated in monoclonal mouse antihuman cytokeratin 18 antibody (1:50 dilution, Sigma, SAB330001) for 1 h at room temperature and washed with PBS. The goat antimouse IgG antibody (1:50, Sigma, M5899) with the fluorescein isothiocyanate (Sigma, F1628) marker was added, and the cells were incubated for 30 min at room temperature and washed. The cells were dyed with PBS with 10 μg/mL of propidium iodide (Sigma, 04511) for about 10 min at room temperature. Developments were observed with an inverted fluorescence microscope, and a negative control was made with a bovine fibroblast (Figure ).
Figure 2. Immunofluorescence of cytokeratin 18 (100×). Note: Bovine mammary epithelial cells (A); Bovine mammary fibroblasts (B).
Extracellular TG assays
After 48 h, 1 mL culture medium was aspirated and spun at 280 × g in a centrifuge for 8 min, and the supernatant was collected to measure extracellular TG content. The concentration of TG in the cell lysate was tested using a triglyceride assay kit (Jiancheng, Nanjing, China, A045-4) on a plate reader (Thermo Fisher Scientific, Waltham, MA) according to the manufacturer’s instructions. The concentrations were calculated according to the equation provided by the manufacturer’s instructions. The quantification of total cellular TG was normalised to cellular protein concentrations, which were determined using a total protein assay kit (Jiancheng, A110-2) according to the manufacturer’s instructions, and the TG level was expressed as mmol/mg of protein. Each experiment was performed with nine replicates.
RNA preparation and quantitative real-time polymerase chain reaction
Total RNA from BMECs was isolated using the TRIsol extraction method according to the manufacturer’s instructions. RNA was quantitatively and qualitatively assessed using an ultraviolet spectrophotometer at 260 and 280 nm. RNA integrity was analysed by horizontal electrophoresis using a 1.5% agarose gel (Prona Agarose, EU). Genomic DNA contamination was removed using DNase. cDNA synthesis was performed using the PrimeScript RT reagent Kit with gDNA Eraser (Takara Bio Inc., Otsu, Japan) according to the manufacturer’s instructions. Quantitative real-time PCR (qPCR), using SYBR Green (SYBR Premix Ex Taq II, Perfect Real Time, Takara Bio Inc.), was performed according to the manufacturer’s instructions on a Illumina real-time PCR machine with two steps as follows: an initial denaturation was performed at 95 °C for 30 s, which was followed by 40 cycles of denaturation at 95 °C for 5 s and annealing at 60 °C for 30 s. A subsequent dissociation stage produced a melting curve to verify the specificity of the amplified products (Supplementary Figures 1–4). Several genes related to milk component synthesis (ACC, FASN, SCD, DGAT2, SREBP1, PPARG, FABP3, CSN1S1, CSN2, CSN3, MTOR, EIF4EBP1, RPS6K1, STAT5 and AKT1) and those encoding hormone receptors (PRLR, INSR, GHR and IGF-IR), housekeeping proteins, ubiquitously expressed transcript (UXT), mitochondrial ribosomal protein L39 (MRPL39), and eukaryotic translation initiation factor 3, subunit K (EIF3K) (Kadegowda et al. Citation2009) were selected; primer sequences and parameters are reported in Table . Quantitative real-time PCR data were calculated using the 2−ΔΔCT method (Livak and Schmittgen, Citation2001). Each experimental group consisted of nine replicates to ensure consistency.
Table 1. Primer sequences and PCR parameters.
Statistical analysis
Data were analysed using the mixed procedure of Statistical analysis system (2002) with a 2 × 2 factorial arrangement. The mixed model included the fixed effects of the culture model, hormones, the interactions between hormone and cell culture type, and the random effects of replicates of each batch. Effects of the fixed factors were declared significant at p < .05.
Results
Morphology and identifications of BMECs
BMECs showed typical cobblestone morphology in the 2D culture model (Figure ). BMECs formed alveoli-like structures or mammospheres after 3days in the 3D model (Figure ).
Fluorescence-activated cell-sorting analysis for cytokeratin expression in the cells showed that results revealed that the cultured cells were the epithelial cells of the cow mammary gland (Figure ), which could be used to perform 3D culture and follow-up test.
Accumulation of TG
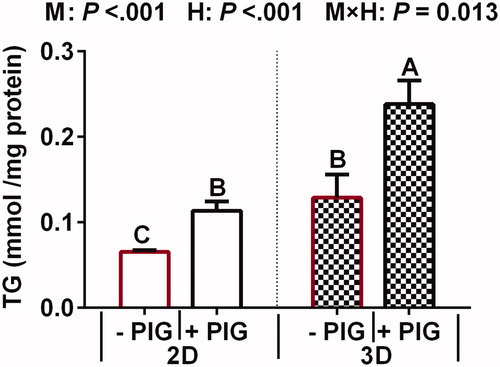
The effects of hormones on TG content in 2D- and 3D-cultured BMECs is presented in Figure . TG content in 3D-cultured BMECs culture medium was significantly higher than that in the 2D culture medium (p < .001). Moreover, the presence of different hormones in the culture medium significantly affected extracellular TG content. Specifically, lipid accumulation in the PIG group was significantly higher than that in the control group (p < .001). A positive interaction effect was also noted between cell culture model and hormones in terms of TG content (p < .001).
Figure 3. Effect of hormones and culture model on triglyceride (TG) content in 2D and 3D cultured bovine mammary epithelial cells (BMECs). Note: Values represent means ± standard error (n = 3 replicates per treatment). a,b,c,dMeans with different superscripts differ significantly from each other (p <.05). p Values for culture model, hormones, and model × hormones are based on ANOVA.M: culture model; H: hormone and PIG: prolactin + insulin + growth hormone.
mRNA expression of genes involved in milk fat synthesis
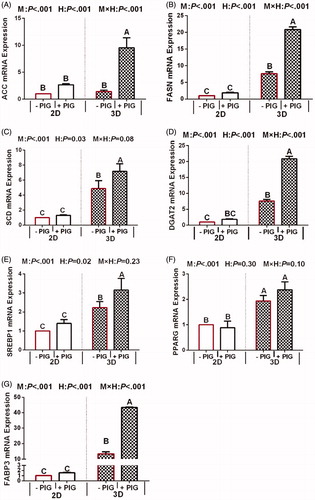
The effects of hormone treatment and culture model on the mRNA expression of genes involved in milk protein synthesis can be seen in Figure . The mRNA expression of ACC, FASN, SCD, DGAT2, SREBP1, PPARG and FABP3 in 3D-cultured BMECs was significantly greater than that in 2D-cultured BMECs (p < .05). Hormone supplementation was found to have a positive effect on the mRNA expression of genes involved in milk fat synthesis (p < .001), whereas no differences were observed regarding the mRNA expression of PPARG (p = .3). Further, the interaction between the model and hormones significantly affected the mRNA expression of genes associated with milk fat synthesis (p < .05) such as ACC, FASN, DGAT2, and FABP3. Interaction effects among the expression of SCD, SREBP1, and PPARG were not noted (p > .05). In the 2D model, the mRNA expression of all the genes were no response to the PIG treatment group, but the mRNA expression of above genes, except for PPARG, significantly increased in 3D model.
Figure 4. Effect of hormones and culture model on the expression of genes involved in milk fat synthesis in 2D- and 3D-cultured bovine mammary epithelial cell (BMECs). Note: Values represent means ± standard error (n = 3 replicates per treatment). a,b,c,dMeans with different superscripts differ significantly (p <.05). P-values for culture model, hormones, and model × hormones are based on ANOVA. M: culture model; H: hormone and PIG: prolactin + insulin + growth hormone; UXT: ACC: acetyl-CoA carboxylase; FASN: fatty acid synthase; SCD: stearoyl-CoA desaturase; DGAT2: diacylglycerol acyltransferase 2; SREBF1: sterol regulatory element-binding transcription factor; PPARG: peroxisome proliferative activated receptor gamma; FABP3: fatty acid-binding protein 3.
mRNA expression of genes involved in milk protein synthesis
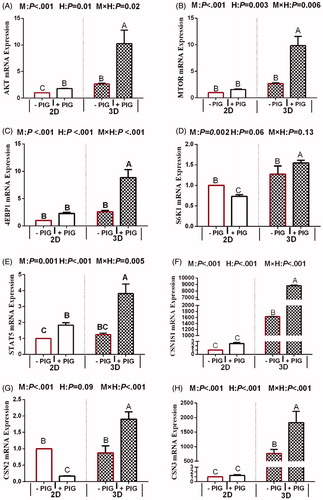
The effects of culture model and hormone supplementation on the mRNA expression of genes involved in milk protein synthesis in BMECs cultured in 2D and 3D systems are summarised in Figure . The mRNA abundance of CSN1S1, CSN2, CSN3, MTOR, EIF4EBP1, RPS6K1, STAT5, and AKT1 in 3D-cultured BMECs was significantly greater than that in 2D-cultured BMECs (p < .05). Among these genes, that encoding casein was the most highly expressed in the 3D model (p < .1). Genes associated with mTOR and JAK/STAT5 signalling pathways, except for S6K1 and CSN2, were expressed at a higher level in response to PIG, as compared to that in the control group (p < .01). Besides S6K1, a pyramid and interaction effect was obvious between hormone supplementation and culture model. Furthermore, in the 3D model, the mRNA expression of S6K1 and CSN2 was significantly increased in the PIG treatment group compared to that in the control group (p < .05). However, the opposite tendency was observed regarding the expression of S6K1 in 2D model (p < .05).
Figure 5. Effect of hormones and culture model on the expression of genes involved in milk protein synthesis in 2D- and 3D cultured bovine mammary epithelial cells (BMECs). Note: Values represent means ± standard error (n = 3 replicates per treatment). a,b,c,dMeans with different superscripts differ significantly (p < .05). P-values for culture model, hormones, and model × hormones are based on ANOVA. M: culture model; H: hormone and PIG: prolactin + insulin + growth hormone; CSN1S1: casein alpha s1; CSN2: Casein beta; CSN3: Casein kappa; MTOR: mechanistic target of rapamycin kinase; EIF4EBP1: eukaryotic translation initiation factor 4E binding protein 1; RPS6K1: ribosomal protein S6 kinase; STAT5: Stat5 signal transducer and activator of transcription 5; AKT1: Serine/threonine kinase 1.
mRNA expression of genes involved in hormone receptor
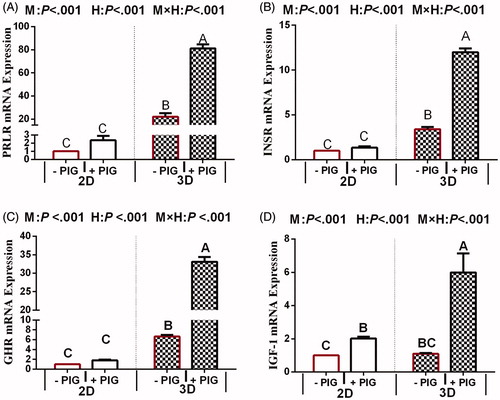
The RNA expression of genes involved in hormone receptor responses to treatments is reported in Figure . PRLR, INSR, GHR, and IGF-IR levels showed similar trends to the expression of milk fat and protein genes based on qRT-PCR data; specifically, the expression of these genes significantly increased when BMECs were cultured in the 3D model (p < .05). PRLR was the most highly expressed gene. Compared to that in the control, the expression of these genes was higher in response to hormones (p < .05). The interaction between hormones and culture model regarding the expression of PRLR, INSR, GHR, and IGF-IR (p < .05) was significant. In the 2D model, the mRNA expression of PRLR, INSR and GHR were no significant changes in the PIG treatment group compared to that in the control group, but the mRNA expression of above gene significantly increased in 3D model.
Figure 6. Effect of hormones and culture model on the expression of genes encoding hormone receptors in 2D- and 3D-cultured bovine mammary epithelial cell (BMECs). Note: Values represent means ± standard error (n = 3 replicates per treatment). a,b,c,dMeans with different superscripts differ significantly (p <.05). p Values for culture model, hormones, and model × hormones are based on ANOVA. M: culture model; H: hormone and PIG: prolactin + insulin + growth hormone; PRLR: Prolactin receptor; INSR: Insulin receptor; GHR: Growth hormone receptor; IGF-IR: Insulin like growth factor 1 receptor.
Discussion
Indeed, lactogenic hormone is known to affect the functional differentiation of mammary epithelial cells and local environmental signals, after which milk components are transferred to the apical domain of mammary epithelial cells and secreted into the lumen (Yonekura et al. Citation2006). Milk fat is composed primarily of TG derived either from plasma lipids or the de novo synthesis from milk fat precursors (Bionaz and Loor Citation2008). Therefore, TG content reflects fat synthesis in BMECs. In the present study, when hormones treatment act as main effect, PIG in the culture system increased TG content, which attribute to the up-regulate effects of the mRNA expression of ACC, FASN, SCD, DGAT2, SREBP1, and FABP3 in BMECs. In this study, we uncover an interesting phenomenon in which the mRNA expression of PPARG in BMECs transcript levels was not affected by the PIG. However, PPARG plays a pivotal role in BMECs as it act as lipid sensors to target genes involved in lipid homeostasis, including SREBF1, FASN, SCD1 and ACC (Kadegowda et al. Citation2009). Our study suggests that the PPARA regulatory pathway is not involved in the promotion action of PIG on TG synthesis. Furthermore, prolactin, insulin, and growth hormone have previously been identified to induce the transcription of milk protein genes (Zhu et al., Citation2001; Litterst et al. Citation2003; Riley et al. Citation2010). Consistently, we show here that PIG up-regulates the expression of CSN1 and CSN3 via the STAT5 and MTOR pathway. Of not, PIG have little effect on the expression of S6K1.
Our results clearly confirmed that in the 2D model, the mRNA expression of all milk fat syntheses genes, some of milk protein syntheses genes (including AKT, MTOR, 4EBP1, CSN1S1 and CSN3), and especially for hormone receptor were no response to the PIG treatment group, but the mRNA expression of above genes significantly increased in 3D model. Additionally, in the 3D model, the mRNA expression of S6K1 and CSN2 were significantly increased, however, the opposite tendency was observed regarding the expression of S6K1 and CSN2 in 2D model. Since prolactin only functions in the presence of appropriate ECM and requires a laminin-rich basement membrane (Katz and Streuli Citation2007), hence we concluded that 3D culture can promote the BMEC response to PIG, thereby, affecting the expression of genes involved. In the 3D model reported here, the formation of acinar-like, tubular structures exposes the active site of cell surface receptors, which could allow them to function more effectively with the PIG. In line with these results, in the present study, 3D culture increased PRLR, INSR, and GHR mRNA abundance in BMECs, which suggested that the hormones receptor on the cell membrane surface is entirely exposed in 3D models. When STAT5A is activated by a hormone bound to its receptor, the activated form is transferred to the nucleus where it binds CSN2 promoter regions (Hadley et al. Citation1985). Hence, entirely exposing of hormones receptor on the cell membrane surface is the key factor for genes whose transcription relies on hormones. Presumably, the 3D model is a more effective model for studying the synthesis of milk composition in BMECs since the expression of corresponding genes relies on positive response to PIG. Of course, gene expression is also influenced by other factors, and whether the culture model is the predominant factor requires further study. In any case, the results of this study show that 3D models can exert its all-out ability to promote the genes’ in BMEC response to PIG, resulting in more reliable trends of gene expression, indicating that the 3D model is more conducive to studying the modulation of gene expression. In addition, since the level of gene transcription and translation was below the test line in the 2D model, 3D models are suggested to be superior for these types of studies (Zhan et al. Citation2017).
This is especially true that some genes’ response to the PIG in BMECs (AKT, STAT5A and IGF-1R) were relatively consistent in 2D and 3D models. Accordingly, either 2D or 3D can be used to investigate the transcription levels of genes do not depend on the transcription of hormone-encoding genes. 2D model is simplicity and low cost. In addition, its technology applications proved to be more mature. But due to the interaction between the genes, we still deduced that 3D is more suitable. However, whereas 3D is thought to bridge the gap between in vitro and in vivo systems, it is sometimes difficult to decipher their advantages or limitations as its broad number of techniques used (Hoarau-Véchot et al. Citation2018). Hence, the application of 3D culture system to investigate the effect of different nutrients and hormones on MEC remains to be studied.
Conclusions
Together, hormones clearly stimulate TG synthesis through regulating expression of milk protein and lipogenic genes, but they do not appear to mediate the PPARG and S6K1 expression. The 3D model is a more effective model for studying the expression of corresponding genes whose expression relies on response to Lactogenic hormones, including ACC, FASN, SCD, DGAT2, SREBP1, FABP3, CSN1S1, CSN3, MTOR, EIF4EBP1 and STAT5, PRLR, INSR, and GHR. 3D model is alternative model to 2D model for studying the expression of AKT, STAT5 and IGF-1R.
Ethical approval
The care and use of laboratory animals reported in this study were approved by the Inner Mongolia Agricultural University's Animal Care and Use Committee and the Ministry of Agriculture of China.
Supplemental Material
Download MS Word (1.2 MB)Disclosure statement
No potential conflict of interest was reported by the authors.
Additional information
Funding
Related Research Data
References
- Bionaz M, Loor JJ. 2008. Gene networks driving bovine milk fat synthesis during the lactation cycle. BMC Genomics. 9(1):366–387.
- Choi SW, Mason JB. 2000. Folate and carcinogenesis: an integrated scheme. J Nutr. 130(2):129–132.
- Debnath J, Mills KR, Collins NL, Reginato MJ, Muthuswamy SK, Brugge JS. 2002. The role of apoptosis in creating and maintaining luminal space within normal and oncogene-expressing mammary acini. Cell. 111(1):29–40.
- Hadley MA, Byers SW, Suárez-Quian CA, Kleinman HK, Dym M. 1985. Extracellular matrix regulates sertoli cell differentiation, testicular cord formation, and germ cell development in vitro. J Cell Biol. 101(4):1511–1522.
- Hoarau-Véchot J, Arash R, Cyril T, Jennifer P. 2018. Halfway between 2d and animal models: are 3d cultures the ideal tool to study cancer-microenvironment interactions? Int J Mol Sci. 19(1):181–205.
- Hsiao AY, Tung YC, Kuo CH, Mosadegh B, Bedenis R, Pienta KJ, Takayama S. 2012a. Micro-ring structures stabilize microdroplets to enable long term spheroid culture in 384 hanging drop array plates. Biomed Microdevices. 14(2):313–323.
- Hsiao AY, Tung YC, Qu X, Patel LR, Pienta KJ, Takayama S. 2012b. 384 hanging drop arrays give excellent. Biotechnol Bioeng. 109(5):1293–1304.
- Kadegowda AKG, Bionaz M, Piperova LS, Erdman RA, Loor JJ. 2009. Peroxisome proliferator-activated receprot-γ activation and long-chain fatty acid alter lipogenic gene networks in bovine mammary epithelial cells to various extents. J Dairy Sci. 92(9):4276–4298.
- Kadegowda AKG, Bionaz M, Thering B, Piperova LS, Erdman RA, Loor JJ. 2009. Identification of internal control genes for quantitative polymerase chain reaction in mammary tissue of lactating cows receiving lipid supplements. J Dairy Sci. 92(5):2007–2019.
- Katz E, Streuli CH. 2007. The extracellular matrix as an adhesion checkpoint for mammary epithelial function. Int J Biochem Cell Biol. 39(4):715–726.
- Lacasse P, Ollier S, Lollivier V, Boutinaud M. 2016. New insights into the importance of prolactin in dairy ruminants 1. J Dairy Sci. 99(1):864–874.
- Li D, Xing Y, Li H, Wang W, Hou X, Gao M. 2017. Effect of linoleic acid supplementation on triglyceride content and gene expression in milk fat synthesis in two- and three-dimensional cultured bovine mammary epithelial cells. Ital J Anim Sci. 17(3):1–9.
- Litterst CM, Kliem S, Marilley D, Pfitzner E. 2003. Ncoa-1/src-1 is an essential coactivator of STAT5 that binds to the fdl motif in the α-helical region of the stat5 transactivation domain. J Biol Chem. 278(46):45340–45351.
- Livak KJ, Schmittgen TD. 2001. Analysis of relative gene expression data using real-time quantitative pcr and the 2(-delta delta c (t)) method. Methods. 25(4):402–408.
- Menzies KK, Lee HJ, Lefèvre C, Ormandy CJ, Macmillan KL, Nicholas KR. 2010. Insulin, a key regulator of hormone responsive milk protein synthesis during lactogenesis in murine mammary explants. Funct Integr Genomics. 10(1):87–95.
- Murtag J, Mcardle E, Gilligan E, Thornton L, Furlong F, Martin F. 2004. Organization of mammary epithelial cells into 3D acinar structures requires glucocorticoid and jnk signaling. J Cell Biol. 166(1):133–143.
- Neville MC, Mcfadden TB, Forsyth I. 2002. Hormonal regulation of mammary differentiation and milk secretion. J Mammary Gland Biol Neoplasia. 7(1):49–66.
- Ponchon B, Zhao X, Ollier S, Lacasse P. 2017. Relationship between glucocorticoids and prolactin during mammary gland stimulation in dairy cows. J Dairy Sci. 100(2):1521–1534.
- Riley LG, Gardiner-Garden M, Thomson PC, Wynn PC, Williamson P, Raadsma H W, Sheehy PA. 2010. The influence of extracellular matrix and prolactin on global gene expression profiles of primary bovine mammary epithelial cells in vitro. Anim Genet. 41(1):55–63.
- Sakamoto K, Komatsu T, Kobayashi T, Rose MT, Aso H, Hagino A, Obara Y. 2005. Growth hormone acts on the synthesis and secretion of alpha-casein in bovine mammary epithelial cells. J Dairy Rese. 72 (3):264–270.
- Shandilya UK, Sharma A, Sodhi M, Kapila N, Kishore A, Mohanty A, Kataria R, Malakar D, Mukesh M. 2016. Matrix-based three-dimensional culture of buffalo mammary epithelial cells showed higher induction of genes related to milk protein and fatty acid metabolism. Cell Biol Int. 40(2):232–238.
- Shao Y, Wall EH, Mcfadden TB, Misra Y, Qian X, Blauwiekel R, Kerr D, Zhao FQ. 2013. Lactogenic hormones stimulate expression of lipogenic genes but not glucose transporters in bovine mammary gland. Domest Anim Endocrinol. 44(2):57–69.
- Xian W, Schwertfeger KL, Vargo-Gogola T, Rosen JM. 2005. Effects of fgfr1 on cell proliferation, survival, and migration in a 3D mammary epithelial cell model. J Cell Biol. 171(4):663–673.
- Xing YY. 2017. Effect of hormone supplementationon milk fat and milk protein synthesis in two and three-dimensional cultured bovine mnmmary epithelial cells [dissertation]. Hohhot, China: Inner Mongolia agricultural university (In Chinese).
- Yamada KM, Cukierman E. 2007. Modeling tissue morphogenesis and cancer in 3d. Cell. 130(4):601–610.
- Yonekura S, Sakamoto K, Komatsu T, Hagino A, Katoh K, Obara Y. 2006. Growth hormone and lactogenic hormones can reduce the leptin mrna expression in bovine mammary epithelial cells. Domest Anim Endocrinol. 31(1):88–96.
- Zhan K, Lin M, Liu MM, Sui YN, Babekir HM, Zhao GQ. 2017. Three-dimensional culture system can induce expression of casein in immortalized bovine mammary epithelial cells. Anim Sci J. 88(5):817–825.
- Zhou Y, Akers RM, Jiang H. 2008. Growth hormone can induce expression of four major milk protein genes in transfected MAC-T cells. J Dairy Sci. 91(1):100–108.
- Zhu T, Goh ELK, Graichen R, Ling L, Lobie PE. 2001. Signal transduction via the growth hormone receptor. Cell Signal. 13(9):599–616.