
 ?Mathematical formulae have been encoded as MathML and are displayed in this HTML version using MathJax in order to improve their display. Uncheck the box to turn MathJax off. This feature requires Javascript. Click on a formula to zoom.
Abstract
The study aims to simulate the alternative methods of simplifying weight recording of Tunisian local kids and assesses the impact of their use from a genetic point of view to set up the basis for the future improvement of this important component of efficient production. A total of 13,095 weight records of 945 kids, progeny of 285 females and 19 males were collected over a period of 16 years in the caprine herd of the Arid Areas Institute of Médenine (South East of Tunisia).Weights were taken at six standard ages (10, 30, 60, 90,120 and 150 days) at a weekly pace. Alternative simplified schemes were simulated by skipping from 1–7 weeks of recording and performance in terms of predicting weights at the standard ages was evaluated. In addition, random regression model (RRM) including age of females, interaction sex × type of birth, interaction year × month of birth was used as fixed effects. Also, animal- and maternal permanent environmental as random effects, were fitted to the data set. Alternative simplified recording systems were then evaluated in terms of modifications in estimated genetic parameters and correlations among estimated breeding values. Results showed that 1–3 weeks of time between recordings yielded accurate estimates of weights at the standard ages. The effect of the simplified weight recording was especially relevant at the extreme weights, at 10 and at 150 days of age, that the spacing of successive controls affects the accuracy of the estimate. The lack of registration of birth weight showed a significant deterioration in the estimate of weight at 10 days. Only the simplification of the weights recording to one and two-week resulted in direct and maternal heritability’s for the different growth traits of local kids, similar to those obtained by the standard age growth recording. Selecting the critical ages that define changes in growth components seems to be more critical than using more frequent weighing in terms of estimation of the genetic components of weight of kids in this population.
This type of local kids measurement simplification can be seen as an alternative: ^ To enhance the economical aspect of the sheep recording scheme. ^ Reduce animal disturbance.
According to the results of this study, the adoption of a common growth control system seems difficult since the breeding objectives and for farming systems are not the same.
Highlights
Introduction
The majority of livestock is raised generally under medium to low input production environments (Gallal et al. Citation2000). Introducing and maintaining effective breeding strategies in these less economically developed countries similar to those implemented in developed countries, has met many difficulties and has been severely limited due to a lack of capacity and financial resources (Najari Citation2005). Under these circumstances, breeding alternatives based on simplified procedures should be sought and applied in order to sustain management and improvement of the existing rich animal genetic reservoir (Bethiaf et al. Citation2000).
Goat meat production is a significant source of income of farmers in the Southern regions of Tunisia. Local breeds are often used because of their adaptation to the harsh conditions, but they are characterised by a small body weight and slow growth, which impairs economic profit. Genetic improvement of growth ability of local breeds would enhance the economic benefit of goat farming in this area but recording of appropriate phenotypes (weights at certain ages) and pedigrees are needed to achieve this goal. The classic meat goat recording system at standard ages is a major cost operation since six successive live weights are required to be measured on a given kid in order to accurately determine its growth curve (Ouni et al. Citation2007). However, weight recording is a costly operation which disturbs animals and livestock owners (Trivedi Citation1998). If a way of simplifying recording can be found in a way that sufficient information is gathered to produce accurate genetic values, goat breeding strategies can be more economical and animal disturbance and labour needs will be minimised (Ben Gara et al. Citation1997).
Our hypothesis is that a reduced recording pace can be found in order to put in practice accurate genetic evaluations. This study evaluates alternative methods of simplifying weight recording by comparing estimates from simplified and standard recording plan and assessing the impact of their use from a genetic point of view (genetic parameters of growth traits and genetic correlations).
Material and methods
Location
All studied animals belong to the goat experimental herd of the Arid Areas Institute of Médenine Tunisia (33°30’ N and 10°40’ E), which is in southeastern Tunisia, between the mountains of Matmata and the Mediterranean Sea. This region is characterised by an arid continental Mediterranean climate; with irregular precipitations with an average annual rainfall of about 200 mm. The summer is normally the hottest and driest season with a maximum temperature of 47 °C (Ouni et al. Citation2007).
Animals and management
The Tunisian local goat population is very polymorphic (Najari Citation2005), but it is generally characterised by its small body size with average height of 76 cm for the male and 60 cm for the female (Ouni et al. Citation2007). The goats participating in this study were raised in the Arid Areas Institute of Médenine (IRA), in the South-East of Tunisia with an arid continental Mediterranean climate, with irregular and sporadic rains. Animals were mated following a breeding system of one kidding per year. The main mating period was from June to August, which corresponded to births in autumn. If a female goat was not pregnant during the first mating period, it was transferred to the group that was mated at the next mating period (October–November, which corresponds to births in spring). The female kids were mated for the first time between 12 and 18 months of age, depending on their birth season (Najari et al. Citation2007).
The number of goats mated per male varied from 5–17. The season of kidding began in October and continued until February, with a concentration during November and December. Throughout the study, replacement animals were selected based on weaning weight and physical conformation. Generally, animals are managed following extensive systems of production. Natural pasture is the main source of feed. The quantity and quality of the pasture vary considerably during the year. With the dry season, the quantity and quality of the pasture decrease and supplemental feeding had to be provided. Animals grazed in natural pastures during the day. In general, grazing pasture grasses covered about 70% of breeding animals feed requirements. The remaining 30% was covered by a supplementation provided during the mating (600 g/day), the last month of pregnancy and the beginning of lactation (750 g/day). All animals were provided with water allowed twice a day; before and after grazing. Post childbirth, kids were weighed once every two or three weeks, ear-tagged and their parents were recorded. In addition, childbirth date, sex of kid and litter size were also recorded. The suckling stage lasts for 120 days on average.
Data recording and statistical analyses
During the period 1998–2014, kids were weighed at the exact ages of 10 (W10), 30 (W30), 60 (W60), 90 (W90), 120 (W120) and 150 (W150) days. In addition, weekly weights were also recorded to compare alternative simplified recordings (every 2, 3, 4, 5 or 6 weeks instead of weekly) by comparing the true weights at the standard ages with predictions from the alternative simplified recordings. From the weekly recording information, we organized seven databases to estimate the performances at the typical ages,. These databases contained alternative all weekly records, every two weeks records, by skipping one control, every 3–7 weeks and by retaining one column out of 3–7 weeks starting from the first weight. For each kid, weights at the standard ages were estimated for each alternative method of weight recording.
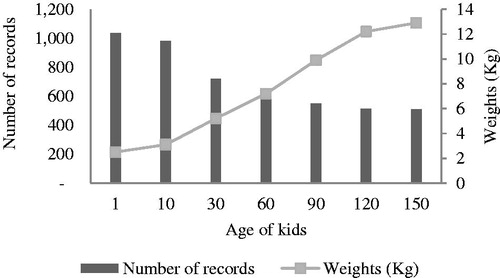
The final data was composed of 945 kids, the progeny of 19 males and 285 females. Overall, 13,095 weight records taken at successive ages were available for the study. The number of records in each standard age and the corresponding mean weight are given in Figure .
Figure 1. Number of records and mean weights of local kids at given period.
The estimation of weights at a standard age from the alternative recording schemes was done assuming a linear growth between consecutive weights using the Equation (1):
(1)
(1)
where
is the age of kid at 10, 30, 60, 90, 120 and 150 days;
Pn+1, Dn and Dn+1 represent the weight and the date of recording n and n + 1, respectively; An is the age at weighing n (An < i < An+1). For W10, Pn was birth weight, which was not always available.
In addition of the ability of the alternative recording schemes to predict the weights taken at standard ages, the impact of simplified recording on modelling and results of genetic evaluations was also investigated.
Firstly, an analysis of variance (ANOVA) analyses was carried out for determining the environmental effects and twoway interactions that had a significant influence on growth traits using the standard age weights. The analysis of variance showed that females age and weight at childbirth, the interaction between sex and litter size and between year and month of childbirth were significant. Consequently, those effects were included in the model for those traits.
Genetic parameters were obtained using a random regression model with direct and maternal genetic, direct and maternal permanent effect with the following model as depicted in EquationEquation (2)(2)
(2) :
(2)
(2)
where yij is the jth record from the ith kid; aij is the standardised age at recording in the [−1,1] interval;
is the mth Legendre polynomial covariate for age at weighing; Fij is the set of fixed effects found significant in the previous ANOVA, βm are the fixed regression coefficient to model the mean growth curve; αim, γim, δim and ρim are the random regression coefficients for direct and maternal additive genetic effects, animal and maternal permanent environmental effects, respectively and εij is the residual effect measured independently distributed, with homogeneous measurement error variances.
The above statistical model matrix form was as follows:
where y: observation vector; b: vector of fixed effects; ad: vector of additive genetic direct random coefficients for all animals in the pedigree; am: vector of maternal additive genetic random coefficients for all animals in the pedigree; pd: vector of animal permanent environmental coefficients for animals with records; pm: vector of maternal permanent environmental coefficients for all dams with records; X, Z1, Z2, W1 and W2 are incidence matrices including Legendre polynomial co-variables and
vector of residuals; Kad, Kam, Kpd, Kpm are the (co)variance matrices associated to additive direct and maternal effects and animal and permanent environmental regression coefficients, respectively, and
is the matrix of covariance between additive genetic direct and maternal regression coefficients;
is the residual variance; a is the additive numerator relationship matrix and I is the identity matrix of differing order depending on the effect associated with itand N is the total number of records.
Co-variances between residual and other random effects were assumed to be null. The software Blupf 90 by Misztal et al. (Citation2002) was used to solve the RRM with the airemlf 90 module. The model applies restricted maximum likelihood to estimate variance components.
Results and discussion
Change in weights recording date from the exact age
Because of holidays and other unexpected events, some weekly records were taken at the exact standard ages. The percentage of weekly weight records taken at an exact standard age is shown in Table . Accuracy of prediction of weights at a given standard age will be larger when information of weights on that exact age is present. As it can be seen, when the date between weight recordings was larger, the number of weights recording corresponding to the exact ages are important.
Table 1. Percentage of growth records from weekly recording which coincide with an exact standard age.
When the weight recording method is carried out every week, 15% of the weighing will be used directly as standard weights. This rate decreases to 1% when the recording is performed every seven weeks. Similarly, the lowest rates correspond to the ‘extreme’ standard ages, like the weight at 10 and 150 days, which is normal since kids have less chance of having more recording compared to the ages 30, 60, 90 and 120 days.
Estimation of growth traits from the simplified recording methods
Mean, standard deviation, minimum and maximum weights at successive standard ages are shown in Table . A typical local kid weighs 3.39; 4.93; 7.87; 9.44; 11.67 and 13.22 kg at birth, 30, 60, 90,120 and 150 days, respectively. Such reduced weight at different age reflects the ability of this population to survive with limited meat performance of the local population, as for all caprine breeds of the desert and arid areas. Such limited performance allows reducing animal needs. Thus, it is considered as an adaptive character to hard environmental conditions in arid regions.
Table 2. Descriptive statistics for traits studied at standard ages and for estimates from simplified recording schemes.
Mean, maximum, minimum and standard deviation obtained from all growth recording method are given in Table . Predicted weight at standard ages was underestimated when the reduced performance recording was considered in comparison with observed weights at the standard ages, although underestimation was small. The largest underestimation, around 10% of the observed values, was observed for the seven weeks interval of recording for weights at 30 and 60 days of age.
Effect of birth weights elimination on growth trait
Generally, the operation of weights recording method, especially among the breeders, does not allow the registration of the birth weights. This weight represents a source of information that may be particularly important for the estimation of weight at 10 days of age and even at 30 days when the recording is separated by three weeks or more. Table summarises the result of growth trait that may be affected by a lack of birth weight. In terms of averages, the deviation from the weight trait calculated at the correct age is seen to be greater than that observed when birth weight is recorded. This is especially true for the recording method of six and seven weeks. Similar results were obtained by Ben Gara et al. (Citation1997). For the range of predicted weights, the elimination of birth weight led to estimates of minimum and maximum values which were far from weight at the exact age. For example, for weight at 10 days, minimum/maximum values of 1.8/6.2 kg were predicted in every seven weeks recording compared with 1.26/4.16 kg taken at exact 10 days of age.
Table 3. Descriptive statistics for traits studied at standard ages and for estimates from simplified recording schemes when birth weight is missing.
Effect of simplified weights recording method on the genetic evaluation
Significance of environmental effects
Tables and summarise the results of the analysis of variance for weights obtained with alternative recording schemes when analysing W10 or W60, respectively. We note that significance of environmental effects on weight varies according to the type of weight recording scheme, compared with the model established from the analysis of weights taken at the exact standard ages. Both the total number of significant levels and the degree of significance change with the type of weight recording adopted. Differences in distribution and amount of information across levels of effects, changes for the different recording schemes and this seem to affect the significance of effects. Indeed, only weekly or biweekly schemes yielded the same significance as weights measured in the exact standard ages for both W10 and W60. More widely spaced schemes reduced R2 substantially from values close to 0.80 for the exact age, one and two weekly recording to 0.55 for the every seven weeks recording. Factors more affected were year and month of birth and their interactions. Sex of the kid and the interaction sex × year were the only effects showing high significance (p < .01) for all schemes, probably due to the large effect of sex of the kid on its weight. Significance tended to be lower for W60 when compared to W10, likely because of the smaller amount of data available at later stages. These results show that the most accurate application of selection methodologies requires good precision in the estimation of phenotypes, especially for early growth. However, control rhythms of very short duration can only be recommended for small flocks.
Table 4. Test of significance of environmental factors and interactions on W10 with the presence of birth weight.
Table 5. Test of significance of environmental factors and interactions on W60 with the presence of birth weight.
The lack of birth weight in the estimation of W10, led to the reduction in the coefficient of determination (Table ), except for the seven weeks rhythm, for which similar coefficients of determination were obtained when birth weights were included or excluded from the analysis. The identified factors with significant effect was seriously modified in comparison with the exact age, especially when the weight recording is separated by two weeks or more.
Table 6. Test of significance of environmental factors and interactions on W10 with the lack of birth weight.
Effect of simplified weights recording method on the estimation of genetic parameters
Direct and maternal heritability estimates using weights at standard ages and alternative weekly recording schemes can be seen in Figures and , respectively. The direct heritability estimate obtained with the exact age recording was larger for later ages than early ages (Figure ). These findings are in accordance with other studies (Safari et al. Citation2005; Mugambi et al. Citation2007; Zhang et al. Citation2009). As the age of the kid increases, the maternal influence decreases and this source of variation tends to vanish and higher heritability estimates for body weight at older ages might be expected (Ghavi Hossein-Zadeh and Ardalan Citation2010).
Figure 2. Direct heritability estimates using weights at standard ages and alternative weekly recording schemes.
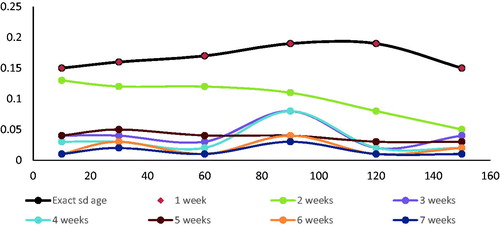
Figure 3. Maternal heritability estimates using weights at standard ages and alternative weekly recording schemes.
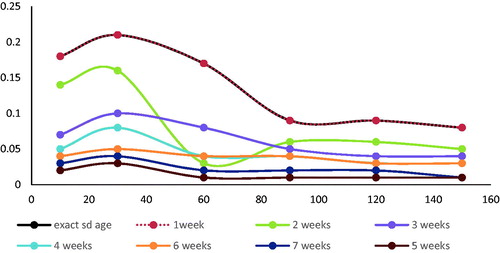
For the exact ages, maternal heritability (h2m) was largest during the first month of life (up to 0.21), then decreased up to 90 days to remain stable afterwards at values around 0.09 (Figure ). This pattern was also expected due to the abovementioned maternal effect being more important at early ages. In fact, the results obtained show that the action of maternal effects on the growth of kids during the period (10–60 days) is more important than the action of direct effects (h2d) which explains that in this period, suckling kids are still dependent on mothers, so the influence of maternal factors remains important until 60 days.
The simplification of the weights recording to one and two-week resulted in direct and maternal heritability’s for the different growth traits of local kids, similar to those obtained by the standard ages weight recording. For weights recording performed at 3, 4, 5 And 7 weeks, there is a decrease in direct and maternal heritability’s for all studied traits.
Weights recording system which ignored the birth weight affected the heritability estimated at 10 days. Heritability estimates were 0.15 and 0.17, respectively for weights recording considering the birth weight and weights recording ignored the birth weight. Similar results were obtained by Ben Gara et al. (Citation1997) for Barbarine breed.
Genetic correlation estimates between weights at different ages obtained with the weights at standard ages are shown in Table . Estimated correlations between early (day 30) and late (day 150) weights was moderate (0.48), suggesting that early weights were not under exactly the same genetic control as weights taken at an older age. In addition, the genetic correlation between weights at younger ages (30 vs. 60 days) were lower than correlation between weights taken at older ages (90 vs. 150 days) with the same time lag. This is attributable to the influence of the part-whole relationship between weights, whereby weights at later ages depend on earlier weights, thus as time progresses the correlations between later weights increases (Figure ).
Figure 4. Genetic correlations between weights obtained with records taken at exact standard ages.
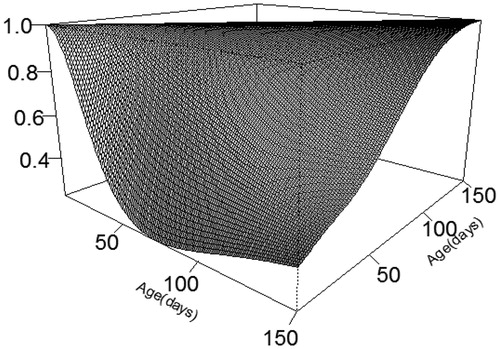
Table 7. Genetic correlations of weight traits estimated with the simplified weights recording method.
Conclusions
Results from this study showed that simplification of the actual weights recording programme which is based on six subsequent weight measurements led to the conclusion that the same accuracy as the one obtained with weights at the standard ages could only be obtained by weekly paces (more easily implemented from a management point of view) of one and two weeks, which involve a larger number of weighing. The three weeks interval, equivalent in amount of weighing to the standard ages scheme, yielded relatively small loss in accuracy of prediction but a substantial underestimation of genetic parameters. If maternal abilities are to be considered, weighing in the first month of life of the kid will be needed to obtain accurate estimates of this component. Selecting the critical ages that define changes in growth components seems to be more critical than using more frequent weighing in terms of estimation of the genetic components of weight of kids in this population.
Ethical approval statement
The animals protocols were approved by the animal research panel of the committee on research practice of the Institute of Arid Regions in Tunisia.
Disclosure statement
No potential conflict of interest was reported by the authors.
References
- Bethiaf S, Bouix J, Clement V, Bibé B, François D. 2000. 7ème rencontres recherches ruminants (3R)[ 7th Ruminant Research Meetings (3R)]. Paris (France). French.
- Ben Gara A, Rouissi H, Jurado JJ, Bodin L, Gabiña D, Boujenane I, Mavrogenis AP, Djemali M, Serradilla JM. 1997. Étude de la simplification du protocole de pesées chez les ovins à viande [Study of the simplification of the weighing protocol for meat sheep]. Cah Options Méditerr Sér A. 33:11–34.
- Fischer TM, Van der Werf JHJ, Banks RG, Ball AJ. 2004. Description of lamb growth using random regression on field data. Livest Prod Sci. 89:175–185.
- Gallal S, Boyazoglu J, Hammod K, editors. 2000. Workshop on developing breeding strategies for lower input animal production environments; Sep 22–25; Bella, Italy. ICAR Technical Series No. 3. Rome (Italy): International Committee for Animal Recording.
- Ghavi Hossein-Zadeh N, Ardalan M. 2010. Estimation of genetic parameters forbody weight traits and litter size of Moghani sheep, using a Bayesian approachvia Gibbs sampling. J Agric Sci. 148: 363–370.
- Misztal I, Tsuruta S, Strabel T, Auvray B, Druet T, Lee DH. 2002. BLUPF90 and related programs (BGF90). In: 7th WCGALP, August 19–23, Montpellier, France: 28–07.
- Mugambi JN, Wakhungu JW, Inyangala BO, Muhuyi WB, Muasya T. 2007. Evaluation of the performance of the Kenya dual purpose goat composites: additive and non-additive genetic parameters. Small Rumin Res. 72:149–156.
- Najari S. 2005. Caractérisation zootechnique et génétique d’une population caprine. Cas dela population caprine locale des régions arides tunisiennes [Thèse de doctorat d’Etat] (Zootechnical and genetic characterization of a goat population. Case of the local goat population of arid Tunisian regions [State doctorate thesis]). Tunisie: Institut National Agronomique. French.
- Najari S, Gaddour A, Ouni M. 2007. Indigenous kids weight variation with respect to non genetic factors under pastoral mode in Tunisian arid region. J Anim Vet Adv. 6:441–450.
- Ouni M, Najari S, Gaddour A, Andrea C, Ishwar AK, Singh SK. 2007. Early growth of morphometric traits of local goat population in Tunisian arid zone. J Bio Sci. 7:1194–1200.
- Safari E, Fogarty NM, Gilmour AR. 2005. A review of genetic parameterestimates for wool, growth, meat and reproduction traits in sheep. Livest Prod Sci. 92:271–289.
- Trivedi KR 1998. International won animal recording for smallholders in developing countries recommendations and summaries; Oct 20–23; Anand, India. ICAR Technical Series 1998 No. 1.
- Zhang CY, Zhang Y, Xu DQ, Li X, Su J, Yang LG. 2009. Genetic and phenotypic parameters estimates for growth traits in Boer goat. Livest Sci. 124:66–71.