
Abstract
MicroRNAs (miRNAs) are short noncoding RNAs that can regulate target gene expression at the posttranscriptional level. It has been reported that bta-miR-145 shows differential expression between the different lactation stages of bovine mammary glands, but the function of bta-miR-145 in normal mammary glands remains unknown. The overexpression of bta-miR-145 significantly decreased the proliferation of mammary epithelial cells (p < .05), and this effect was reversed upon bta-miR-145 inhibition. Using several miRNA prediction programmes, insulin receptor substrate 1 (IRS1) was predicted to be a potential target of miR-145. Using the DAVID database, many predicted targets of bta-miR-145 were found to be involved in the MAPK signalling pathway associated with cell proliferation, including IRS1. Bovine IRS1 3’RACE sequencing and reference comparison revealed that possible binding sites for bta-miR-145 still exist in IRS1. The IRS1 mRNA level was not affected by the transfection of primary bovine mammary epithelial cells with 150 pmol of a bta-miR-145 mimic or 300 pmol of a bta-miR-145 inhibitor for 24 h (pBMEC, p > .05), whereas the IRS1 protein level was changed significantly after bta-miR-145 mimic or inhibitor transfection for 72 h (p < .05). Taken together, these results suggest that bta-miR-145 is involved in the proliferation of bovine mammary epithelial cells by targeting IRS1, which is related to the MAPK signalling pathway.
Bta-miR-145 affects bovine mammary epithelial cell vitality in primary bovine mammary epithelial cells.
IRS1 was verified as target gene of bta-miR-145.
IRS1 belongs to MAPK signaling pathway, which regulate cell proliferation.
Highlights
Introduction
MicroRNAs (miRNAs) are a class of small, noncoding RNAs that posttranscriptionally regulate gene expression and influence a variety of biological processes (Ambros et al. Citation2003). Gu et al. (Citation2007) first identified the existence of miR-145 in bovine mammary gland tissues but not in nonpregnant, nonlactating Holstein cows. The most recent report on this topic showed that bta-miR-145 in mammary tissues was involved in the regulation of heat stress (Li Q, et al. Citation2018) and immune cytokines (Chen et al. Citation2019). Wang et al. (Citation2012) found that the expression abundance of bta-miR-145 is very high in mammary tissues and that miR-145 might be involved in the regulation of mammary cell proliferation. In view of the high expression of bta-miR-145 in mammary tissues (Wang et al. Citation2012) and the close relationship between mammary cell proliferation and milk production (Santos et al. Citation2009), it is necessary to validate the regulatory role of bta-miR-145 in bovine mammary epithelial cells, especially its role in proliferation.
We hypothesised that bta-miR-145 could regulate the proliferation of bovine mammary epithelial cells. Using cell proliferation assays, bioinformatics analysis, 3’RACE sequencing, quantitative real-time PCR, and Western blotting, the function of bta-miR-145 related to cell proliferation was addressed and elucidated.
Materials and methods
Ethics statement
All experimental procedures were approved and conducted under the established standards of the Life Science College, Henan Agricultural University, Zhengzhou, China.
Cell culture
Primary bovine mammary epithelial cells (pBMECs) were provided by the State Key Laboratory of Animal Nutrition (Chinese Academy of Agricultural Science, Beijing, China). Dulbecco’s modified Eagle’s medium-F12 (DMEM/F12) (Gibco, Carlsbad, CA, code: 11330-032) containing 10% foetal bovine serum (FBS) (Invitrogen, Beijing Maojian United Stars Technology Co., Ltd., Beijing, China), 1 μg/mL hexadecadrol, 5 μg/mL prolactin, 5 μg/mL insulin and 100 ng/mL IGF-1 (Sigma-Aldrich, St. Louis, MO, code: D4902, L6520, I5500, I3769, respectively) was used to induce a secretory cell type in pBMECs. pBMECs were cultured at 37 °C in a culture plate under a 5% CO2 atmosphere.
Transient transfection
pBMECs were seeded in 6-well plates at 1 × 10⁵ for 24 h. Then, the cells were incubated for 24 h (n = 3 replicates/treatment) with a bta-miR-145 mimic (150 pmol, GenePharma, Shanghai, China, Cat. B02001), bta-miR-145 mimic negative control (NC, 150 pmol, GenePharma, Shanghai, China, Cat. B04005), bta-miR-145 inhibitor (300 pmol, GenePharma, Shanghai, China, Cat. M-02), or bta-miR-145 inhibitor negative control (NC, 300 pmol, GenePharma, Shanghai, China, Cat. B04006). The sequences of the various bta-miR-145 mimics used are reported in Table . The Transfection efficiency (number of cells with fluorescence/total cells) was manually determined by fluorescence microscopy at 24 h after treatment. All transfections were performed with LipofectamineTM 2000 according to the manufacturer’s recommendations (Invitrogen, Carlsbad, CA, Cat. no. 11668-019). The same transfection operation was conducted for 72 h for immunoblotting analysis.
Table 1. Sequences of bta-miR-145 mimic, mimic NC, inhibitor and inhibitor NC.
Cell proliferation assays after transfection
Primary bovine mammary epithelial cells were incubated in 96-well plates at 1 × 10⁵ cells/mL for 24 h. The cells were transfected with the mimic (150 pmol), mimic-NC (150 pmol), inhibitor (300 pmol), or inhibitor-NC (300 pmol). After incubation for 48 h, cell proliferation was assessed using a Cell Counting Kit-8 (CCK-8) (DojinDo, Tokyo, Japan) according to the manufacturer’s recommendations.
Phylogenetic tree, target genes and signalling pathways for bta-miR-145
The bovine, human, mouse, rabbit and swine miR-145 precursor sequences and the bta-miR-143 precursor sequence were downloaded from miRBase 21, and phylogenetic analysis was conducted using MEGA 5.05 software. The potential target genes of miR-145 were predicted with the TargetScan, PicTar, miRanda, miRBase and miRGen programmes. We entered all 648 bta-miR-145 target genes predicted by TargetScan into the DAVID database (http://david.abcc.ncifcrf.gov/) and analysed the bta-miR-145 signalling pathway.
3’RACE sequencing and binding site analysis of the predicted target IRS1
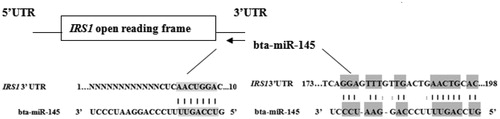
According to the above results, IRS1 was selected as a probable target of bta-miR-145. The bovine IRS1 3’UTR was searched in the NCBI nucleotide database (accession number: XM_003581871.4, http://www.ncbi.nlm.nih.gov/) and the Ensembl database (accession number: ENSBTAT00000028392, http://asia.ensembl.org/index.html). We found that bovine IRS1 was a predicted gene, and its 3’UTR was inconsistent in the two databases. Thus, we sent bovine mammary tissue samples to Takara Biotechnology Limited Company (Shiga, Japan) for bovine IRS1 3’RACE (rapid amplification of cDNA ends) sequencing. Because the mature sequence of bta-miR-145 (5′GUCCAGUUUUCCCAGGAAUCCCU3 ′) is the same as that of hsa-miR-145, we only needed to compare the human IRS1 binding site sequence with that of cows (Kozomara and Griffiths-Jones Citation2011). Shi et al. (Citation2007) confirmed that there are two binding sites in the human IRS1 3’UTR for miR145, one of which begins at nt1 of the IRS1 3’UTR, while the other begins at nt 173.
Minimum free energy analysis for probable binding sites
A database (http://bibiserv.techfak.uni-bielefeld.de/rnahybrid/) was used to predict the minimum free energy of the hybridisation of miR-145 to the bovine IRS1 3’UTR.
Real-time PCR assays for microRNAs and the predicted target IRS1
After bta-miR-145 mimic or inhibitor transfection, bta-miR-145 expression was assessed in pBMECs. At the same time, the effects of bta-miR-145 overexpression or inhibition on IRS1 were evaluated. After 24 h of transfection, total RNA was extracted from the cultured cells in all groups using TRIzol reagent (Invitrogen, Carlsbad, CA) according to the manufacturer’s protocol. Total RNA (200 ng) was transcribed into cDNA using a reverse transcription kit (Takara, Shiga, Japan, Code DRR047A). Relative gene expression was determined by real-time qPCR using the SYBR Premix Ex TaqTM II kit (Takara, Shiga, Japan, Code DRR081A).
The reverse transcription primers for microRNAs designed via the stem-loop method and specific qPCR primers are shown in Table . Reactions were performed in an ABI 7500 SDS instrument (Applied Biosystems, Foster City, CA) using the following conditions: 30 s at 95 °C, 40 cycles of 5 s at 95 °C (denaturation) and 34 s at 60 °C (annealing + extension). The accuracy of a primer pair was evaluated by the presence of a unique peak during the dissociation step at the end of qPCR. The relative quantification (△△Ct) method was used to analyse the data. According to Wang et al.’s report (2012), we used the geometric mean of 5SrRNA and U6 to normalise the expression of microRNA. The expression level of IRS1 was normalised to that of GAPDH.
Table 2. Primers for microRNA reverse transcription and real-time qPCR analysis.
Immunoblotting analysis for the predicted target IRS1
Cultured cells were harvested in RIPA buffer (Beyotime, Nantong, China, Code P0013B) supplemented with protease inhibitors (Thermo, Waltham, MA, Code 78430) for immunoblotting analysis after 72 h of transfection. Aliquots of protein lysates (50 μg) were fractionated by SDS-PAGE and electro-transferred to 0.45 μm PVDF membranes (Millipore, Billerica, IL, K6KN8780E). After blocking for 2 h in TBST containing 5% poultry serum, the membrane was incubated with the primary antibody for 1 h. The membrane was washed with TBST and incubated for 1 h with the secondary antibody. Primary antibodies against IRS1 (1:200, Santa Cruz, Santa Cruz, CA, code: sc-559) and β-actin (1:1000, Abcam, Eugene, OR, code: ab8227) were used. The secondary antibody used for all proteins was HRP-conjugated donkey anti-rabbit IgG (1:10,000, Abcam, Eugene, OR, code: ab16284). Immunoreactivity was visualised with DAB detection reagent (Beyotime, code: P0203). Bands were analysed using a Quantity One system (Bio-Rad, Hercules, CA). All data were normalised to β-actin.
Statistical analysis
Statistical analyses were carried out with SAS software (SAS Inst. Inc. Cary, NC, release 9.1). Fold changes in relative gene expression were calculated using the 2-ΔΔCt method. The data on cell proliferation were derived from the OD values obtained by the instrument used for enzyme quantification. All data were tested by one-way ANOVA. Data are shown as the means ± SEMs of 3 independent experiments. A probability level of p < .05 was considered statistically significant.
Results
Transfection efficiency
The bta-miR-145 mimic or inhibitor was successfully transfected into cells. The transfection efficiency was approximately 70% according to the ratio of the detected green fluorescence-labelled cells to the total cells (Figure ).
Figure 1. Cells images without or with bta-miR-145 transfection under fluorescence microscopy. (A) Bovine mammary epithelial cells without transfection (10 × 10). (B) Bovine mammary epithelial cells with bta-miR-145 mimic-FAM transfection(10 × 10). (C) Bovine mammary epithelial cells with bta-miR-145 inhibitor-FAM transfection (10 × 10).

Overexpression and inhibition of miR-145
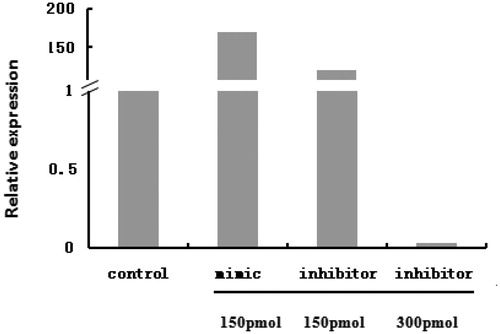
Bta-miR-145 expression in transfected cells was investigated by RT-qPCR. Compared with the control group, bta-miR-145 expression was upregulated by 170-fold in the 150 pmol mimic group, which reached the threshold for an overexpression effect. However, inhibitor treatment at a concentration of 150 pmol did not repress the expression of bta-miR-145. In contrast, bta-miR-145 expression was increased 110-fold in the 150 pmol inhibitor group. When the dose of the inhibitor was increased to 300 pmol, bta-miR-145 expression was downregulated by 10-fold (Figure ).
Figure 2. The bta-miR-145 overexpression and inhibition. Overexpression effect is caused by transfecting 150 pmol bta-miR-145 mimic. Inhibition effect is caused by transfecting 300 pmol bta-miR-145 inhibitor. The same as in Figures .
Bta-miR-145 affected cell proliferation
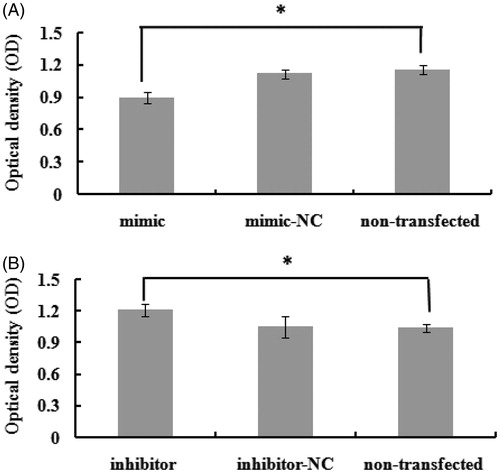
At 48 h after transfection, the proliferation of bovine mammary epithelial cells was assessed. The number of viable cells in the mimic group was significantly lower than that in the negative control group and the nontransfected group (p < .05) (Figure ). In contrast, cell proliferation was significantly promoted by bta-miR-145 inhibitor transfection (p < .05) (Figure ). These data suggested that bta-miR-145 influenced bovine mammary epithelial cell proliferation.
Figure 3. The effect of bta-miR-145 overexpression and inhibition on the cells proliferation. Optical density value indicates the number of live cells. NC means negative control. (A) Overexpression of bta-miR-145 significantly decreases the proliferation of mammary epithelial cells (p < .05). (B) Inhibition of bta-miR-145 significantly increases the proliferation of mammary epithelial cells (p < .05). * indicate significant differences at levels of p < .05.
Phylogenetic tree, predicted target genes and signalling pathway of bta-miR-145
According to phylogenetic tree analysis, bta-mir-145 showed the closest relationships to humans and swine (Figure ). Bta-mir-145 was located a relatively far from the same cluster (bta-mir-143). Insulin receptor substrate 1 (IRS1) was predicted to be the potential target gene of miR-145 by the TargetScan, PicTar, miRanda, miRBase and miRGen programmes. AACTGGA was the putative binding site according to several prediction programmes and matched the seed sequence of bta-miR-145. The analysis of the bta-miR-145 signalling pathway showed that 604 target genes of bta-miR-145 matched the ID numbers in the DAVID database, among which 28.6% of the genes were identified in the KEGG_PATHWAY database (Table ). The greatest number of the genes was involved in the MAPK signalling pathway. IRS1 also belongs to this pathway (Figure ).
Figure 4. Phylogenetic tree of bta-mir-145. The bovine, human, mouse, rabbit and swine miR-145 precursor were selected. Bta-mir-145 and bta-mir-143 are in the same cluster.
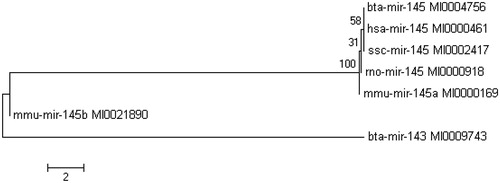
Figure 5. Two major signalling pathways related to IRS1.
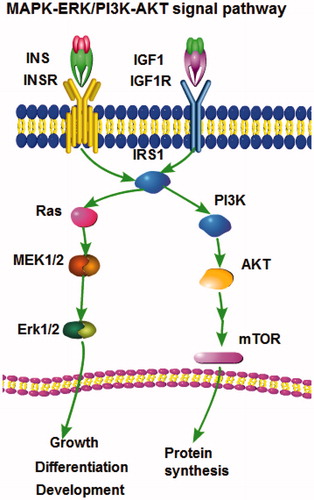
Table 3. Signalling pathway of bta-miR-145.
IRS1 3’RACE sequencing results and probable binding sites for bta-miR-145
According to the IRS1 3’RACE sequencing results, the actual bovine IRS1 3’UTR was almost identical to the predicted sequence (XM_003581871.2) in the NCBI database, and the identity was 99% (Supplementary Material S1). The sequence of the first binding site from the prediction was completely identical to the results of IRS1 3’RACE sequencing. Compared with humans, the second probable site also started at nt 173 in the bovine IRS1 3’UTR (Shi et al. Citation2007). However, several bases differed in the second site (Figure ). TCAGGAGTTTGTTGACTGAACTGCAC in humans was changed to TCAGGATTTCATTGACTGAACTGCAC in cows (the changed bases are underlined).
Figure 6. The two probable binding sites on the bovine IRS1 3’UTR for bta-miR-145. Matching bases were displayed with shadow.
Analytical results for the minimum free energy of probable binding sites
The minimum free energy of the hybridisation of miR-145 to the bovine IRS1 3’UTR is shown in Table according to the BiBiServ database (http://bibiserv.techfak.uni-bielefeld.de/rnahybrid/).
Table 4. The minimum free energy and the secondary structure of the binding sites.
Bta-miR-145 did not influence IRS1 mRNA expression
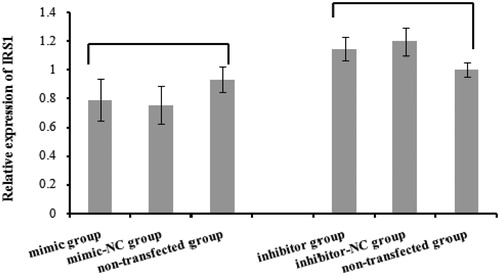
There were no significant differences in IRS1 mRNA expression between the mimic, mimic-NC and nontransfected groups (p > .05). IRS1 mRNA levels were also unaffected by the bta-miR-145 inhibitor (p > .05) (Figure ).
Figure 7. The effect of bta-miR-145 overexpression or inhibition on IRS1 mRNA level. No significant change for IRS1 mRNA expression appeared after bta-miR-145 mimic or inhibitor transfection (p > .05).
Bta-miR-145 affected IRS1 protein expression
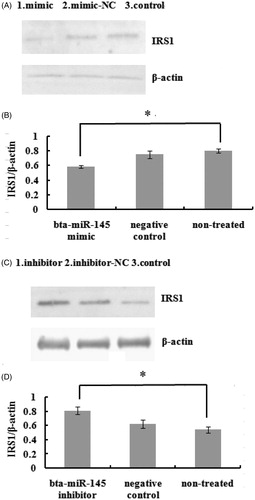
Figure shows that the expression of the IRS1 protein was reduced following bta-miR-145 mimic transfection for 72 h (p < .05) and that IRS1 protein expression was increased following bta-miR-145 inhibitor transfection for 72 h (p < .05) (Figure ). In brief, the above results showed that bta-miR-145 could inhibit IRS1 protein expression.
Figure 8. Protein greyscale scanning and statistical results of IRS1 by Western blotting. A and C respectively show IRS1 immunoblot in pBMECs after 72 h of transfect with the miR-145 mimic or inhibitor. B and D, respectively, show statistical result of protein relative expression levels. Protein expression was normalised to β-actin. * indicate significant differences at levels of p < .05.
Discussion
In dairy cows, miRNA can regulate mammary gland development and lactation. For example, miR-21-3p promotes the viability and proliferation of bovine mammary gland epithelial cells by targeting IGFBP5 (Zhang et al. Citation2019), and bta-miR-34b regulates milk fat biosynthesis by targeting DCP1A (Wang et al. Citation2019). Although the differential expression of miR-145 in the different lactation stages of the mammary gland has been reported (Wang et al. Citation2012), the understanding of the function of miR-145 in normal bovine mammary glands is deficient.
In this study, the effect of bta-miR-145 overexpression and inhibition on primary bovine mammary epithelial cells was investigated. We found that 150 pmol/well bta-miR-145 mimic could achieve the desired overexpression effect, but 150 pmol/well bta-miR-145 inhibitor could not achieve the expected inhibition effect, and only a high dosage of the inhibitor achieved the desired effect. The possible reason is that cells have a capacity for self-adjustment to a certain extent. Cells could tolerate a certain amount of the microRNA mimic to display the overexpression effect. When cells encounter less bta-miR-145, they compensate for the decrease and even produce more bta-miR-145. However, an excessive dose of the inhibitor exceeded the cellular feedback ability, and bta-miR-145 displayed inhibition.
It is well established that the number and vitality of bovine mammary epithelial cells are closely related to milk production (Santos et al. Citation2009). Thus, increases in viability and numbers of mammary epithelial cells will contribute to lactation. In this study, the overexpression of bta-miR-145 decreased the proliferation of mammary epithelial cells; in contrast, the inhibition of bta-miR-145 increased cell proliferation, which indicated that bta-miR-145 could regulate cell proliferation. A recent report also showed that bta-miR-145 could inhibit the proliferation of bovine Mac-T cells (Chen et al. Citation2019).
Using various target gene prediction websites, insulin receptor substrate 1 (IRS1) was predicted to be a potential target gene of miR-145. IRS1 is a docking protein for both the insulin-like growth factor 1 receptor (IGF1R) and the insulin receptor (IR). IRS1 mainly activates downstream PI3K/AKT and MAPK/ERK signalling cascades (Cao et al. Citation2007). The MAPK/ERK pathway is reported to be associated with cell proliferation, differentiation, migration, senescence and apoptosis (Sun et al. Citation2015). Although IRS1 is regulated primarily by phosphorylation/dephosphorylation (i.e. acutely rather than long-term), there are some data from bovine mammary glands indicating that transcriptional regulation might be important (Bionaz and Loor Citation2011).
Shi et al. (Citation2007) first identified IRS1 as a target of miR145 in humans. According to bovine IRS1 3’RACE sequencing, there are some differences in the binding site base composition between bovines and humans. Therefore, we cannot definitively state whether IRS1 is a target gene of bta-miR-145 without further validation. In our experiment, bta-miR-145 decreased IRS1 protein levels but did not downregulate the level of IRS1 mRNA. Bta-miR-145 exhibits the most common mechanism and regulates gene expression at the posttranscriptional level, which is in accordance with Shi’s report in humans. Bovine IRS1 3’RACE sequencing, bioinformatics analysis, and our present experimental results all indicated that IRS1 was a target gene of bta-miR-145. It is not only IRS1 but also many other predicted targets of bta-miR-145 that belong to the MAPK signalling pathway according to our analysis. Therefore, the effect of bta-miR-145 on cell proliferation is inferred to be mediated by the MAPK signalling pathway.
Conclusions
In conclusion, the present study suggests that bta-miR-145 influences cell proliferation by targeting IRS1. Therefore, bta-miR-145 is indirectly involved in mammary gland development and lactation by regulating cell proliferation. As a class of small molecules that regulate gene expression at the posttranscriptional level, the role of microRNAs in bovine mammary glands cannot be ignored.
Supplemental Material
Download MS Word (23.5 KB)Acknowledgements
The authors kindly acknowledge the help of Dr Wanli Li for providing advice and technical guidance.
Disclosure statement
No potential conflicts of interest were reported by the author(s).
Additional information
Funding
References
- Ambros V, Bartel B, Bartel DP, Burge CB, Carrington JC, Chen X, Dreyfuss G, Eddy SR, Griffiths J S, Marshall M, et al. 2003. A uniform system for microRNA annotation. RNA. 9:277–279.
- Bionaz M, Loor JJ. 2011. Gene networks driving bovine mammary protein synthesis during the lactation cycle. Bioinform Biol Insights. 5.
- Cao Z, Liu LZ, Dixon DA, Zheng JZ, Chandran B, Jiang BH. 2007. Insulin-like growth factor-I induces cyclooxygenase-2 expression via PI3K, MAPK and PKC signalinging pathways in human ovarian cancer cells. Cell Signal. 19:1542–1553.
- Chen Z, Xu X, Tan T, Chen D, Liang H, Sun K, Li M, Zhang H, Mao Y, Yang Z. 2019. MicroRNA-145 regulates immune cytokines via targeting FSCN1 in Staphylococcus aureus-induced mastitis in dairy cows. Reprod Dom Anim. 54:882–891.
- Gu Z, Eleswarapu S, Jiang H. 2007. Identification and characterization of microRNAs from the bovine adipose tissue and mammary gland. FEBS Lett. 581:981–988.
- Kozomara A, Griffiths-Jones S. 2011. MiRBase: integrating microRNA annotation and deep-sequencing data. NAR. 39:D152–D157.
- Li Q, Yang C, Du J, Zhang B, He Y, Hu Q, Li M, Zhang Y, Wang C, Zhong J. 2018. Characterization of miRNA profiles in the mammary tissue of dairy cattle in response to heat stress. BMC Genomics. 19:975.
- Santos SJ, Aupperlee MD, Xie J, Durairaj S, Miksicek R, Conrad SE, Leipprandt JR, Tan YS, Schwartz RC, Haslam SZ. 2009. Progesterone receptor A-regulated gene expression in mammary organoid cultures. J Steroid Biochem Mol Biol. 115:161–172.
- Shi B, Sepp-Lorenzino L, Prisco M, Linsley P, deAngelis T, Baserga R. 2007. MicroRNA 145 targets the insulin receptor substrate-1 and inhibits the growth of colon cancer cells. J Biol Chem. 282:32582–32590.
- Sun Y, Liu WZ, Liu T, Feng X, Yang N, Zhou HF. 2015. Signaling pathway of MAPK/ERK in cell proliferation, differentiation, migration, senescence and apoptosis. J Recept Signal Transduct Res. 35:600–604.
- Wang Y, Guo W, Tang K, Wang Y, Zan L, Yang W. 2019. Bta-miR-34b regulates milk fat biosynthesis by targeting mRNA decapping enzyme 1A (DCP1A) in cultured bovine mammary epithelial cells. J Anim Sci. 97:3823–3831.
- Wang M, Moisá S, Khan MJ, Wang J, Bu D, Loor JJ. 2012. MicroRNA expression patterns in the bovine mammary gland are affected by stage of lactation. J Dairy Sci. 95:6529–6535.
- Zhang X, Cheng Z, Wang L, Jiao B, Yang H, Wang X. 2019. MiR-21-3p centric regulatory network in dairy cow mammary epithelial cell proliferation. J Agric Food Chem. 67:11137–11147.