
Abstract
The objective was to determine optimal thresholds of blood variables that are associated with liver lipid and glycogen content in dairy cows. Liver specimens of 15 Holstein dairy cows were taken 2 weeks postpartum (PP) and used for determination of lipid and glycogen content, respectively. Blood samples were collected weekly, starting from week 2 antepartum (AP) up to week 2 PP. Selected blood parameters and body condition scoring (BCS) were evaluated through receiver operating characteristic curve analysis as indication of fat and glycogen content in the liver. Postpartal low liver glycogen content (mode < 2.0, semiquantitative analysis of glycogen content in the liver tissue samples) can be indicated if values are higher than 0.16 mmol/L, and 3.5 mmol/L for NEFA, and glucose, respectively, and lower than 0.65 mmol/L and 17.94 μU/mL for BHBA and insulin, respectively, 2 weeks AP. Postaprtal high liver fat content (>20%, stereological quantification of fat content in the liver tissue samples) can be indicated if values are higher than 3.5 for BCS at week 2 AP. Optimal time for indicating both low liver glycogen/high fat content is 1 week PP, with LDL < cut off point set at 0.18 mmol/L and BHBA > cut off point set at 0.88 mmol/L. Established cut off values in this study can be used for indication of fat and glycogen content in the liver of dairy cows.
More variables are reliable for indication of liver glycogen content than for indication of liver fat content.
Postpartum concentrations of LDL and BHBA can be used for indicating both high lipid liver content and low liver glycogen content.
Highlights
Keywords:
Introduction
Initiation of lactation in dairy cows is usually linked to negative energy balance (NEB) that provoke lipid mobilisation, leading to increased lipid accumulation in the liver. With the starting point of at least 20% of fat in cell volume being pathologic, the affected parenchyma is then divided, based on percentage of fat in cell volume, into moderate (20% to 40% of fat) and severe (above 40% of fat) fatty liver (Gaal et al. Citation1983; Šamanc et al. Citation2015). The rate of hepatic disfunction is associated with the degree of lipid, i.e. triglyceride (TG) accumulation in the hepatocytes, since TG content above 8% to 10% (% wet weight) leads to histological and functional disorders including impaired capacity to synthesise glucose (Bobe et al. Citation2004).
There are evidences that the ratio of lipid to glycogen in liver is essential predisposing factor for metabolic diseases in dairy cows, since increasing glycogen indirectly reduces the negative effects of increased fat accumulation in the liver (Drackley et al. Citation1992).
Estimating liver lipid and glycogen content in liver tissue samples obtained by biopsy method is the gold standard. Nevertheless, this method is not suitable for on farm conditions and herd monitoring (Gerspach et al. Citation2017).
Since overconditioning at calving is predisponing factor for the cow to enter more severe NEB after parturition and to develop fatty liver, average body condition score (BCS), as a valid indicator of energy status in dairy cows, is used in everyday practice to estimate predisposition of early lactating cows for metabolic disturbances (Jamali Emam Gheise et al. Citation2017; Ledinek et al. Citation2019). Additionally, blood concentrations of non-esterified fatty acid (NEFA) and β-hydroxybutyrate (BHBA) are increased during early lactation and may be toxic to cells and reduce gluconeogenesis in the liver (McCarthy et al. Citation2015). Also, liver parenchyma enzymes (GGT and AST) are released into the blood when liver cell membranes are impaired. Levels of many other biochemical parameters, including serum cholesterol, HDL, LDL and total bilirubin are also changed in the blood plasma of dairy cows with increased liver lipid content (Katoh Citation2002; Kalaitzakis et al. Citation2007).
Nevertheless, among all the available parameters that are changed when liver parenchyma is damaged, it is necessary to identify those that can reliable indict liver dysfunction in the early stage. Receiver operating characteristic (ROC) curve analysis is statistical tool that may assess the prognostic value of parameters, compare their predictive value and may help to identify optimal thresholds values for metabolic disorders (Ospina et al. Citation2010), including impaired lipid and glucose metabolism in the liver.
The objectives of this study were (1) to determine whether serum concentrations of cholesterol, HDL, LDL, total bilirubin, BHBA, NEFA, glucose, insulin and GGT and AST activity are associated with a hepatic lipid and glycogen content, and (2) to determine optimal thresholds for each parameter that are indicative for hepatic lipid and glycogen content on week 2 PP. Additionally, BCS and revised quantitative insulin sensitivity check index (RQUICKI) as surrogate indexes for insulin resistance estimation (Holtenius and Holtenius Citation2007), were evaluated with ROC analysis in the same manner as blood variables concentrations.
Material and methods
Animals
Fifteen dry Holstein cows were chosen from the commercial dairy herd and placed in the study. All cows were multiparous and ranged from 4 to 6 years of age. The cows were placed in a tie-stall barn. Cows received identical diets as TMR to allow ad libitum feed intake. At 25 d before expected time of parturition cows were assigned to the close-up diet (NEL=6.7 MJ/kg; Table ). The same lactation diet (NEL=7.3 MJ/kg; Table ) was provided for all animals postpartum until day 30 of lactation. All offered diets were initially formulated to either meet or exceed the NRC (Citation2001) requirements. The feed was offered in two equal portions at 0700 h and 1800 h, and cows had a free access to water throughout the study. The animal-related component of the study was approved by the Ethical Committee of the Faculty of Veterinary Medicine, University of Belgrade approval No 4/2015.
Table 1. Ingredients and chemical composition of the close-up and lactation diets.
Liver biopsy and histologic examination of the liver tissue
Hepatic tissue samples were taken at week 2 antepartum - AP (14.77 ± 0.76 days before partus), and at week 2 postpartum - PP, using local anaesthesia with lidocaine (Lidocaine inj. 2% BP; Rotexmedica, Trittau, Germany) as described by Šamanc et al. (Citation2010). Tissue samples were fixed in 10% formalin 24 h at room temperature, dehydrated and embedded in paraffin. Serial sections were stained with haematoxylin and eosin stain for stereological quantification of fat content, and periodic acid-Schiff stain for semiquantitative analysis of glycogen content (Merck KGaA, Germany). Sections were examined using microscope with digital camera (Olympus CX31 with SensEntry 1.13 software, Germany) by two observers who were blinded for the group assignment.
The stereological analysis were conducted using a stereological grid as previously described (Gaal et al. Citation1983; Šamanc et al. Citation2015). Cows were divided into two subgroups based on the degree of liver lipid content at week 2 PP: High liver fat cows (HLF subgroup, >20% fat, n = 8) and Low liver fat cows (LLF subgroup, ≤20% fat, n = 7).
The evaluation of the degree of glycogen in hepatocytes was performed by the semiquantitative approach (Gerspach et al. Citation2017) and sections were reported as: total lack of glycogen (0), severe lack of glycogen (1), mild lack of glycogen (2) and optimal content of glycogen (3). The mode of 20 examined fields was calculated and cows were divided into two subgroups based on the degree of the liver glycogen content at week 2 PP: Low liver glycogen cows (LLG subgroup, mode < 2.0 glycogen, n = 7) and High liver glycogen cows (HLG subgroup, mode ≥ 2.0 glycogen, n = 8).
Blood analyses, RQUICKI value and BCS
Blood samples were taken at week 2 AP (14.77 ± 0.76 days before partus), week 1 AP (8.00 ± 0.51 days before partus), at day of partus, weeks 1 and 2 PP. Samples were taken from the jugular vein into test tubes without anticoagulant and serum was separated by centrifugation at 4 °C for 20 min at 1000 g. The serum cholesterol, HDL, LDL, total bilirubin, BHBA, NEFA, glucose, insulin concentrations and GGT and AST activity were measured by using the respective kits: cholesterol, HDL, LDL, total bilirubin, glucose, GGT and AST from Biosystems, Spain and NEFA and BHBA from Randox, UK. Insulin concentrations were measured using radioimmunoassay (INEP, Serbia), intended for human sera, but validated for bovine sera. Cross reactivity of the anti-human with bovine antibodies were close to 100%. Standards for the radioimmunoassay were made from bovine samples. Intra- and inter-assay coefficients of variation (CV) were less or equal with 10% and less than 5%, respectively. RQUICKI was determined from all blood samples to evaluate insulin resistance as described earlier (Holtenius and Holtenius Citation2007). BCS was estimate at week 2 AP and at week 2 PP on scale of 1 to 5, using increments of 0.25 (Šamanc et al. Citation2015).
Statistical analysis
The nonparametric test was used to test difference between subgroups, and p ˂ .05 was considered as significant. Nonparametric Spearman rank correlation coefficient was used to determine the correlation between blood variables and hepatic content of fat and glycogen. If parameter showed significant difference between subgroup, correlated with lipid and glycogen content, parameter was considered for indication and thresholds. The ROC curve analysis was applied for selection of thresholds for each blood variables in the time interval from week 2 AP to week 2 PP (Gardner and Greiner Citation2006).
Results and discussion
The liver fat content at 2 week AP was 0.46 ± 0.46% for HLF, and only 1 cow from 8 had liver fat content above 0.00%. The liver fat content at 2 week AP was 0.00 ± 0.00% for LLF subgroup. The liver fat content at 2 week PP was 34.39 ± 3.49% and 12.46 ± 1.61% for HLF and LLF, respectively. Additionally in HLF group 6 of 8 examined cows had simultaneously low glycogen content at 2 week PP. As observed earlier (Drackley et al. Citation1992) our study showed that high lipid accumulation in liver is usually combined with low glycogen content. Increased level of liver TAG are accompanied by decreased concentrations of structural lipids, energy precursors and glycogen as energy storage molecule. Decreased concentrations of glycogen indicate an increased risk for metabolic disorders and low productivity that are associated with fatty liver (Rukkwamsuk et al. Citation1999; Bobe et al. Citation2004).
Blood variables that showed significant differences between HLF and LLF subgroups, at least in one examined time period are presented in Figure . Blood variables that showed significant differences between LLG and HLG subgroups, at least in one examined time period, are presented in Figure . As shown in Table , results from ROC analysis suggest that postpartal high liver fat content can be indicated if cut off value is higher than 3.5 for BCS determined at week 2 AP. On the other hand, low postpartal liver glycogen content can be indicated if 2 weeks AP cut off values are higher than 0.16 mmmol/L and 3.5 mmol/L for NEFA and glucose, respectively, and lower than 0.65 mmol/L and 17.94 μU/mL for BHBA and insulin, respectively. Our results, obtained by ROC analyses, showed that at week 2 AP BHBA, NEFA, glucose and insulin concentrations may be used for indication of glycogen and only BCS for liver fat content meaning that postpartal liver glycogen content can be indicated earlier in antepartum period then liver fat content. Risk factors for impaired liver function in dairy cattle can be divided in three groups: nutritional, managerial and genetic, without strict boundary between them (Bobe et al. Citation2004). We can speculate that postpartal glycogen content in the liver is more genetically determined then liver lipid content, which seems to be more nutritional determined. To support this conclusion, our results showed that BCS ≥ 3.5 at 2 week AP is good indictable parameter for postpartal high liver lipid content and according to previous researches (Bobe et al. Citation2004) obesity (BCS ≥ 4), is the primary nutritional risk for fatty liver. Obese pregnant cows are more prone to lipomobilisation even in the state of positive energy balance which occurs during antepartal period, since those cows have a greater decrease in feed intake and develop severe NEB (Rukkwamsuk et al. Citation1999). Nevertheless, further studies are warrant to determine differences in factors involved in glycogen and fat metabolism disturbances in postpartal liver. Our results showed that NEFA concentration, both AP and PP, is not good indicator of liver fat content, although, it is direct indicator of lypomobilisation. As suggested earlier (Ospina et al. Citation2010) postpartal NEFA is more strongly associated with the development of clinical diseases (ketosis, metritis and retained placenta) in cows then antepartal NEFA. Authors concluded that NEFA concentrations determined in blood samples taken timely closer to desases are more reliable for prediction of disease. There was no clinical sign of diseases in our study which could be explanation of absence of relationship between levels of blood NEFA and postpartal metabolic disturbances in liver.
Figure 1. Comparison of patterns of HDL, LDL, BHBA and insulin concentrations (mean ± SE) in serum of HLF cows (subgroup – high liver fat cows, determined 2 weeks PP) and LLF cows (subgroup – low liver fat, determined 2 weeks PP), from week 2 AP until week 2 PP. *significant difference (p < .05) between subgroups. HDL: high density lipoproteins; LDL: low density lipoproteins; BHBA: β-hydroxybutyrate; HLF: high liver fat; LLF: low liver fat.
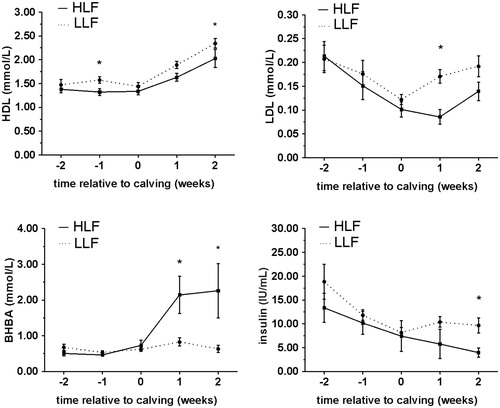
Figure 2. Comparison of patterns of HDL, LDL, BHBA, NEFA, glucose and insulin concentrations (mean ± SE) in serum of LLG cows (subgroup – low liver glycogen cows, determined 2 weeks PP) HLG cows (subgroup –high liver glycogen cows, determined 2 weeks PP), from week 2 AP until week 2 PP. *significant difference (p < .05) between subgroups. HDL: high density lipoproteins; LDL: low density lipoproteins; BHBA: β-hydroxybutyrate; NEFA: non-esterified fatty acid; HLG: high liver glycogen; LLG: low liver glycogen.
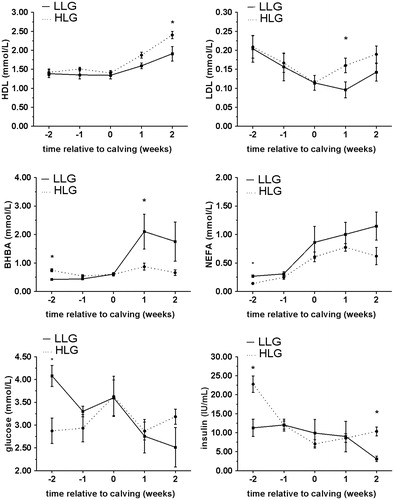
Table 2. Receiver operator characteristic curve determination of critical HDL, LDL, BHBA, NEFA, glucose, insulin and body condition scoring (BCS) cut-off values as indicators of high liver fat content: >20% fat and low liver glycogen content: <2.
No variable determined week before calving and at the week of calving showed potential to be used as indicator for both postpartal liver fat and glycogen content in our study. Since period around calving is time of intensive metabolic and endocrine changes it can be supposed that values of blood parameters varies significantly due to factors related primarly to act of calving (Ingvartsen Citation2006).
At week 1 PP concentrations of HDL, LDL and BHBA, may be good indicators of high liver fat content if cut off values are lower than 1.73 mmol/L and 0.16 mmol/L for HDL and LDL, respectively, and higher than 0.88 mmol/L for BHBA. Also at week 1 PP, concentrations of LDL and BHBA may be good indicators of low liver glycogen content if cut off values are lower than 0.18 mmol/L for LDL, and higher than 0.88 mmol/L for BHBA (Table ). Our results suggests that LDL and BHBA can be used as indicators for both postpartal low glycogen content and high fat content. Decreased LDL concentrations in the serum of cows with fatty liver was reported earlier and could result from several mechanisms including decreased VLDL secretion, decreased conversion of VLDL to LDL reduced transformation of VLDL into LDL and/or increased LDL catabolism. Our study confirmed that, LDL is more reliable indicator compared to HDL (Katoh Citation2002). Blood BHBA concentration is the gold standard for indication and diagnosis of fatty liver related diseases such as ketosis with serum concentration above 1.2 mmol/L as commonly used as cut off point for detection of subclinical form (McCarthy et al. Citation2015). In our study, BHBA concentration above 0.88 mmol/L at 1 week PP may be used as reliable indicator of postpartum low glycogen/high fat content in liver. Overall, BHBA concentration seems to be much better indication parameter then NEFA concentration in our study. Although, concentration of BHBA and NEFA as indicators of NEB have commonly been presented together (Ospina et al. Citation2010) there is weak relationship between blood concentrations of NEFA and BHBA during the periparturient period of dairy cows, suggesting that elevated concentrations of one should not be extrapolated to suggest elevated concentrations of the other metabolite (McCarthy et al. Citation2015). Our results can support results from Pilotto et al. (Citation2016) who found relatively strong negative correlation between BHBA concentration in peripartal period and α-tocopherol, vitamin with positive effects on liver function in dairy cows. On the other hand, this correlation was not find with NEFA concentration.
The relationship between liver fat content and total bilirubin concentration as well as serum liver enzyme activity has been found by Kalaitzakis et al. (Citation2007) but not in study of Gonzalez et al. (Citation2011). In the present study, total bilirubin concentrations and activities of serum GGT and AST did not show that may be used as indicator of both fat and glycogen content in postpartal liver. These parameters reflect, at least in part, degree of hepatocytes damage (Kalaitzakis et al. Citation2007).
Conclusions
In summary, more variables are reliable for indication of liver glycogen content than for indication of liver fat content, probably due to different risk factors underlying these metabolic disorders. Postpartum concentrations of LDL and BHBA can be used for indicating both high lipid liver content and low liver glycogen content. Cut off points that are set in our study may be used for early herd monitoring of animals predisposed to metabolic disorders that are usually associated with decreased productivity of animals.
Disclosure statement
No potential conflict of interest was reported by the author(s).
Additional information
Funding
References
- Bobe G, Young JW, Beitz DC. 2004. Pathology, etiology, prevention, and treatment of fatty liver in dairy cows. J Dairy Sci. 87:3105–3124.
- Drackley JK, Richard MJ, Beitz DC, Young JW. 1992. Metabolic changes in dairy cows with ketonemia in response to feed restriction and dietary 1, 3-butanediol. J Dairy Sci. 75:1622–1634.
- Gaal T, Reid IM, Collins RA, Roberts CJ, Pike BV. 1983. Comparison of biochemical and histological methods of estimating fat content of liver of dairy cows. Res Vet Sci. 34:245–248.
- Gardner IA, Greiner M. 2006. Receiver-operating characteristic curves and likelihood ratios: improvements over traditional methods for the evaluation and application of veterinary clinical pathology tests. Vet Clin Pathol. 35:8–17.
- Gerspach C, Imhasly S, Klingler R, Hilbe M, Hartnack S, Ruetten M. 2017. Variation in fat content between liver lobes and comparison with histopathological scores in dairy cows with fatty liver. BMC Vet Res. 13:98.
- Gonzalez FD, Muino R, Pereira V, Campos R, Benedito JL. 2011. Relationship among blood indicators of lipomobilization and hepatic function during early lactation in high-yielding dairy cows. J Vet Sci. 12:251–255.
- Holtenius P, Holtenius KA. 2007. Model to estimate insulin sensitivity in dairy cows. Acta Vet Scand. 49:29.
- Ingvartsen KL. 2006. Feeding-and management-related diseases in the transition cow: Physiological adaptations around calving and strategies to reduce feeding-related diseases. Anim Feed Sci Tech. 126:175–213.
- Jamali Emam Gheise N, Riasi A, Zare Shahneh A, Celi P, Ghoreishi SM. 2017. Effect of pre-calving body condition score and previous lactation on BCS change, blood metabolites, oxidative stress and milk production in Holstein dairy cows. Ital J Anim Sci. 16:474–483.
- Kalaitzakis E, Roubies N, Panousis N, Pourliotis K, Kaldrymidou E, Karatzias H. 2007. Clinicopathologic evaluation of hepatic lipidosis in periparturient dairy cattle. J Vet Intern Med. 21:835–845.
- Katoh N. 2002. Relevance of apolipoproteins in the development of fatty liver and fatty liver-related peripartum diseases in dairy cows. J Vet Med Sci. 64:293–307.
- Ledinek M, Gruber L, Steininger F, Fuerst-Waltl B, Zottl K, Royer M, Krimberger K, Mayerhofer M, Egger-Danner C. 2019. Analysis of lactating cows in commercial Austrian dairy farms: interrelationships between different efficiency and production traits, body condition score and energy balance. Ital J Anim Sci. 18:723–733.
- McCarthy MM, Mann S, Nydam DV, Overton TR, McArt JA. 2015. Concentrations of nonesterified fatty acids and β-hydroxybutyrate in dairy cows are not well correlated during the transition period. J Dairy Sci. 98:6284–6290.
- [NRC] Nutrient Requirements of Dairy Cattle. 2001. National Research Council. 7th rev. ed. Washington, DC: National Academy Press.
- Ospina PA, Nydam DV, Stokol T, Overton TR. 2010. Evaluation of nonesterified fatty acids and beta-hydroxybutyratein transition dairy cattle in the northeastern United States: critical thresholds for prediction of clinical diseases. J Dairy Sci. 93:546–554.
- Pilotto A, Savoini G, Baldi A, Invernizzi G, De Vecchi C, Theodorou G, Koutsouli P, Politis I. 2016. Associations between blood fatty acids, β-hydroxybutyrate, and α-tocopherol in the periparturient period in dairy cows: An observational study. J Dairy Sci. 99:8121–8126.
- Rukkwamsuk T, Kruip TA, Wensing T. 1999. Relationship between overfeeding and overconditioning in the dry period and the problems of high producing dairy cows during the postparturient period. Vet Quart. 21:71–77.
- Šamanc H, Gvozdić D, Fratrić N, Kirovski D, Djoković R, Sladojević Ž, Cincović M. 2015. Body condition score loss, hepatic lipidosis and selected blood metabolites in Holstein cows during transition period. Anim Sci Pap Rep. 33:35–47.
- Šamanc H, Stojić V, Kirovski D, Jovanović M, Cernescu H, Vujanac I. 2010. Thyroid hormones concentrations during the mid-dry period: an early indicator of fatty liver in Holstein-Friesian dairy cows. J Thyr Res. 1:897602.