
Abstract
The present study aims to evaluate beef cattle welfare with an integrated approach as housing conditions and management practices change and to investigate the relationship between the adopted parameters and their applicability. A total of 15 Piemontese breed bulls reared in a tied stall housing system and 15 Piemontese, 15 Blonde d’Aquitaine and 15 cross-breed from Ireland reared in group-pen were considered. A welfare protocol including a checklist and the ‘RIBECA’ scoring system was prepared for the assessment of animal-based measures and resource-based measures. Blood parameters and hair 20β-dihydrocortisol were also analysed. The animal-based score was not significantly different among the farms, while the total welfare score was ‘poor’ for the animals in the tied stall system, ‘fair’ for Piemontese cattle in the in pen and Irish cross-breed, and ‘very good’ for the Blonde d’Aquitaine cattle. Irish cross-breed were the most fearful, with the blood findings also suggesting that these animals showed the worst adaptation, whereas Blonde d’Aquitaine cattle were well adapted. Furthermore, 20β-dihydrocortisol was lower (p < .01) in Blonde d’Aquitaine cattle when compared to Piemontese cattle tied and Irish cross-breed. The concordance between haematochemical and hair 20β-dihydrocortisol findings observed in the present study suggests that Blonde d’Aquitaine and Piemontese cattle reared in pens were less stressed during their livestock life. Measurements of cortisol metabolites in the hair matrix seem to be a valid diagnostic tool for monitoring animal exposure to situations capable of increasing cortisol levels over time.
Husbandry and management conditions could negatively affect animal welfare.
The RIBECA protocol adopted identified some beef cattle welfare critical points.
Checking of different blood parameters and hair cortisol metabolites may integrate welfare assessment.
Highlights
Introduction
Husbandry and management conditions, along with the farmer attitude towards his/her cattle herd, more or less intensive feeding systems and rearing environment represent some of the factors that could negatively affect animal welfare (Cozzi et al. Citation2009) and may produce behavioural, biochemical, and endocrine modifications in the animals.
Among farm animals, beef cattle may frequently suffer from poor welfare due to their intensive rearing systems adopted in many EU Countries. In April 2012, EFSA published a Scientific Opinion about the welfare of cattle kept in farming systems for beef production (EFSA Citation2012). According to this opinion, major welfare problems in cattle kept for beef production were respiratory diseases linked to overstocking, inadequate ventilation, mixing of animals, digestive disorders due to intensive concentrate feeding and behavioural disorders resulting from inadequate floor space, and co-mingling (mixing of animals from different sources in the feedlot). However, no specific legislation referring to thewelfare of beef cattle older than six months is currently available. For this reason, the development of appropriate procedures to assess, monitor, and improve beef cattle welfare still represents a crucial issue. Formulate an appropriate and practicable animal welfare assessment protocol requires the identification and selection of suitable welfare measures for each production system. On-farm animal welfare assessments need to incorporate animal-based indicators, in addition to the typical resources-based ones, because animal welfare is multidimensional and as many different components (Webster Citation2012). Different on farm methods have previously been developed in Europe (Bartussek et al. Citation2000; Botreau et al. Citation2007; Welfare Quality® Citation2009). In particular, the RIBECA protocol (Gastaldo et al. Citation2013), which considers both animal- and resources-based measures, and integrates the constraints imposed by the existing laws with the recommendations of EFSA opinion, can perfectly fit within this scenario.
The haematological blood indicators are the main determinant of the animals’ environmental adaptation and, in turn, their welfare (Anderson et al. Citation1999). To monitor stress, specific haematological/serum parameters like as/neutrophils/lymphocytes ratio, white blood cells, markers of oxidative stress (d-ROMs) and hair cortisol and metabolites are commonly used (Moya et al. Citation2013; Starvaggi Cucuzza et al. Citation2014; Mirzad et al. Citation2018). Adrenal hormones (cortisol and its metabolites -20β-dihydrocortisol-) represent one of the most important physiological parameters to measure the stress response. In particular, hair cortisol analysis represents a useful and complementary method for monitoring stress, since it captures the systemic cortisol exposure over longer periods of time (Russel et al. Citation2012).
Based on the above-reported background, the present study aimed to (1) evaluate beef cattle welfare using a multidisciplinary approach, (2) investigate the relationship between the monitoring parameters, (3) assess their applicability and (4) investigate the impact on growth and slaughtering performance.
Materials and methods
Animals, rearing and feeding systems
The survey was performed in four intensive beef cattle farms located in northern Italy (Piedmont region). The study was carried out on 60 bulls homogeneously spread in the selected farms. All the animals were non-castrated males.
Farm A: 15 Piemontese breed calves, born in the same farm and reared in multiple pens (8 animals/pen) with straw bedded floor until 6 months of age and 220-250 kg of live weight (LW). After that, they were fattened until 600-680 kg of LW in tied stall, the animals were kept in two rows of single tie-stalls facing each other (2.05 m length by 1 m width; 2.05 m2 head−1) and divided by a feeding alley; they are tied by a chain fixed to the head rail. Animals were accommodated on concrete solid floor bedded with cereal straw, renewed twice a day. Fattening period feed was represented by ground corn silage, corn meal, commercial feedstuff and hay.
Farm B: 15 Piemontese breed calves bought at 80–180 kg of LW; the animals were reared in straw-bedded pens (6.5 × 5 m each) with lock-in stanchion until 650 kg of LW. Each pen housed 8 cattle (4.1 m2 head−1) and the manger front was 5 m length (0.6 m head−1). The calves were housed on permanent straw litter, added daily and renewed monthly. The used diet was a total mixed ration (TMR) based on ground corn silage, corn meal and commercial feedstuff plus beet molasses, wheat bran, cereal straw and Italian ryegrass hay.
Farm C: 15 over six months old Blonde d’Aquitaine calves bought from France at about 300–350 kg of LW. These animals, after a quarantine period of at least 30 days, were reared in pens for group with concrete floor and straw litter added daily. The pens were a 6 × 6 m (4.5 m2 head−1), housing 8 cattle each; for every pen cattle had 0.75 m of manger front. The animals were fattened until 640–700 kg of LW. Fattening period feed includes, in order of quantity, corn meal, wheat straw, soybean meal, wheat bran, dried beet pulp, sunflower meal solvent, beet molasses and wheat meal. Starch sources were increased over 500 kg of LW. The diet was a TMR supplied ad libitum.
Farm D: 15 cattle imported from Ireland; they were crossbreeds of several breeds such as Angus, Limousine and Belgian Blue. The bulls were bought at 400–430 kg of LW and 11 months of age. During an initial quarantine and adaptation period of about 40 days, the animals were reared in pens (8 × 8 m) with 8–9 heads (7–8 m2 head−1), straw bedded floor and free access to a paddock (about 9000 m2; at least 150 m2 head−1) to reduce the transport and post-transport stress conditions. After this period, the cattle were reared in pens (6 × 7 m; 5 m2 head−1 about; 0.8–0.9 m of manger front) with concrete floor and straw litter added daily, each containing at most nine animals. The animals were fattened until 700–750 kg of LW. The diet was prepared using rationed flaked corn, extruded soybean, wheat bran, mineral and vitamin supplementation and ad libitum wheat straw or Italian ryegrass hay.
In each farm, feeds or TMR when adopted were sampled to determine the proximate composition of the diets. All samples were analysed in the laboratories of the Department of Agriculture, Forestry and Food Science of the University of Torino according to AOAC International (Citation2006). The proximate composition was used to calculate the energy concentration of the diets expressed as Meat Forage Unit (Meat FU; INRA Citation2007) (Table ).
Table 1. Fattening diets composition as percentage of Dry Matter and energy concentration.
Welfare protocol
A welfare protocol including a checklist and the ‘RIBECA’ scoring system (formulated by the Research Centre for Animal Production, Italy - CRPA, Gastaldo et al. Citation2013) was prepared for the assessment of animal – and resource-based measures (Welfare Quality® Citation2009). This is an innovative system of animal welfare assessment for beef fattening farms and predisposes a specific farm checklist, the inclusion of the collected data into a designed software, the automatic calculation of the obtained scores, the classification of the farm based on a wellbeing rank (1 = farm with poor level of welfare to 6 = farm with high level of welfare), the identification of critical points and potential improvement tools, and the assessment of their economic applicability.
As resource indicators, farm dimensions, breeds raised, density, access to pasture, pen features, management/housing systems (illumination, ventilation, dustiness, frequency of animal checking, farmers’ number, farmers and educational levels) are considered. The animal-based measures take into account mortality rate, BCS, integument alterations, lameness, ocular/nasal discharge, diarrhoea, coughs, swollen rumen, dehorning, temperament and human–animal relationship (avoidance test). The average duration of the survey range from 90 to 180 minutes based on the number of buildings and animals present. A final score and two partial scores, related to direct and indirect measurements, is assigned to each farm. The total score reached by each farm could be: bad, poor, sufficient, fair, good and excellent.
In the present trial, the observations were performed two times: 3 weeks after the arrival of the animals at the fattening farm (T0) and after 5 months (T1).
Haematological and biochemical parameters
Blood samples were collected from each animal via caudal/jugular venipuncture for haematological and biochemical investigations. Blood parameters were analysed two times: at the beginning of the growing period-T0 and at the end of the fattening cycle, after 5 months -T1.
The following parameters were analysed: (1) haematological (white blood cells [WBC], red blood cells [RBC], haemoglobin [HGB], haematocrit [HCT] and neutrophils to lymphocytes ratio [N/L] using an automated haematology analyser [ADVIA 120, Siemens, Munich, Germany]); (2) biochemical (total proteins, albumin, creatin kinase [CK], creatinine, aspartate transaminase [AST], lactate dehydrogenase [LDH], cholesterol, glucose and triglycerides) through an automatic analyser [ILab Aries, Instrumentation Laboratory, Werfen Company]. Reactive oxygen metabolites (dROMs test, DIACRON INTERN. IT) were also evaluated by spectrophotometric analysis according to the manufacturer’s instructions. dROMs levels are expressed in arbitrary units, namely Carratelli units (U.CARR). A single U.CARR corresponds to 0.08 ng/100 mL of H2O2.
Hair cortisol and metabolites
Nowadays, the most commonly employed method for hormone hair determination in clinical applications is immunoassays with chemiluminescence detection (Kirschbaum et al. Citation2009) or enzyme-linked immunosorbent assays (ELISA; Sauvé et al. Citation2007; Thomson et al. Citation2009; Manenschijn et al. Citation2011; Manenschijn et al. Citation2012), but all these methods were originally designed for the measurement of salivary cortisol and not for the hair matrix. Moreover, only the determination of cortisol is possible with a salivary kit, not 20β-dihydrocortisol. More recently, a high-performance liquid chromatography (HPLC) method with fluorescence detection (Gao et al. Citation2010) and LC-MS/MS method (Gao et al. Citation2013; Noppe et al. Citation2015) were developed for a wide hormones panel and applied on human hair. The LC-MS/MS method used in the present study allows the simultaneous detection of cortisol and its metabolites cortisone and 20β-dihydrocortisol, whose detection limits range from 0.1 ng/g (20β-dihydrocortisol) to 1 ng/g (cortisol and cortisone). Hair aliquots of about 200 mg from the neck, tail and back were sampled at the end of the fattening cycle, transferred into 30-mL glass tubes and added with 3.0 mL of dichloromethane to remove the external contamination. After removal of the organic solvent, the decontamination step was repeated once more. The cleaned hair was dried under a nitrogen stream and then cut into tiny fragments with clean scissors. An aliquot of 100 mg was exactly weighted and added with the internal standards mixture solution (cortisol d2 and cortisone d2). Sample extraction was carried out by the addition of 1 mL of methanol and incubation at 55 °C for 15 h. Finally, the organic phase was collected and evaporated to dryness under a gentle stream of nitrogen and mild heating (25 °C) using a Techne Sample Concentrator (Barloworld Scientific, Stone, UK). The residue was dissolved in 100 μL of MeOH, transferred into a vial, centrifuged at 4000 for 10 min. Furthermore, 20 μL of the solution was injected into the LC–MS/MS system. The chromatographic separation was performed on an Agilent 1100 series liquid chromatograph (Agilent Technologies, Palo Alto, CA, USA) interfaced with a triple an Applied Biosystems API 4000 triple-quadrupole mass spectrometer (Applied Biosystems Sciex, Ontario, Canada), operating in atmospheric pressure chemical ionisation positive ion mode. Ion acquisition was operated at unit mass resolution in the selected reaction monitoring (SRM) mode, using for each analyte three transitions from the protonated molecular ion to specific fragment ions. The chromatographic run was carried out by a binary mobile phase of water and acetonitrile, using a gradient programme, on a Merck LiChroCART – C18 (5 mm) 150 mm × 4.6 mm column.
Live and slaughtering performance
Initial, at the arrival of the calves at the fattening farm (IW), and slaughtering live weight (SW), initial (IA) and slaughtering age (SA), feed consumption (FC), average daily gain (ADG), feed conversion rate (FCR), carcase weight (CW) and dressing percentage (DP) were recorded or calculated for each group of animals.
Statistical analysis
The statistical analysis was performed using IBM SPSS Statistics V20.0.0 software. The animal was considered as an experimental unit. Shapiro–Wilk’s test was used to establish normality or non-normality of data distribution. The haematochemical parameters and dROMs data were tested by means of ANCOVA, considering the farm as fixed factor and the animal age as covariate. Kruskal–Wallis test was used to compare the 20β-dihydrocortisol data among the animal groups. p values <.05 were considered statistically significant. Data were expressed as estimated marginal means (adjusted for the animal age) and standard error of the mean (SEM).
Results
Welfare evaluation
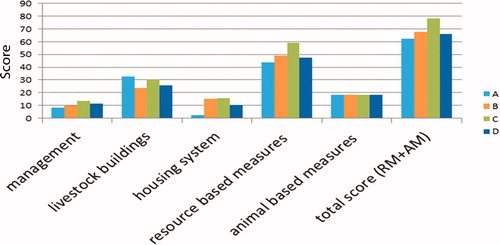
The results of the welfare evaluation are shown in Figure . The management score, which is related to the hygiene-sanitary aspects, showed no substantial differences between the four farms. The livestock buildings score, which is referred to the characteristics of the shelters and the environmental control, differed between the farms, since Farm A and D showed the lowest scores and Farm C and B the highest ones. The housing system score, which is related to the breeding method, showed that Farm A (animals tied and lack of space of the single tie-stalls) had the lowest score, while lower values were observed in Farm D when compared to Farm B and C. All the farms showed clean facilities. The total resource-based measures score of Farm C was significantly higher when compared to the others, whereas the lowest score was observed in Farm A. The two other farms had similar scores. The total welfare score was ‘sufficient’ for farm A, ‘fair’ for farms B and D, and ‘good’ for farm C.
Figure 1. RIBECA scoring system in the four farms. A: Piemontese breed bulls reared in tie stall housing system; B: Piemontese breed bulls reared in group-pen; C: Blonde d’Aquitaine breed bulls reared in group-pen; D: Cross-breed (from Ireland) reared in group-pen.
The animals of Farm A were clean, quiet and did not retreat when interacting with the detector. No particular health problems were observed. The animals of Farm B were homogeneous in relation to sex and age, clean, fairly quiet and did not retreat when interacting with the detector. No significant health issues were identified. Blonde d’Aquitaine animals of Farm C were the most hyperactive. More mounting and fighting were detected in pens when compared to the other farms. The animals of the Farm D were very scared and unapproachable. Main critical animal-based measures are summarised in Table .
Table 2. Main critical animal based measures of the beef cattle from the four farms.
Haematological and biochemical parameters
Table summarises the significant haematological and biochemical parameters of the animals from the four farms. All the findings fell within the physiological range reported for the bovine species. To give an overall view about the most relevant findings, the dROMs were lower in Farm C animals than the other farms (p < .001). Farm D cattle showed higher WBC and neutrophils than the other groups (p < .001). Furthermore, animals from Farms A and D displayed lower glucose and cholesterol when compared to Farms B and C (p < .001). Farm A cattle also showed lower RBC, HGB, HCT and albumin, as well as higher eosinophils, in comparison with the other groups (p < .001). By comparing Farm A and Farm B, the tied animals showed higher WBC concentration and lower concentration of glucose, cholesterol, LDH, albumin, total protein, and creatinine kinase.
Table 3. Haematological and biochemical parameters of the beef cattle from the four farms.
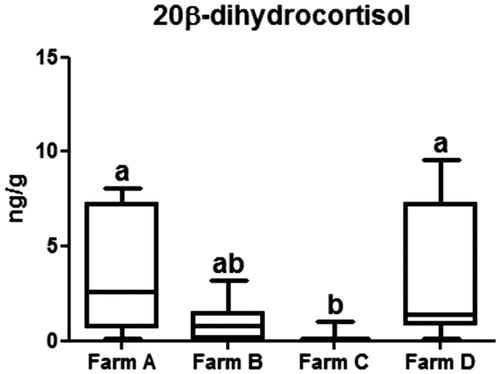
The higher sensitivity observed for 20β-dihydrocortisol partly explains its adoption as a biomarker for monitoring chronic stress, in substitution of cortisol The lower concentration of the latter with respect to 20β-dihydrocortisol can also be justified by the occurrence of a dissimilar incorporation mechanism into the keratin matrix, because of their different hydrophilicity. The 20β-diidrocortisol was lower (p < .01) in Farm C animals when compared to Farm A and D (Figure ).
Figure 2. 20β-dihydrocortisol concentration in the four farms. Box plots with different superscript letters (a, b) differ significantly (p < 0.05). Farm A: Piemontese breed bulls reared in tie stall housing system; Farm B: Piemontese breed bulls reared in group-pen; Farm C: Blonde d’Aquitaine breed bulls reared in group-pen; Farm D: Cross-breed (from Ireland) reared in group-pen.
Feed, live and slaughtering performance
As previously reported, the calves of the farm A were born and fattened in the same farm and clearly their IA was 0 d. The calves of the others herds were introduced in the fattening farms at (IA ± standard deviation) 63.6 ± 35.5, 238.2 ± 30.3 and 354.3 ± 39.8 d of age for the farms B, C and D, respectively. Therefore, with the exception of the calves of farm A, at the reported age the animals had to be transported to reach the fattening farms. The distance approximately travelled by the animals was 50, 1000 and >1500 km for the farms B, C and D, respectively. At the beginning of the study, the recorded IW was 43.0 ± 2.1, 97.2 ± 30.8, 362.1 ± 36.7 and 429.8 ± 31.8 kg for the farm A, B, C and D, respectively. The SW was 604.6 ± 71.5, 647.0 ± 47.2, 695.0 ± 43.1 and 729.0 ± 72.5 kg and the SA was 456.1 ± 32.1, 537.7 ± 40.4, 428.3 ± 28.5 and 545.6 ± 40.1 d for the farm A, B, C and D, respectively. Consequently, for the same farms the rearing period was 456.1 ± 32.1, 487.8 ± 47.7, 220.7 ± 7.6 and 199.0 ± 0.0 d long respectively. Based on the recorded live performance, the calculated ADG was 1.2 ± 0.2, 1.1 ± 0.1, 1.5 ± 0.2 and 1.5 ± 0.4 kg d−1 for the farm A, B, C and D, respectively.
The diet composition for the fattening period of the selected farms, referring to the DM content, is shown in . The average feed consumptions, recorded for the fattening period and per group of animals, were 8.8, 8.1, 7.7 and 9.7 kg DM d−1 for the farm A, B, C, and D respectively. For the same farms, the calculated FCR was 7.3 ± 1.0, 7.1 ± 0.9, 5.4 ± 0.9 and 7.2 ± 2.6 kg kg−1 respectively.
The slaughtering performances showed a CW of 411.4 ± 51.8, 424.4 ± 31.0, 467.1 ± 29.3 and 477.2 ± 47.5 kg and a hot DP of 68.0 ± 1.4, 65.6 ± 1.5, 65.5 ± 0.6 and 67.2 ± 0.5% for the farm A, B, C and D, respectively.
Discussion
Different methods have been used till now to measure animal welfare. Animal welfare assessment must be reasonably free of observer bias, should highlight welfare issues and identify critical points in farm management that contribute to such problems. The RIBECA protocol herein adopted is based on both animal- and resource-based measurements (Gastaldo and Borciani Citation2014). A limit on farm welfare assessment protocols is to describe a current situation; for this reason, the welfare evaluation should include different approaches.
In the present research, the RIBECA protocol identified the critical points, the non-compliances and the potential improvement tools in regards to the facilities or management practices.
In the present study, the farm where the Piemontese beef cattle were tied (farm A) received the poorest total welfare score by RIBECA protocol, not because of the animal-based measures but how they were kept. The animal-based score was not significantly different among the farms since the animal health status was mediocre in all the farms and several animals showed ocular or nasal discharge and coughing. Keeping cattle in tie stall housing systems, as traditionally are the Piemontese breed cattle, contradicts the Council Directive 98/58/EC, since tie-stalls do not provide ‘freedom from discomfort by an appropriate environment’ nor ‘freedom to express normal behaviour by sufficient space’ nor ‘conditions and treatments which avoid mental suffering’ (Mattiello et al. Citation2005; Popescu et al. Citation2013). Solitary housing conditions are known to be psychological stressors for cattle (Rushen et al. Citation1999), and restricted space allowances may also increase acute plasma cortisol concentrations in bulls (Gupta et al. Citation2007). Previous studies reported that regular outdoor exercise, along with space allowance and pen design, have positive effects on fattening cattle health and welfare (SCAHAW Citation2001). Cozzi et al. (Citation2009) previously underlined that housing in groups led to better welfare than the tied stall system, since it allowed animal locomotion and social behaviours. On the contrary, the space allowances were guaranteed for each farm rearing animals in group-pen, respecting the values suggested by Cozzi et al (Citation2009).
The assessment of blood parameters can be a reliable tool to integrate these measurements. Therefore, in the current study, multiple measures of metabolism, inflammation, and steroid hormones were investigated.
Different physiological parameters are used as stress indicators in cattle such as the haematological profile, salivary cortisol (Negrao et al. Citation2004), acute-phase proteins (Alsemgeest et al. Citation1995; Lomborg et al. Citation2008; Valle et al. Citation2015) and d-ROMs. All these parameters are generally used for monitoring stress in both acute and chronic situations. In particular, d-ROMs test is used to assess the oxidative stress status and it is considered the ‘gold standard’ for evaluating free radical levels in vivo (Iamele et al. Citation2002). This assay measures the metabolites deriving from the reaction of free radicals with macromolecules present in the organism. These metabolites are more easy to quantify, due to the greater stability compared to the starting compounds (Wakabayashi et al. Citation2014). Markers of oxidative status are important because of their role in the pathways linking oxidation to pathological processes. The measure of d-ROMs, as a parameter for the assessment of animal welfare, is a motivated choice because any alterations in the value of d-ROMs is related to alterations in the immune response (Broom Citation1997; Vider et al. Citation2001) and to endocrine, metabolic and productive changes (Zecconi et al. Citation2003). The level of oxidative stress, assessed in several studies involving dairy cows, appears to be conditioned by individual predisposition, type of breeding and composition of the ration (Gabryszuk et al. Citation2013). Lower d-ROMs levels were detected in Blonde d’Aquitaine (Farm C) when compared to the other animals. On the contrary, tied Piemontese animals (Farm A) showed higher levels than the others. In the current study, tied Piemontese cattle also displayed significant alterations of protein metabolism as demonstrated by the significant changes in the plasma concentrations of albumin, total protein, and creatinine kinase when compared to the pen-reared animals.
Haematological variations in the populations of WBC (lymphocytes and neutrophils) in response to stressors have been measured in previous studies related to the immune system function as a modulator of the susceptibility to infections in bovine species (Burton et al. Citation2005). Neutrophils/heterophils are the primary phagocytic leukocytes and their number increase in response to infections, inflammation and stress (Jain Citation1993). Calamari et al. (Citation2004) also demonstrated that an N/L ratio greater than 1 can be considered a stress indicator. In the present study, crossbreed cattle showed the worst adaptability in terms of increased values of WBC, neutrophils and N/L ratio, along with higher total protein and lower creatinine than the other groups. On the contrary, Blonde d’Aquitaine cattle showed the best adaptability in terms of decreased N/L ratio and total protein values. Within the two groups of Piemontese cattle, the tied animals showed higher WBC, LYM, EOS, albumin and TG values than the pen-reared ones.
Another key parameter for stress evaluation is represented by the increase in plasma cortisol. However, the wide variability of serum cortisol concentrations due to circadian rhythms and handling made the development of other methods for detecting glucocorticoids metabolites excreted necessary. Measurements of faecal or salivary glucocorticoids metabolites are considered reliable and useful indicators of acute adrenal activity in cattle (Negrao et al. Citation2004; Comin et al. Citation2013). However, they are more indicative of acute stress rather than chronic. Hair cortisol analysis represents, instead, a useful and complementary method for monitoring stress, since it captures the systemic cortisol exposure over longer periods of time (Russel et al. Citation2012). Moreover, its detection offers several advantages, it is a non-invasive sampling and it is a procedure that causes very little disturbance to the animals (González-de-la-Vara et al. Citation2011). Differently, saliva, urine and blood sampling may modify cortisol endogenous production. Hair corticosteroid determination also reduces the influence of restraint and handling practices, thus reflecting the trend of long-term cortisol levels. Furthermore, it is not influenced by the circadian rhythm characterising the hormone secretion (Cristino et al. Citation2003; Moya et al. Citation2013; Novak et al. Citation2013). Finally, hair samples can easily and effectively be preserved. Considering all the above mentioned reasons, this alternative matrix may preserve the full exposure history of the animals and, due to its bioaccumulation, may allow a prolonged detectability of any exposure substances (Nielen et al. Citation2003). Hair samples analysis also reveals extremely low concentrations of cortisol, but significantly higher concentrations of its main direct metabolite, namely 20β-dihydrocortisol. Indeed, the excellent sensitivity of the analytical method towards 20β-dihydrocortisol made the latter a promising surrogate analyte of cortisol to measure stress. From an analytical point of view, the hyphenation of chromatographic and mass spectrometric instrumentation allow highly sensitive and simultaneous detection of cortisol and its metabolites.
With regards to tied Piemontese animals, the identification of higher 20β-dihydrocortisol values may suggest a potential effect of the housing system, as previously reported by Starvaggi Cucuzza (2014). Tarantola et al. (Citation2016), in the assessment of welfare of cows moving from a tied stall housing system to a free housing system, also observed that salivary cortisol levels were higher before the housing change, thus supporting the hypothesis that a tied stall housing system is a remarkable stress factor in adult cattle.
The concordance between haematochemical (blood tests and d-ROMs) and hair 20β-dihydrocortisol findings observed in the present study suggests that Blonde d’Aquitaine and Piemontese cattle reared in pens were less stressed during their livestock life, while the crossbreed and the Piemontese cattle reared in a tied stall housing system were more stressed as a consequence of housing and management conditions. The crossbreed were bought at 11 months, thus making the impact and adaptation to new breeding conditions more difficult. This assumption is sustained by the avoidance test, where the animals that are the most fearful of humans keep the greatest distance from them. Differently, animals which are the most confident might approach themselves, or allow a human to approach (de Passillé and Rushen Citation2005). In the present study, all these animals came from extensive farming and once locked up in a pen they became fearful and showed more avoidance than the others animals when a human approached them and tried to touch their head in the home pen. This result is also consistent with that derived from the total welfare score, which was ‘poor’ for tied stall housing system, ‘fair’ for Piemontese and crossbreed farms, and ‘very good’ for Blonde d’Aquitaine farm.
The excesses of dietary energy and protein concentration often occur in the beef cattle rearing and may represents an important stress factor. The differences recorded among the diets of the four farms and the different breed characteristics and nutritional requirements affected the recorded live performance, as ADG (ranged between 1.1 and 1.5 kg d−1) and FCR (ranged between 5.4 and 7.3 kg kg−1). In particular, the diet of the Farm D showed the highest energy concentration due to the high fat content, whereas the highest protein concentration was observed in the diet of the Farm C. The high level of readily fermentable organic matter was compensated with a satisfactory content of long fibre roughage. Indeed, wheat straw or other long fibre roughages were included in the diets of the selected farms. Despite the evidenced levels of energy and proteins, the diet seems well balanced and no metabolic problems were recorded. On the contrary, the slaughtering performance, particularly the dressing percentage could be mainly affected by the genetic characteristics of the animals, such as the presence of the hypertrophic character. This character was present in the selected tied Piemontese calves that showed the higher dressing percentage, less present in the less or no selected animals of the Farm B and D (this last containing also Belgian Blue crossbreds) and absent in the calves of the Farm C.
Conclusions
It is difficult to assess animal welfare due to the remarkable number of incomparable indicators. Only a global approach may help researchers and veterinarians to establish a proper assessment of beef cattle welfare. The results obtained in the present study suggest that the parallel use of both animal-based – integrated with the blood analyses – and resource-based measures appears to be preferable for beef cattle welfare assessment. Finally, measurement of 20β-dihydrocortisol in the hair matrix seems to be a valid diagnostic tool for monitoring the animal exposure to chronic stress.
Acknowledgements
The authors wish to thank ASPROCARNE Piemonte Sccrl, Carmagnola (To), Italy, for providing the farms and the farmers involved in this study for their precious collaboration.
Disclosure statement
No potential conflict of interest was reported by the author(s).
Additional information
Funding
References
- Alsemgeest SPM, Lambooy IE, Wierenga HK, Dieleman SJ, Meerkerk B, van Ederen AM, Niewold TA. 1995. Influence of physical stress on the plasma concentration of serum amyloid-A (SAA) and haptoglobin (Hp) in calves. Vet Quart. 17(1):9–12.
- Anderson BH, Watson DL, Colditz IG. 1999. The effect of dexamethasone on some immunological parameters in cattle. Vet Res Comm. 23(7):399–413.
- AOAC International. 2006. Official methods of analysis. 18th ed. Gaithesburg, MD: AOAC International.
- Bartussek H, Leeb CH, Held S. 2000. Animal Needs Index for Cattle “ANI 35 L/2000 – cattle. Irdning, Austria: Federal Research Institute for Agriculture in Alpine Regions, BAL Gumpenstein.
- Botreau R, Veissier I, Butterworth A, Bracke MBM, Keeling LJ. 2007. Definition of criteria for overall assessment of animal welfare. Anim Welf. 16:225–228.
- Broom DM. 1997. Welfare evaluation. Appl Anim Behav Sci. 54(1):21–23.
- Burton JL, Madsen SA, Chang L-C, Weber PSD, Buckham KR, van Dorp R, Hickey M-C, Earley B. 2005. Gene expression signatures in neutrophils exposed to glucocorticoids: a new paradigm to explain “neutrophil dysfunction” in parturient dairy cows. Vet Immunol Immunop. 105(3–4):197–219.
- Calamari L, Bionaz M, Trevisi E, Bertoni G. 2004. Preliminary study to validate a model of animal welfare assessment in dairy farms. In: De Tavernier J, Aerts S, editors. Proceedings of the 5th Congress EURSAFE Science, Ethics & Society. Leuven: Katholieke University Leuven; p. 38–42.
- Comin T, Peric M, Corazzin MC, Veronesi T, Meloni V, Zufferli G, Cornacchia A, Prandi A. 2013. Hair cortisol as a marker of hypothalamic–pituitary–adrenal axis activation in Friesian dairy cows clinically or physiologically compromised. Livest Sci. 152(1):36–41.
- Council Directive 98/58/EC concerning the protection of animals kept for farming purposes 2019. [accessed September 15]. https://eur-lex.europa.eu/legal-content/EN/TXT/?uri=celex:31998L0058
- Cozzi G, Brscic M, Gottardo F. 2009. Main critical factors affecting the welfare of beef cattle and veal calves raised under intensive rearing systems in Italy: a review. Ital J Anim Sci. 8(sup1):67–80.
- Cristino A, Ramos F, Noronha da Silveira MI. 2003. Control of the illegal use of clenbuterol in bovine production. J Pharmaceut Biomed. 32(2):311–316.
- de Passillé AM, Rushen J. 2005. Can we measure human animal interactions in on-farm animal welfare assessment? Some unresolved issues. Appl Anim Behav. 92:193–209.
- EFSA. 2012. Scientific Opinion on the welfare of cattle kept for beef production and the welfare in intensive calf farming system. EFSA J. 10:166.
- Gabryszuk M, Sakowski T, Metera E, Kuczynska B, Rembialkowska E. 2013. Wplyw zywienia na zawartosc skladnikov bioaktywnych w mleku krow z gospodarstw ekologicznych. Food Sci Tech – Brazil. 88:16–26.
- Gao W, Stalder T, Foley P, Rauh M, Deng H, Kirschbaum C. 2013. Quantitative analysis of steroid hormones in human hair using a column-switching LC–APCI–MS/MS assay. J Chromatogr B. 928:1–8.
- Gao W, Xie Q, Jin J, Qiao T, Wang H, Chen L, Deng H, Lu Z. 2010. HPLC-FLU detection of cortisol distribution in human hair. Clin Biochem. 43(7–8):677–682.
- Gastaldo A, Borciani M. 2014. Ribeca, per valutare il benessere dei bovini da carne. Informatore Zootecnico. 61:52–56.
- Gastaldo A, Borciani M, Ferrari P, de Roest K. 2013. RIBECA – an application of an innovative system of relief of animal welfare in beef cattle farms. Abstracts for Welfare Quality Network Workshop Lille, France.
- González-de-la-Vara MR, Valdez RA, Lemus-Ramirez V, Vázquez-Chagoyán JC, Villa-Godoy A, Romano MC. 2011. Effects of adrenocorticotropic hormone challenge and age on hair cortisol concentrations in dairy cattle. Can J Vet Res. 75(3):216–221.
- Gupta S, Earley B, Crowe MA. 2007. Pituitary, adrenal, immune and performance responses of mature Holstein × Friesian bulls housed on slatted floors at various space allowances. Vet J. 173(3):594–604.
- Iamele L, Fiocchi R, Vernocchi A. 2002. Evaluation of an automated spectrophotometric assay for reactive oxygen metabolites in serum. Clin Chem Lab Med. 40(7):673–676.
- INRA. 2007. Alimentation des bovins, ovins et caprins. Versailles, France: Éditions Quae.
- Jain NC. 1993. Essentials of veterinary hematology. Philadelphia, PA: Blackwell Publishing.
- Kirschbaum C, Tietze A, Skoluda N, Dettenborn L. 2009. Hair as a retrospective calendar of cortisol production—increased cortisol incorporation into hair in the third trimester of pregnancy. Psychoneuroendocrinology. 34(1):32–37.
- Lomborg SR, Nielsen LR, Heegaard MH, Jacobsen S. 2008. Acute phase proteins in cattle after exposure to complex stress. Vet Res Commun. 32(7):575–582.
- Manenschijn L, Koper JW, Lamberts SWJ, van Rossum E. 2011. Evaluation of a method to measure long term cortisol levels. Steroids. 76(10–11):1032–1036.
- Manenschijn L, Koper JW, van den Akker ELT, de Heide LJM, Geerdink EAM, de Jong FH, Feelders RA, van Rossum E. 2012. A novel tool in the diagnosis and follow-up of (cyclic) cushing’s syndrome: measurement of long-term cortisol in scalp hair. J Clin Endocr Metab. 97:1836–1843.
- Mattiello S, Arduino D, Tosi MV, Carenzi C. 2005. Survey on housing, management and welfare on dairy cattle in tie stalls in western Italian Alps. Acta Agric Scand A Anim Sci. 55:31–39.
- Mirzad AN, Tada T, Ano H, Kobayashi I, Yamauchi T, Katamoto H. 2018. Seasonal changes in serum oxidative stress biomarkers in dairy and beef cows in a daytime grazing system. J Vet Med Sci. 80(1):20–27.
- Moya D, Schwartzkopf-Genswein KS, Veira DM. 2013. Standardization of a non-invasive methodology to measure cortisol in hair of beef cattle. Livest Sci. 158(1–3):138–144.
- Negrao JA, Porcionato MA, de Passille AM, Rushen J. 2004. Cortisol in saliva and plasma of cattle after ACTH administration and milking. J Dairy Sci. 87:1713–1718.
- Nielen MWF, Hooijerink H, Essers ML, Lasaroms JJP, van Bennekom EO, Brouwer L. 2003. Value of alternative sample matrices in residue analysis for stanozolol. Anal Chim Acta. 483(1–2):11–17.
- Noppe G, de Rijke YB, Dorst K, van den Akker ELT, van Rossum E. 2015. LC-MS/MS-based method for long-term steroid profiling in human scalp hair. Clin Endocrinol. 83(2):162–166.
- Novak MA, Hamel AF, Kelly BJ, Dettmer AM, Meyer JS. 2013. Stress, the HPA axis, and nonhuman primate well-being: a review. Appl Anim Behav Sci. 143(2–4):135–149.
- Popescu S, Borda C, Diugan EA, Spinu M, Groza IS, Sandru CD. 2013. Dairy cows welfare quality in tie-stall housing system with or without access to exercise. Acta Vet Scand. 55(1):43.
- Rushen J, Boissy A, Terlouw EMC, de Passillé A. 1999. Opioid peptides and behavioral and physiological responses of dairy cows to social isolation in unfamiliar surroundings. J Anim Sci. 77(11):2918–2924.
- Russel E, Koren G, Rieder M, Van Uum S. 2012. Hair cortisol as a biological marker of chronic stress: current status, future directions and unanswered questions. Psychoneuroendocrinology. 37:589–601.
- Sauvé B, Koren G, Walsh G, Tokmakejian S, Van Uum S. 2007. Measurement of cortisol in human hair as a biomarker of systemic exposure. CIM. 30(5):183.
- SCAHAW 2001. The welfare of cattle kept for beef production. Scientific Committee on Animal Health and Animal Welfare; [accessed 2019 July 12]. https://ec.europa.eu/food/sites/food/files/safety/docs/sci-com_scah_out54_en.pdf.
- Starvaggi Cucuzza L, Riondato F, Macchi E, Bellino C, Franco G, Biolatti B, Cannizzo FT. 2014. Haematological and physiological responses of Piemontese beef cattle to different housing conditions. Res Vet Sci. 97(2):464–469.
- Tarantola M, Valle E, De Marco M, Bergagna S, Dezzutto D, Gennero MS, Bergero D, Schiavone A, Prola L. 2016. Effects of abrupt housing changes on the welfare of Piedmontese cows. Ital J Anim Sci. 15(1):103–109.
- Thomson S, Koren G, Fraser LA, Rieder M, Friedman TC, Van Uum S. 2009. Hair analysis provides a historical record of cortisol levels in Cushing’s syndrome. Exp Clin Endocrinol Diabetes. 118(02):133–138.
- Valle E, Zanatta R, Odetti P, Traverso N, Furfaro A, Bergero D, Badino P, Girardi C, Miniscalco B, Bergagna S, et al. 2015. Effects of competition on acute phase proteins and lymphocyte subpopulations – oxidative stress markers in eventing horses. J Anim Physiol Anim Nutr. 99(5):856–863.
- Vider J, Lehtmaa J, Kullisaar T, Vihalemm T, Zilmer K, Kairane Č, Landõr A, Karu T, Zilmer M. 2001. Acute immune response in respect to exercise-induced oxidative stress. Pathophysiology. 7(4):263–270.
- Wakabayashi T, Kawashima T, Matsuzawa Y. 2014. Evaluation of reactive oxygen metabolites in patients with non-small cell lung cancer after chemotherapy. Multidiscip Respir Med. 9(1):44.
- Webster J. 2012. Critical control points in the delivery of improved animal welfare. Anim Welf. 21(1):117–123.
- Welfare Quality® 2009. Welfare Quality® assessment protocol for cattle. Lelystad, Netherlands: Welfare Quality® Consortium.
- Zecconi A, Piccinini R, Stefanon B, Testoni S, Gabai G. 2003. Relationship between blood metabolic and endocrine parameters and blood and milk immune parameters in dairy heifers. Milchwissenschaft. 58:242–245.