
Abstract
Previously, we found there were significant differences in the development of skeletal muscle, myofiber characteristics between Chinese pig breed Dapulian and Landrace. Furthermore, the development of skeletal muscle is related to the proliferation of satellite cells (SCs). Thus, our aim was to compare the differences of proliferative abilities and expression of key genes related to proliferation between the SCs isolated from Dapulian and Landrace in this study. We isolated skeletal muscle SCs with collagenase digestion from the longissimus dorsi muscles of 1-day-old male Dapulian and Landrace piglets. After successful culture of SCs in vitro, proliferative capacity was estimated at different time points. Meanwhile, the expression of key genes related to SCs proliferation was detected by qRT-PCR and western blotting. Proliferation results showed a significantly greater number of viable SCs from Dapulian pigs compared to that from Landrace pigs at 72–120 h of culture (p < .05). The mRNA expression of MYOD, MYF5 and MYOG in SCs from Dapulian pigs was higher (p < .05) compared with Landrace pigs. Whereas the mRNA levels of MSTN, MTOR, S6K, EIF4E and 4EBP1 were significantly lower in SCs from Dapulian than those from Landrace (p < .05). Protein levels of MSTN, S6K, MTOR and EIF4E were consistent with corresponding mRNA expression. In summary, these findings indicated that SCs isolated from the two breeds exhibit different proliferative capacities, and the proliferative potential of SCs from Dapulian pigs was greater than those from Landrace pigs.
There were significant differences in the development of skeletal muscle, myofibre number and myofibre size between Chinese indigenous pig breed Dapulian and commercial pig breed Landrace.
The proliferative capacity of satellite cells (SCs) from Dapulian pigs was greater than that from Landrace pigs.
The expression of key genes related to proliferation between the SCs isolated from Dapulian and Landrace was different.
Highlights
Introduction
Growth rate and muscularity are economically important for pig breeding. The development of skeletal muscle depends on the number and size of muscle fibres (Paredes et al. Citation2013). Muscle fibre hypertrophy is accompanied by the proliferation of satellite cells (SCs), which are the source of new nuclei that are incorporated into muscle fibres during postnatal skeletal muscle growth (Wang et al. Citation2012). Furthermore, skeletal muscle growth and regeneration depend on the activation of SCs, which leads to myocyte proliferation, differentiation and fusion with existing muscle fibres. Skeletal muscle cell proliferation and differentiation are tightly coordinated by a continuum of molecular signalling pathways (Wallace et al. Citation2016). Myogenic regulatory factors (MRFs), which belong to a family of basic helix-loop-helix (bHLH) transcription factors could initiate the formation of muscle fibres and regulate the transcription of muscle-specific genes (Ropka-Molik et al. Citation2011; Jin et al. Citation2016). MRF family members include myogenic differentiation 1 (MYOD), myogenic regulatory factor 5 (MYF5) and myogenic factor 4 (MYOG) (Denis Guiatti et al. Citation2013;; Hernandez-Hernandez et al. Citation2017). MYOD regulates the differentiation of activated muscle SCs (Collins et al. Citation2009). Differentiation factor 8 (GDF-8, MSTN), a member of the transforming growth factor-beta (TGF-beta) superfamily and a negative regulator of muscle growth, inhibits myoblast proliferation (Thomas et al. Citation2000; Dayton and White Citation2008).
Mechanistic target of rapamycin kinase (mTOR) has been shown to regulate a wide range of cellular processes including protein translation, cell proliferation, apoptosis and autophagy (Zhang et al. Citation2015). Furthermore, MTOR controls mammalian cell size and cell cycle progression via its downstream targets ribosomal protein S6 kinase beta-1 (S6K), eukaryotic translation initiation factor 4E binding protein 1 (4EBP1), and eukaryotic translation initiation factor 4E (EIF4E) (Iadevaia et al. Citation2014; Zhang et al. Citation2015).
The objective of our study was to assess expression of MYOD, MYF5, MYOG, MSTN and genes of the mTOR signalling pathway associated with cell proliferation in SCs isolated from Dapulian and Landrace pigs to test the assumption that the SCs from different breeds have diverse proliferative ability.
Different breeds and lines of pigs have predetermined propensities regarding certain characteristics such as carcase composition and meat quality (Yuanyuan Zhao et al. Citation2015; Chen et al. Citation2018), which are associated with SCs proliferation and differentiation (Fonseca et al. Citation2014; Lebret et al. Citation2015). Dapulian pigs are native to Northern China and are characterised by better meat quality and disease resistance compared with Landrace pigs. In addition, the myofibers of Dapulian pigs have a higher density and smaller cross-sectional area compared with Landrace pigs. The self-renewing proliferation of SCs provides numerous myogenic cells, which proliferate, differentiate, fuse, and lead to new myofibre formation and reconstitution of a functional contractile apparatus (Yin et al. Citation2013). Therefore, different muscle characteristics might be related to properties of skeletal muscle SCs, such as proliferation and differentiation. Wang et al. (Citation2012) found that the proliferative potential of SCs in Lantang pigs, a native breed of southern China, is higher than in Landrace pigs. At present, little is known about the different proliferative ability of SCs isolated from native breed of northern China and commercial pig breeds. Meanwhile, the expression level of key genes related to proliferation between the two breeds is still unknown. Thus, this study was conducted with SCs isolated from Dapulian and Landrace pigs to test the hypothesis that muscle fibres of different pig breeds have different proliferative capacity during the neonatal stage.
Materials and methods
Animal care
The whole procedure for experimental animals was performed in strict accordance with guideline (IACC20060101, 1 January 2006) of the Institutional Animal Care and Use Committee of Institute of Animal Science and Veterinary Medicine, Shandong Academy of Agricultural Sciences (Jinan, Shandong, China).
Sampling collection
Three 1-day-old male Dapulian piglets (birth weight: 1.03 ± 0.05 kg) and three 1-day-old male Landrace piglets (birth weight: 1.30 ± 0.02 kg) were obtained from the Conservation Farm of Dapulian pigs of Jining in Shandong Province of China. The piglets were sacrificed by lethal injection of sodium pentobarbital. Longissimus dorsi (LD muscle) of Dapulian and Landrace pigs were sampled. The LD muscle of each pig was immediately divided into two parts: one part was used to isolate SCs and test their proliferative capacity and expression of genes associated with SCs proliferation, and the other part was used to analyse morphology and measure the cross-sectional area, diameter and number of muscle fibres. The LD muscles used to analyse the cross-sectional area and number of muscle fibres were fixed with 4% formaldehyde (Serviceebio, Wuhan Serviceebio Technology Co. LTD, Beijing, China). The LD muscles used to analyse the diameter of muscle fibres were placed in 20% nitric acid for 24 h, then cut to 1 mm and dispersed in glycerol.
Morphologic analysis of muscles
The LD muscle samples were cross-sectioned to a thickness of 10 µm. For haematoxylin–eosin staining, the sections were rinsed with PBS and stained in haematoxylin for 40 min. Then, the sections were rinsed with running tap water and stained in eosin for 10 min. All samples were examined with the Image Pro-plus 6.0 system (Media Cybernetics, Rockville, MD). The system consisted of an optical microscope and a standard workstation computer that controlled image analysis. Fibre cross-sectional area (CSA) data were obtained from the slices, and fibre number counts were performed across five separate fields of view for at least three slices per muscle sample. Fibre diameter was measured according to the Determination Method of Pig Skeletal Muscle Fibre Diameter: nitrofication process (DB 37/T 2472) (Institute of Animal Husbandry and Veterinary Medicine Citation2014).
Isolation and characterisation of SCs
The LD muscle samples were collected (Li et al. Citation2015), and the method used for isolating SCs was as previously described (Zhu et al. Citation2013; Gao et al. Citation2017). Briefly, we obtained LD muscle tissue from 1-day-old Dapulian and Landrace pigs with enzyme digestion using 0.2% collagenase Type II (Sigma, St. Louis, MO) for 2 h to release the SCs. Subsequently, the pig SCs were purified using the differential adhesion method described previously (Zhu et al. Citation2013). Cells were cultured in a growth medium (GM) consisting of Dulbecco’s modified Eagle’s medium (DMEM) supplemented with 10% (v/v) foetal bovine serum (FBS) and antibiotics (100 U/mL penicillin and 100 µg/mL streptomycin) in 5% carbon dioxide (CO2) at 37 °C. Cell culture flasks and plates were obtained from Corning (Corning, NY).
Paired box protein 7 (PAX7) is a highly conserved transcription factor for the maintenance and proliferation of satellite cells (Seale et al. Citation2000; Ding et al. Citation2017). PAX7 specifically expressed in SCs and is required for the specification of myogenic satellite cells (Seale et al. Citation2000). Hence, immunofluorescence staining was used to identify SCs purity based on PAX7 staining as previously described (Wang et al. Citation2012). The cells were seeded at a density of 2 × 10³ cells/cm2 into 96-well plates, rinsed with DMEM/F12 and fixed with 4% paraformaldehyde for 1 h, and then incubated with a rabbit monoclonal antibody against PAX7 (R&D Systems, Minneapolis, MN) diluted in blocking buffer at 4 °C overnight. Next, the slides were incubated with secondary antibodies (Abcam, Cambridge, UK) and DAPI (Beyotime, Shanghai, China) for 50 min at room temperature. Fluorescent images were obtained using an OLYMPUS BX51 fluorescent microscope (Olympus, Tokyo, Japan). Three slides for each pig were used for immunofluorescence staining in order to count the number of PAX7-positive cells over all isolated cells.
Proliferation analysis
Cell count assays
After one passage, the SCs from three Dapulian and three Landrace were used for cell count assays. The cells were cultured in six 6-well plate at a density of 2 × 10⁴ cells/cm2 in GM. After cultured for 24, 48, 72, 96, 120 and 144 h, the cell number of SCs isolated from each pig was counted with two technical replications at the six time points. The adherent SCs were digested with 0.25% trypsin, then centrifuged at 2000 rpm for 5 min, and supernatant was discarded. To resuspend the cells, 1 mL DMEM was added. Then 0.4% trypan blue was added to the cell suspension. Finally, the number of viable SCs was counted using a haemocytometer under a light microscope.
CCK-8 assays
Cells were cultured in 96-well plate at a density of 2 × 10⁴ cells/cm2 in GM at 100 µL per well. Ten microliters of CCK-8 (Enhanced Cell Counting Kit-8, Beyotime, Beijing, China) solution were added to each well after culture for 24, 48, 72, 96, 120 and 144 h. Cells were then incubated for 3 h, and the OD of every well was evaluated using an ELISA reader at a wavelength of 450 nm. At least three independent experiments from different piglets (three Dapulian and three Landrace pigs) were performed to examine SCs proliferation.
RNA isolation and reverse transcription (RT)
Total RNA was isolated from SCs cells cultured for 72, 96 and 120 h using RNAiso Plus reagents (TaKaRa, Dalian, China). The quality and quantity of RNA was examined by NanoDrop 2000 spectrophotometer (Thermo Fisher Scientific, Waltham, MA) and 2% gel electrophoresis. Reverse transcription was performed on 1 μg of total RNA using the PrimeScriptTM RT reagent kit with gDNA Eraser (RR047A, TaKaRa, Dalian, China). In brief, gDNA Eraser was firstly used to remove possible residual DNA from the total RNA. The reaction mixture (10 µL) containing 2.0 µL gDNA Eraser buffer, 1.0 µL gDNA Eraser, 4 µL total RNA (about 1 μg) and 3 µL RNase Free ddH2O were incubated for 2 min at 42 °C. Then the product was added to the mixture of PrimeScript buffer 4.0 µL, PrimeScript RT Enzyme Mix I 1.0 µL, RT Primer Mix 1.0 µL and RNase Free ddH2O 4.0 µL. The reaction conditions were as follows: 37 °C for 15 min and 85 °C for 5 S.
Quantitative real-time PCR
The amount of mRNA for MYOD, MYF5, MYOG, MSTN, MTOR, EIF4E, 4EBP1, S6K and ten reference genes was evaluated on Roche LightCycler® 480 II Real-Time PCR System (Roche, Switzerland, Basel). Quantitative real-time PCR (qRT-PCR) using cDNA was performed using one-step LightCycler® 480 SYBR Green I Master (Roche, Switzerland, Basel). The cDNA was diluted 4-fold before using in qPCR. qPCR was performed in triplicate for each sample using 96 well plate. The reaction mixture (20 µL) contained 10 μL Blue-SYBR-Green mix, 1 µL of each forward and reverse primer (10 μM/μL), 1 μL cDNA, and 7 μL distilled water. The PCR programme consisted of a pre-denaturation step at 95 °C for 5 min, followed by 40 cycles at 95 °C for 10 s (denaturation) and 60 °C for 20 s (annealing and extension). The melting curve was performed at 95 °C for 5 s (denaturation), 65 °C for 60 s (annealing), and 97 °C for 10 s (melting). The CT values of the reference and target genes were quantified using the Roche LightCycler® 480 (Roche, Switzerland, Basel).
Primers sequences for MYF5, MSTN, MYOD, MYOG, PAX7, 4EBP1, EIF4E, S6K, MTOR, peptidylprolyl isomerase A (PPIA), glyceraldehyde-3-phosphate dehydrogenase (GAPDH), ribosomal protein L4 (RPL4), DNA topoisomerase II beta (TOP2B), actin beta (ACTB), tryptophan 5-monooxygenase activation protein zeta (YWHAZ), succinate dehydrogenase complex flavoprotein subunit A (SDHA), TATA-box binding protein (TBP), hypoxanthine phosphoribosyl transferase 1 (HPRT1), beta-2-microglobulin (B2M) used for qPCR are listed in Table (Gu et al. Citation2011; Li et al. Citation2011; Martino et al. Citation2011; Uddin et al. Citation2011; Cinar et al. Citation2012; McCulloch et al. Citation2012; Nygard et al., Citation2007; Wang et al. Citation2012; Park et al. Citation2015). qRT-PCR data of target genes were normalised to the geometrical mean of two genes, which are stable and appropriate references among the 10 well-known candidate reference genes ascertained by the geNorm programme. Normalisation of mRNA levels was performed by the comparative ΔCt method. The relative mRNA expression of target genes was calculated as 2−ΔCt (where ΔCt = Ct of the target gene − Ct of the reference gene) (Schmittgen and Livak Citation2008), Ct of the reference gene is the geometric mean of Ct values of two reference genes (Vandesompele et al. Citation2002; Cinar et al. Citation2012).
Table 1. Primer sequences used for quantitative real-time PCR analysis.
Western blot assay
Protein expression of MSTN, MTOR, EIF4E, and S6K was determined by western blotting, as previously described (Taylor et al. Citation2013). SCs, culturing in T25 flasks at a density of 2 × 10⁴ cells/cm2, were collected for protein extraction using lysis buffer (Beyotime, Beijing, China). Protein concentrations were determined using the BCA Protein Assay Kit (TaKaRa, Dalian, China). Samples were analysed by sodium dodecyl sulphate-polyacrylamide gel electrophoresis (SDS-PAGE). Separated proteins were then transferred to polyvinylidene fluoride (PVDF) membranes using the Trans-Blot® Turbo™ Transfer System (Bio-Rad, Hercules, CA), then blocked in 10% non-fat milk (Bio-Rad, Hercules, CA) in phosphate-buffered saline (PBS) containing 0.05% tween-20 (PBST) and incubated at room temperature for 1 h. The membranes were probed with primary antibodies against MSTN (Santa Cruz, CA, UC), MTOR (Epitomics, Burlingame, CA), EIF4E (Epitomics), S6K (Abcam, Cambridge, UK), and GAPDH (Abcam, Cambridge, UK) at 4 °C overnight. After washed three times in PBST, the PVDF membranes were incubated with horseradish peroxidase (HRP)-conjugated secondary antibodies (Abcam, Cambridge, UK) at room temperature for 1 h, and were washed again in PBST three times. Signals were captured and measured using the Molecular Imager® ChemiDocTMXRS + systems with Image LabTM software (Bio-Rad, Hercules, CA).
Statistical analysis
The data were analysed using analysis of variance (ANOVA) and two-tailed Student’ t-test of SPSS software 19.0 for Windows (SPSS, Chicago, IL). One-way ANOVA was applied to evaluate differences of LD muscle morphology, proliferative capacity of SCs and protein expression of SCs cultured for 72 h between Dapulian and Landrace pigs. Two-way ANOVA was used to evaluate differences of gene mRNA expression of SCs cultured for 72, 96 and 120 h between Dapulian and Landrace pigs. Data were reported as means ± SEM. For all these tests, a p < .05 was considered statistically significant.
Results
Morphology of muscle tissues
Fibre diameter, cross-sectional area (CSA), and fibre numbers of longissimus dorsi (LD muscle) in Dapulian and Landrace pigs were examined using frozen muscle sections. Histologic examination of muscle cross sections revealed that, compared with Landrace pigs, LD muscle from Dapulian pigs exhibited significantly lower fibre diameter (6.66 versus 12.07, p < .01) and CSA (269.89 versus 472.47, p < .01), and significantly greater fibre numbers (372.22 versus 214.29, p < .01) (Figure , Table ). These findings demonstrated there were significant difference in fibre diameter, CSA, and fibre number between Dapulian and Landrace pigs. The results suggested that the proliferation capacity of SCs isolated from 1-day-old Dapulian and Landrace pigs would be different.
Figure 1. Fibre cross-sectional areas of LD muscle (longissimus dorsi) from Dapulian (A) and Landrace (B) pigs after staining with haematoxylin–eosin for histological examination.
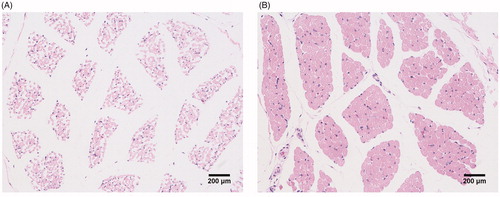
Table 2. Muscle fibre cross-sectional areas and diameters of Dapulian and Landrace pigs.
Identification of SCs
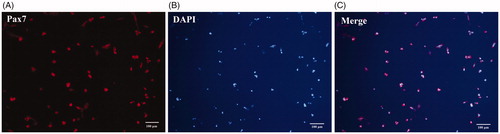
Immunofluorescence analysis showed that the isolated SCs were positive for PAX7, which was expressed only in the nucleus (Figure ). Meanwhile, the average proportion of PAX7+ cells in isolated cell from Dapulian and Landrace pigs were 95.79 ± 1.19% and 96.01 ± 1.01%, respectively. It suggested that the method of isolation of SCs was effective and the isolation effect did not vary by pig breeds.
Figure 2. Identification of LD muscle (longissimus dorsi) satellite cells (SCs) by immunofluorescence staining. LD muscle SCs immunolabel with anti-mouse paired box protein (PAX7) monoclonal antibody. PAX7 immunostaining is depicted in red. Nuclei are stained with DAPI (blue).
Difference in proliferation potential of SCs
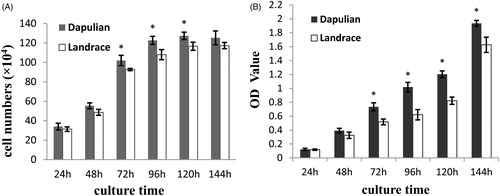
Based on fibre morphologic analysis, the number of viable SCs cells isolated from Dapulian and Landrace pigs was measured by cell count analysis and CCK-8 analysis. At the different time points analysed separately, the number of Dapulian SCs was more than that of Landrace pigs by cell count analysis (Figure ). Counting the number of viable SCs cultured for 24 h, 48 h and 144 h, no significant differences were found between Dapulian and Landrace pigs (p > .05, Figure ). However, compared to those from Landrace pigs, the number of viable cells isolated from Dapulian pigs increased significantly by 10.07%, 13.58% and 9.14% at 72 h, 96 h and 120 h of culture, respectively (p < .05, Figure ). The results of cell count analysis were consistent with those of CCK-8 analysis. Further, the number of viable cells in Dapulian pigs increased significantly faster compared to that in Landrace pigs after 48 h (p < .05, Figure ). The results of cell count analysis and CCK-8 analysis suggested that SCs proliferation capacity of Dapulian pigs was higher than that of Landrace pigs. The findings were consistent with the results of morphology of muscle tissues.
Figure 3. Proliferation of LD muscle (longissimus dorsi) satellite cells (SCs) from Dapulian and Landrace pigs. LD muscle SCs from Dapulian and Landrace pigs were cultured in DMEM/F12 medium supplement with 10% FBS. Viable cell numbers were tested by performing counts (A) and CCK-8 assay (B) at 24, 48, 72, 96, 120, and 144 h of culture. Bars indicat the means ± SEM (n = 4). *represents significant difference (p < .05) by two-tailed Student’ t-test (n = 4).
RNA quality and integrity
RNA quality and integrity were controlled to prove the suitability of the sample material for RT-qPCR. After extraction using RNAiso Plus reagents, the OD260/280 ratios of RNA measured with Nanodrop spectrophotometer were 1.96 ± 0.19 (OD260/A280 ratio ± SD). The average RNA concentration was 152.41 ng/μL ± 8.12 (ng/μL ± SD). The RNA integrity detected by 2% gel electrophoresis showed that the 28S RNA and 18S RNA bands were clear, and the brightness of 28 S bands was brighter than 18 S (Supplementary Figure S1). Our results indicated that all the RNA samples were good in quantity and quality and suitable for the next analysis.
Selection of the most stable reference gene
Selection of candidate reference genes
To select suitable reference genes for the SCs isolated from LD muscle of two pig breeds, we chose 10 candidate reference genes based on previous studies. These genes with different functional classes were used to minimise the risk of coregulation. On the basis of these criteria, genes, PPIA, GAPDH, RPL4, TOP2B, ACTB, YWHAZ, SDHA, TBP, HPRT1, B2M were employed as candidate reference genes (Table ) (Gu et al. Citation2011; Li et al. Citation2011; Martino et al. Citation2011; Uddin et al. Citation2011; Cinar et al. Citation2012; McCulloch et al. Citation2012; Park et al. Citation2015).
Expression stability of candidate reference genes using geNorm
For the 10 candidate reference genes, the stability values (M value), which is the mean pair-wise variation between an individual gene and all other tested control genes, were calculated using the geNorm programme (Supplementary Figure S2). PPIA and GAPDH were identified as the two most stable genes, with low M-values of 0.20, respectively. The most stable genes following PPIA and GAPDH were YWHAZ (0.24), TBP (0.30), SDHA (0.39), ACTB (0.46), HPRT1 (0.54), TOP2B (0.61), RPL4 (0.69) and B2M (0.75) (Supplementary Figure S2(A)).
As the suggestion of the geNorm, the use of a minimal number of the most stable reference genes is recommended for the calculation of the normalisation factor (NF) (Vandesompele et al. Citation2002). Therefore, we used the two most stable internal control genes with the lowest M values for calculating the RT-PCR NF (NFn, n = 2). Then, by the calculation of pairwise variations for every series of NFn and NFn+1, the effect of adding the next reference gene was reflected. The geNorm programme proposed 0.15 as the cut-off value, which suggests that additional reference genes would be unnecessary if the V value was below 0.15 (Vandesompele et al. Citation2002; Tong et al. Citation2009; Wan et al. Citation2010). Supplementary Figure S2(B) illustrated that all the V values were below 0.15, and the first pair-wise variation V2/3 was 0.079. The results suggested that two reference genes were sufficient for reliable normalisation and the inclusion of an additional reference gene was not required. Therefore, qPCR data of target genes were normalised by the geometrical mean of PPIA and GAPDH, which are stable and appropriate references among 10 well-known candidate reference genes.
Gene expression levels in SCs
Based on the differences in the morphology and SCs proliferative ability between Dapulian and Landrace pigs, mRNA expression levels of the MYF5, MSTN, MYOD, MYOG, PAX7, and key genes in the MTOR pathway were tested in SCs cultured for 72, 96 and 120 h. The results showed that expression of MYF5, MYOD, MYOG and PAX7 in SCs from Dapulian pig cultured for 96 and 120 h were higher than those from Landrace pigs (2.16-, 3.96-, 9.79- and 1.97-fold at 72 h; 5.20-, 2.56-, 2.57- and 3.07-fold at 96 h; 8.28-, 4.99-, 3.42- and 1.96-fold at 120 h, respectively; Table ). However, mRNA levels of MSTN, 4EBP1, EIF4E, S6K, and MTOR in SCs from Dapulian pig cultured for 72, 96 and 120 h were lower than those from Landrace pig SCs (14.08-, 5.92-, 2.65-, 1.85- and 5.89-fold at 72 h; 10.74- 4.73-, 2.22-, 1.72- and 12.86-fold at 96 h; 6.79-, 4.09-, 2.29-, 2.11- and 13.27-fold at 120 h, respectively; Table ).
Table 3. mRNA expression levels of genes related to proliferation in satellite cells isolated from Dapulian and Landrace pigs.
Protein expression levels of MSTN and mTOR pathway genes in SCs cultured for 72 h
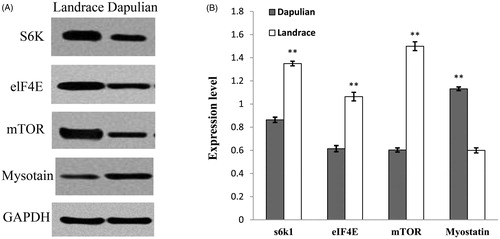
To further study the SCs proliferation, western blot was also performed to analyse the expression of MSTN and mTOR pathway genes in SCs cultured for 72 h. Results showed that protein level of MSTN was significantly higher (1.89-fold; p < .01) in SCs from Landrace pigs than those from Dapulian pigs (Figure ). Compared to Dapulian pigs, MTOR, EIF4E, and S6K protein levels were also significantly higher (2.49-, 1.73- and 1.56-fold, respectively) in SCs isolated from Landrace pigs (Figure ). Protein levels of MSTN, S6K, MTOR and EIF4E were consistent with corresponding mRNA expression levels.
Figure 4. Western blot analysis of LD muscle (longissimus dorsi) satellite cells (SCs) for MSTN, p-MTOR, p-EIF4E, and S6K expression at 72 h of culture. The density of bands was analysed using Image Analysis Software (Tanon, China). The results are representative of five separate experiments. Bars indicate the means ± SEM. **represents significant difference (p < .01) by two-tailed Student’ t-test (n = 4).
Discussion
Myofiber characteristics of muscle tissue
Meat quality is closely related to the histological characteristics of muscle fibre (Lazzaroni and Pagano Citation2003; Chen et al. Citation2018). Postnatal muscle fibre hypertrophy is correlated with the number of prenatally formed muscle fibres (Wang et al. Citation2012). Muscle fibre numbers are fixed before birth and fibre formation ceases at approximately 85–90 days of gestation. However, the diameter of muscle fibre increases with the growth and development (Kyu-Sang Lim et al. Citation2009). Skeletal muscle growth and regeneration in postnatal animals largely depend on the activation of SCs. SCs become the source of nuclei that contribute to the growth of muscle fibres, and are a prerequisite for muscle hypertrophy, which occurs during normal growth (Zhu et al. Citation2013).
In this study, we compared the differences in fibre number, CSA, and diameter of LD muscle between Dapulian and Landrace pigs. Dapulian, an indigenous pig breed distributed in Shandong province of China, is famous for its meat quality. Based on morphologic analyses, LD fibre numbers in Dapulian pigs were significantly higher, whereas CSA and fibre diameter of LD muscle in Dapulian pigs were significantly lower compared to those in Landrace pigs (Figure ). Our data were consistent with the study of Wang et al. (Citation2012) The study showed that fibre numbers of LD muscle, semitendinosus, and semimembranosus muscles in Lantang pigs, native to Southern China, increased, whereas CSA and fibre diameter decreased, compared to those in Landrace pigs. Previous studies indicated that muscle fibre numbers, fibre diameter, and CSA significantly affected meat quality. Muscle fibre characteristic was considered as one of the important factors that affected meat quality (Essen-Gustavsson et al. Citation1992). Hence, the differences of muscle fibre characteristic between Dapulian and Landrace may cause the meat quality differences. Further, as the importance of SCs for muscle development, we speculated that the differences of muscle fibre characteristic between two breeds might be related to the SCs proliferative ability differences.
Proliferation potential of skeletal muscle SCs
To detect the differences of SCs proliferation between Dapulian and Landrace pigs, an in vitro pig muscle SC culture system was used. In this system, proliferative ability of SCs isolated from the LD muscle in Dapulian and Landrace pigs was measured by the number of viable cells cultured for 24–144 h. Although not all time points showed significant differences, we found that SCs proliferation in Dapulian and Landrace pigs had an overall trend of difference. Especially, the number of viable SCs cells, culturing for 72–120 h, was significantly higher in Dapulian pigs than that in Landrace pigs at 72–120 h (Figure ). This suggested that the SCs proliferation rate of Landrace was slower than that of Dapulian. Similar results were observed in SCs isolated from LD muscle of Lantang and Landrace pigs (Wang et al. Citation2012). The SCs cells isolated from the two breeds showed different rate of proliferation. SCs from Lantang pigs have higher proliferative capacity compared with that from Landrace pig after cultured for 24–144 h. Especially, the proliferative capacity was significantly different when the cells were cultured for 72 h (Wang et al. Citation2012). The Dapulian and Lantang pigs are both Chinese indigenous pigs, deriving from northern and southern of China, respectively.
When SCs are isolated and cultured in vitro under the same culture conditions, differences in SCs proliferation capacity, as found in this study, must be due to different SC characteristics between breeds (Ribeiro et al. Citation2019). From the aspect of genetic, the SC characteristics were regulated by some key genes. Hence, to expound the difference of proliferation between the two breeds, the expression of key genes associated with SCs proliferation was explored.
Expression of key genes associated with SCs proliferation
Our data showed that mRNA levels of MYF5, MYOD and MYOG in SCs isolated from Dapulian pigs were significantly higher, but the expression of MSTN was significantly lower, compared to that from Landrace pigs (Table ). Furthermore, at the protein level, MSTN in SCs isolated from Dapulian pig was significantly lower (Figure ). Protein and transcript levels of MSTN were consistent. Previous studies found that the myogenic regulatory factors, MYF5, MYOD and MYOG could be used as indicators of muscle development (Zammit Citation2017; Asfour et al. Citation2018). MYOD, regulating the differentiation of the muscle, and together with PAX7 are co-expressed in activated SCs (Collins et al. Citation2009). MSTN is a member of transforming growth factor superfamily and is known as an inhibitor of skeletal muscle cell proliferation and differentiation that negatively regulates skeletal muscle mass (Yang et al. Citation2007; Trendelenburg et al. Citation2009). Our data were similar to the results of previous studies. Specifically, high expression of MYF5, MYOG and MYOD was found in SCs from Dapulian pigs which had higher proliferative capacity. Meanwhile, we found that the expression of MSTN (at the mRNA and protein level) in SCs from Dapulian pigs was lower than that from Landrace pigs. This suggested that lower expression of MSTN and higher expression of MYF5, MYOD, and MYOG in SCs from Dapulian might have could affect the proliferation of SCs.
MSTN regulates skeletal muscle mass by negatively regulating MTOR signalling (Amirouche et al. Citation2009). We found that mRNA levels of MTOR, EIF4E, S6K, and 4EBP1, which are key genes in MTOR signalling pathway, were significantly higher in SCs isolated from Landrace pigs than those from Dapulian pigs (Table ). Moreover, the protein levels of S6K, MTOR and EIF4E in SCs from Landrace and Dapulian pigs were consistent with that of mRNA level (Table and Figure ). The results were found in good accordance with previous studies. Welle (Citation2009) indicated that normal MSTN activity in mature muscle is sufficient to inhibit the myofibrillar synthesis rate and phosphorylation of S6K, and MSTN acts as a negative regulator of the MTOR pathway. Furthermore, MSTN suppresses AKT/TORC1/p70S6K signalling, inhibits myoblast differentiation and myotube size (Trendelenburg et al. Citation2009). In Wang et al. (Citation2012)’s study, the expression of MSTN, S6K, MTOR and EIF4E (both at the mRNA and protein level) in SCs of Landrace pigs were significantly higher than those of Lantang pigs, which is consistent with our study. Gao et al. (Citation2017) also found that gene expression of the MTOR signalling pathway is lower in Lantang piglet SCs, suggesting that MTOR signalling might inhibit myogenic differentiation. Protein expression of MTOR, S6K1, and EIF4E in SCs from Dapulian pigs were lower than those from Landrace pigs, whereas the SCs from Lantang pigs exhibited more proliferative ability compared with Landrace pigs. Therefore, we suggest that the MTOR signalling pathway has opposite functions in SCs proliferation. However, some studies were not consistent with our results (Amirouche et al. Citation2009; Trendelenburg et al. Citation2009). These studies suggested that the overexpression of MSTN decreases expression of S6K and 4EBP1 (Amirouche et al. Citation2009), as the phosphorylation of S6K in muscle was found to be enhanced, but the phosphorylation of 4EBP1 did not change, upon injection of a MSTN antibody. Hence, MSTN might regulate protein synthesis in both an MTOR-dependent and MTOR-independent manner (Yoon Citation2017).
MTOR is a serine/threonine kinase that coordinates diverse cellular processes including cell growth, differentiation, autophagy, survival, and metabolism (Laplante and Sabatini Citation2012). Furthermore, MTOR controls mammalian cell size and cell cycle progression via its downstream target genes, S6K and 4EBP1/EIF4E (Fingar et al. Citation2004). That explained why muscle fibre size was larger in Landrace pigs, and there were more numbers of muscle fibres in Dapulian pigs (Table ). Meanwhile, SCs proliferative capacity in Dapulian pigs was also higher compared to that in Landrace pigs in vitro (Figure ). Similar results also found that the muscle fibre size and SCs cell size cultured in vitro in Landrace pigs was larger than that in Lantang pigs (Wang et al. Citation2012; Gao et al. Citation2017). Dapulian and Lantang pigs are both native to China and are characterised by more intermuscular fat, better meat quality and lower growth performance compared to most of commercial pigs. Our data suggested that higher expression levels of MYF5, MYOD, MYOG and lower expression of MSTN in SCs isolated from Dapulian pigs could affect the proliferation of SCs. We supposed that MYF5, MYOD, and MYOG positively regulate proliferation in SCs, and MSTN might negatively regulate SCs proliferation. Furthermore, lower expression of MTOR and its downstream targets S6K, 4EBP1 and EIF4E, might affect the proliferation capacity of SCs from Dapulian pigs.
Conclusions
In conclusion, the proliferative ability of SCs seems to rely on the host which they were isolated from. Our data suggested that the proliferative capacity of SCs from Dapulian pigs is greater, compared with Landrace pigs. The precise molecular mechanism that results in this difference is currently unknown, but it is probably related to MSTN, MYF5, MYOD, MYOG and MTOR signalling pathways.
Ethical approval
The protocol used in this experiment approved by the Institutional Animal Care and Use Committee of Institute of Animal Science and Veterinary Medicine, Shandong Academy of Agricultural Sciences (Jinan, Shandong, China).
Supplemental Material
Download MS Word (239 KB)Supplemental Material
Download MS Word (356.7 KB)Acknowledgements
The authors thank the staff of Conservation Farm of Dapulian pigs of Jining. The authors also thank Editage (www.editage.cn) for English language editing.
Disclosure statement
The authors declare that there is no conflict of interest associated with the paper. The authors alone are responsible for the content and writing of this article.
Additional information
Funding
Related Research Data
References
- Amirouche A, Durieux AC, Banzet S, Koulmann N, Bonnefoy R, Mouret C, Bigard X, Peinnequin A, Freyssenet D. 2009. Down-regulation of Akt/mammalian target of rapamycin signaling pathway in response to myostatin overexpression in skeletal muscle. Endocrinology. 150:286–294.
- Asfour HA, Allouh MZ, Said RS. 2018. Myogenic regulatory factors: the orchestrators of myogenesis after 30 years of discovery. Exp Biol Med. (Maywood). 243:118–128.
- Chen BJ, Ao QW, Chen SM, Wei Y, Guo Y, Lan G, Jiang, Q, Jiang H. 2018. Assessment of M. longissimus fibre types and metabolic enzymes in Bama miniature pigs and Landrace swine. Ital J Anim Sci. 17:1–8.
- Cinar MU, Islam MA, Uddin MJ, Tholen E, Tesfaye D, Looft C, Schellander K. 2012. Evaluation of suitable reference genes for gene expression studies in porcine alveolar macrophages in response to LPS and LTA. BMC Res Notes. 5:107.
- Collins CA, Gnocchi VF, White RB, Boldrin L, Perez-Ruiz A, Relaix F, Morgan JE, Zammit PS. 2009. Integrated functions of Pax3 and Pax7 in the regulation of proliferation, cell size and myogenic differentiation. PLoS One. 4:e4475.
- Dayton WR, White ME. 2008. Cellular and molecular regulation of muscle growth and development in meat animals. J Anim Sci. 86:E217–E225.
- Ding S, Wang F, Liu Y, Li S, Zhou G, Hu P. 2017. Characterization and isolation of highly purified porcine satellite cells. Cell Death Discov. 3:17003.
- Essen-Gustavsson B, Karlstrom K, Lundstrom K. 1992. Muscle fibre characteristics and metabolic response at slaughter in pigs of different halothane genotypes and their relation to meat quality. Meat Sci. 31:1–11.
- Fingar DC, Richardson CJ, Tee AR, Cheatham L, Tsou C, Blenis J. 2004. mTOR controls cell cycle progression through its cell growth effectors S6K1 and 4E-BP1/eukaryotic translation initiation factor 4E. Mol Cell Biol. 24:200–216.
- Fonseca BD, Smith EM, Yelle N, Alain T, Bushell M, Pause A. 2014. The ever-evolving role of mTOR in translation. Semin Cell Dev Biol. 36:102–112.
- Gao CQ, Xu YL, Jin CL, Hu XC, Li HC, Xing GX, Yan HC, Wang XQ. 2017. Differentiation capacities of skeletal muscle satellite cells in Lantang and Landrace piglets. Oncotarget. 8:43192–43200.
- Gu YR, Li MZ, Zhang K, Chen L, Jiang AA, Wang JY, Li XW. 2011. Evaluation of endogenous control genes for gene expression studies across multiple tissues and in the specific sets of fat- and muscle-type samples of the pig. J Anim Breed Genet. 128:319–325.
- Guiatti D, Stefanon B, Sgorlon S. 2013. Association analysis between single nucleotide polymorphisms in the promoter region of LEP, MYF6, MYOD1, OPN, SCD genes and carcass traits in heavy pigs. Ital J Anim Sci. 12:e13–e82.
- Hernandez-Hernandez JM, Garcia-Gonzalez EG, Brun CE, Rudnicki MA. 2017. The myogenic regulatory factors, determinants of muscle development, cell identity and regeneration. Semin Cell Dev Biol. 72:10–18.
- Iadevaia V, Liu R, Proud CG. 2014. mTORC1 signaling controls multiple steps in ribosome biogenesis. Semin Cell Dev Biol. 36:113–120.
- Institute of Animal Husbandry and Veterinary Medicine. 2014. S.AoA.S., Determination Method of Pig Skeletal Muscle Fiber Diameter: nitrofication process. Shandong Quality and Technical Supervision Bureau; p. 3.
- Jin W, Peng J, Jiang S. 2016. The epigenetic regulation of embryonic myogenesis and adult muscle regeneration by histone methylation modification. Biochem Biophys Rep. 6:209–219.
- Laplante M, Sabatini DM. 2012. mTOR signaling in growth control and disease. Cell. 149:274–293.
- Lazzaroni C, Pagano GT. 2003. Histochemical and morphometric characteristics of muscle fibres: breeds and muscles comparison. Ital J Anim Sci. 2:346–348.
- Lebret B, Ecolan P, Bonhomme N, Meteau K, Prunier A. 2015. Influence of production system in local and conventional pig breeds on stress indicators at slaughter, muscle and meat traits and pork eating quality. Anim: Int J Anim Biosci. 9:1404–1413.
- Li Q, Domig KJ, Ettle T, Windisch W, Mair C, Schedle K. 2011. Evaluation of potential reference genes for relative quantification by RT-qPCR in different porcine tissues derived from feeding studies. Int J Mol Sci. 12:1727–1734.
- Li BJ, Li PH, Huang RH, Sun WX, Wang H, Li QF, Chen J, Wu WJ, Liu HL. 2015. Isolation, culture and identification of porcine skeletal muscle satellite cells. Asian-Australas. J Anim Sci. 28:1171–1177.
- Lim K-S, Jang H-I, Kim J-M, Lee S-H, Kim B-CK, Han, K-J, Hong K-C. 2009. Comparison of muscle fibre characteristics and production traits among offspring from Meishan dams mated to different sires. Ital J Anim Sci. 8:727–734.
- Martino A, Cabiati M, Campan M, Prescimone T, Minocci D, Caselli C, Rossi AM, Giannessi D, Del Ry S. 2011. Selection of reference genes for normalization of real-time PCR data in minipig heart failure model and evaluation of TNF-α mRNA expression. J Biotechnol. 153:92–99.
- McCulloch RS, Ashwell MS, O'Nan AT, Mente PL. 2012. Identification of stable normalization genes for quantitative real-time PCR in porcine articular cartilage. J Anim Sci Biotechnol. 3:36.
- Nygard A-B, Jørgensen C B, Cirera S, Fredholm M. 2007. Selection of reference genes for gene expression studies in pig tissues using SYBR green qPCR. BMC Mol Biol. 8(1):67 doi:10.1186/1471-2199-8-67.
- Paredes SP, Kalbe C, Jansman AJ, Verstegen MW, van Hees HM, Losel D, Gerrits WJ, Rehfeldt C. 2013. Predicted high-performing piglets exhibit more and larger skeletal muscle fibers. J Anim Sci. 91:5589–5598.
- Park SJ, Kwon SG, Hwang JH, Park DH, Kim TW, Kim CW. 2015. Selection of appropriate reference genes for RT-qPCR analysis in Berkshire, Duroc, Landrace, and Yorkshire pigs. Gene. 558:152–158.
- Ribeiro AF Jr, Souza LS, Almeida CF, Ishiba R, Fernandes SA, Guerrieri DA, Santos ALF, Onofre-Oliveira PCG, Vainzof M. 2019. Muscle satellite cells and impaired late stage regeneration in different murine models for muscular dystrophies. Sci Rep. 9:11842.
- Ropka-Molik K, Eckert R, Piorkowska K. 2011. The expression pattern of myogenic regulatory factors MyoD, Myf6 and Pax7 in postnatal porcine skeletal muscles. Gene Expr Patterns: GEP. 11:79–83.
- Schmittgen TD, Livak KJ. 2008. Analyzing real-time PCR data by the comparative C(T) method. Nat Protoc. 3:1101–1108.
- Seale P, Sabourin LA, Girgis-Gabardo A, Mansouri A, Gruss P, Rudnicki MA. 2000. Pax7 is required for the specification of myogenic satellite cells. Cell. 102:777–786.
- Taylor SC, Berkelman T, Yadav G, Hammond M. 2013. A defined methodology for reliable quantification of Western blot data. Mol Biotechnol. 55:217–226.
- Thomas M, Langley B, Berry C, Sharma M, Kirk S, Bass J, Kambadur R. 2000. Myostatin, a negative regulator of muscle growth, functions by inhibiting myoblast proliferation. J Biol Chem. 275:40235–40243.
- Tong Z, Gao Z, Wang F, Zhou J, Zhang Z. 2009. Selection of reliable reference genes for gene expression studies in peach using real-time PCR. BMC Mol Biol. 10:71.
- Trendelenburg AU, Meyer A, Rohner D, Boyle J, Hatakeyama S, Glass DJ. 2009. Myostatin reduces Akt/TORC1/p70S6K signaling, inhibiting myoblast differentiation and myotube size. Am J Physiol Cell Physiol. 296:C1258–C1270.
- Uddin MJ, Cinar MU, Tesfaye D, Looft C, Tholen E, Schellander K. 2011. Age-related changes in relative expression stability of commonly used housekeeping genes in selected porcine tissues. BMC Res Notes. 4:441.
- Vandesompele J, De Preter K, Pattyn F, Poppe B, Van Roy N, De Paepe A, Speleman F. 2002. Accurate normalization of real-time quantitative RT-PCR data by geometric averaging of multiple internal control genes. Genome Biol. 3:RESEARCH0034.
- Wallace MA, Della Gatta PA, Ahmad Mir B, Kowalski GM, Kloehn J, McConville MJ, Russell AP, Lamon S. 2016. Overexpression of striated muscle activator of Rho signaling (STARS) increases C2C12 skeletal muscle cell differentiation. Front Physiol. 7:7.
- Wan H, Zhao Z, Qian C, Sui Y, Malik A, Chen J. 2010. Selection of appropriate reference genes for gene expression studies by quantitative real-time polymerase chain reaction in cucumber. Anal Biochem. 399:257–261.
- Wang XQ, Yang WJ, Yang Z, Shu G, Wang SB, Jiang QY, Yuan L, Wu TS. 2012. The differential proliferative ability of satellite cells in Lantang and Landrace pigs. PLoS One. 7:e32537.
- Welle SL. 2009. Myostatin and muscle fiber size. Focus on “Smad2 and 3 transcription factors control muscle mass in adulthood” and “Myostatin reduces Akt/TORC1/p70S6K signaling, inhibiting myoblast differentiation and myotube size". . Am J Physiol Cell Physiol. 296:C1245–C1247.
- Yang W, Zhang Y, Li Y, Wu Z, Zhu D. 2007. Myostatin induces cyclin D1 degradation to cause cell cycle arrest through a phosphatidylinositol 3-kinase/AKT/GSK-3 beta pathway and is antagonized by insulin-like growth factor 1. J Biol Chem. 282:3799–3808.
- Yin H, Price F, Rudnicki MA. 2013. Satellite cells and the muscle stem cell niche. Physiol Rev. 93:23–67.
- Yoon MS. 2017. mTOR as a key regulator in maintaining skeletal muscle mass. Front Physiol. 8:788.
- Zammit PS. 2017. Function of the myogenic regulatory factors Myf5, MyoD, Myogenin and MRF4 in skeletal muscle, satellite cells and regenerative myogenesis. Semin Cell Dev Biol. 72:19–32.
- Zhang P, Liang X, Shan T, Jiang Q, Deng C, Zheng R, Kuang S. 2015. mTOR is necessary for proper satellite cell activity and skeletal muscle regeneration. Biochem Biophys Res Commun. 463:102–108.
- Zhao Y, Gao P, Li W, Zhang Y, Xu K, Guo X, Li, B, Cao G. 2015. Study on the developmental expression of Lbx1 gene in Longissimus dorsi of Mashen and large white pigs. Ital J Anim Sci. 14:3720.
- Zhu H, Park S, Scheffler JM, Kuang S, Grant AL, Gerrard DE. 2013. Porcine satellite cells are restricted to a phenotype resembling their muscle origin. J Anim Sci. 91:4684–4691.