
Dear Editor in Chief,
Over a decade ago we assessed the status of the bibliographic indicators of ASPA members (Pulina and Francesconi Citation2007) and since then much water has passed under the bridge of bibliometric science. The number of published papers, the rank of scientific journals, number of citations and Hirsch’s H-index (Hirsch Citation2005), have been widely used for the evaluation of academic careers and of scientific institutions (El Gibari et al. Citation2018). The Italian National Agency for the Evaluation of Universities and Research Institutes (ANVUR Citation2020) has adopted three bibliometric indices for the ranking of the single academic careers in a given period: the total number of published papers, the total citations, and the H-index. The median of each of the three indices has been used as a threshold value. Thus, for example, for becoming a university professor, that a candidate must have at least two out of the three indicators above the threshold value.
The weakness of the abovementioned indicators to evaluate the single scientific career is well known. Limitations of the H-index, originally proposed to assess the real impact of the work of a single researcher on the scientific community, and of its variants for different scientific fields have been reviewed by Alonso et al. (Citation2009). However, multiple authorship and self-citations still represent two main issues for the correct evaluation of the individual scientific career.
Galam (Citation2011) proposed a gh-index to account for the multiple authorship problem and observed that:
It is rather striking to notice that while science is based on the discovering and the use of conservation laws, scientists have been applying the myth of ‘Jesus multiplying bread and fish’ for decades by multiplying for themselves published articles. Indeed, when an article is published with k authors, each co-author adds one paper to its own list of publications. It means that for one paper published with k authors, k authors add one to their respective number of publications. Accordingly, a single k-author papers contributes to k papers while aggregating the total number of papers published by all scientists from their respective publication lists. The same process applies for the citation dynamics with one single citation for one k-author paper contributing to an overall of k citations since each one of the k authors includes the citation in its personal h-index evaluation.
The co-authorship H-index inflation was faced by Hirsch (Citation2010) himself who modified his indicator to consider for multiple authors and tailored by Prathap (Citation2011) who proposed a fractional and harmonic p-indices for multiple authorship.
Self-citations inflate the bibliometric indices too. Recently, SCOPUS® Database has beginning to release two H-index corrected for the self-citation by the specific author and of all its co-authors. This theme has been developed at country level by Baccini et al. (Citation2019) who, paraphrasing Goodhart’s law (‘when a measure becomes a target, it ceases to be a good measure’) observed that ‘the introduction of bibliometric targets into the Italian academy has changed the way Italian academics cite and use the work of their colleagues’.
To overcome the problems of multiple co-authorship and self-citations and to avoid the use of composite indicators difficult to calculate and validate (OECD Citation2008), I propose here a simple bi-median method for the evaluation of a single career of the researchers. The method is based on the indices currently available in the most popular bibliometric databases (SCOPUS® and WOS®) and that are widely used by the Italian and international scientific communities. I then have applied this method to Italian academic ASPA members.
Data were retrieved from the net during the period from 20th April to 30th April 2020. The list of names and academic position of 365 ASPA members (Full professor, Associate professor, Senior researcher, and Junior researcher; the difference between researcher position is that the former has a permanent tenure and the latter temporary tenure) were downloaded from the website of the ‘Ministero dell’Istruzione, dell’Università e della Ricerca’ (the Italian Ministry of Education and Research, MIUR) [https://cercauniversita.cineca.it/php5/docenti/cerca.php]. Members were grouped according to the four research areas of ASPA (Scientific Disciplinary Sectors, S.D.S.): (i) AGR/17 – Animal genetics and breeding (‘Zootecnica Generale e Miglioramento Genetico’); (ii) AGR/18 – Animal nutrition and feeding (‘Nutrizione e Alimentazione Animale’); (iii) AGR/19 – Animal husbandry (‘Zootecnica Speciale’); (iv) and AGR/20 – Poultry, rabbits and fish production (‘Zoocolture’).
Then the publication list of all academic members (17 data were missed) and their bibliometric indices were downloaded from the SCOPUS® Database [https://www.elsevier.com/solutions/scopus]. Considered indices were: total number of publications (Papers n.), total citations (Cit. tot (1)), total citations without self-citations of all co-authors (Cit. no self_cit_all (2)), total citation without self-citations of the considered author (Cit. no self_cit_aut (3)), H(1) index calculated over Cit. tot (1), H(2) index calculated excluding self-citation of all co-authors, H(3) index calculated excluding self-citations of the selected author, total number of co-authors (Co-aut tot.). Then, I calculated the following ratio indices: co-authors per paper (Co-aut paper = Co-aut tot./Papers n.), citation per paper (Cit/paper = Cit. tot (1)/Papers n.), citation per author (Cit/aut_all = Cit. tot (1)/Co-aut tot.), incidence of no self-citations of all co-authors over total citations (% self_cit_all (2) = Cit. no self_cit_all (2)/Cit. tot (1) × 100), incidence of no self-citations of selected author over total citations (% self_cit_aut (3) = Cit. no self_cit_aut (3)/Cit. tot (1) × 100) and the incidence of H(2) and H(3) over H(1).
Table reports the median, the first (Q1) and third (Q3) quartile of each index and index ratio calculated for the Italian four academic positions and the 348 ASPA academic members.
Table 1. Medians, the first (Q1) and third (Q3) quartiles of bibliometric indices and index ratios calculated for a single academic position and for all ASPA academic members.
Comparing the data shown in Table with those we reported 14 years ago (Pulina and Francesconi Citation2007), the overwhelming increase in all values is undeniable: Papers n., 7.6 times; Cit. tot (1), 32.7 times; H(1), 6.5 times; Cit/paper, 4.5 times. This confirms the commitment of the ASPA scientific community to improve its position in the international panorama of animal science research.
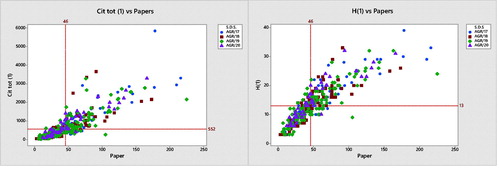
Figure shows the position of ASPA academic members in the space defined by the number of papers and total citations (left) and H(1) (right). The medians of indicators (red lines) define 4 quadrants: low-low (LL, left-bottom), high-low (HL, right-bottom), high-high (HH, right-upper) and low-high (LH, left-upper). Being the indices highly correlated, as it can be seen next in this letter, almost all members are located in the LL and HH quadrants. The few observations falling in the LH quadrant refer belong to scientists with limited published papers having a high impact, whereas those in HL quadrants belong to scientists with many published papers but with scarce citations, respectively. No significant differences were found among different disciplinary sectors (p > .05, data not shown), thus confirming that ASPA appears as a quite homogeneous scientific community regardless of the specific field of interest of each member.
Figure 1. ASPA scientific community divided by the scientific disciplinary sector (S.D.S.). Scatterplot of the number of papers published by each member plotted against total citations (Cit. tot (1), on the left) and H(1) (on the right) indices and the relative position to medians (red scattered lines).
The correlation matrix of the main bibliometric indicators and their derived indices is reported in Table . Papers n. shows a low negative correlation with Co-aut paper and %self_cit_aut (3), whereas it is positively, mainly strongly, correlated with the other parameters. This result suggests that the number of published papers represents the main driver of the author’s impact on the scientific community. Moreover, they suggest that these parameters should not be treated as independent when building a bimedian index, except for those that resulted in weakly correlated. The other main bibliometric parameter, that is, Cit. tot (1), and also the Cit. no self_cit_aut (3), are not correlated with Co-aut paper and %self_cit_aut (3). Based on these results, total citations with or without author self-citations can be used as an independent variable against co-authorships load and self-citations incidence, the two parameters of interest of this letter.
Table 2. Pearson correlations between some of the bibliometric indices and index ratios calculated for all ASPA academic members.
Based on the weak or null correlation amongst the indicators above discussed, I have developed some bimedian graphs that can help to discriminate high shared authorship and high self-citation ratio as the worse position in the bibliometric space of the scientific careers of academic ASPA members. All graphs highlighted the expected differences among the four academic positions, as the result of the different lengths of the scientific careers.
The best position of the left graph of Figure is HL followed, in decreasing order by LL, HH, and LH position. A low number of co-authors means a larger quota of the intellectual property of the paper for the researcher. However, the weakness of this parameter is represented by the penalisation of the open authorship, that is, the more the co-authors the larger the network of a single researcher. I am aware that for assessing the correct amount of intellectual property of a multiple-author paper it is necessary to consider many other aspects like the position and role of each author (first or last, corresponding, etc.), the rank of the scientific journal, or the kind of paper (review, research contribution, technical note, short paper, etc.). Thus, for the sake of simplicity, I chose to consider the average number of co-authors per paper as a proxy for the evaluation of the intellectual property of a scientist published literature.
Figure 2. ASPA scientific community divided by academic role. Scatterplot of the number of papers published by each member plotted against mean author per paper (co_aut_paper, on the left) and % of total citations exclude self-citations (%self_cit_aut(3), on the right) indices and the relative position to medians (red scattered lines).
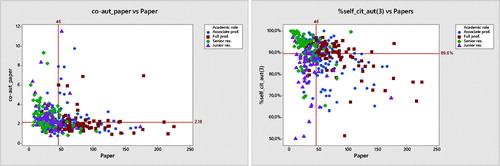
The best position of the right graph of Figure is HH, followed equally by HL and LH positions and, again worse, the LL position. Senior researchers show significantly less self-citation index compared to Full and Associate professors, that exhibit less self-citations than Junior researchers (p < .05, data not shown).
The left graph in Figure reports the average authorship plotted against total citations. The best position is in HL quadrant, followed in order by HH, LL and LH quadrants.
Figure 3. ASPA scientific community divided by academic role. Scatterplot of the number of total citations (Cit tot (1)) by each member plotted against mean author per paper (co_aut_paper, on the left) and % of total citations excluded self-citations (%self_cit_aut(3), on the right) indices and the relative position to medians (red scattered lines).
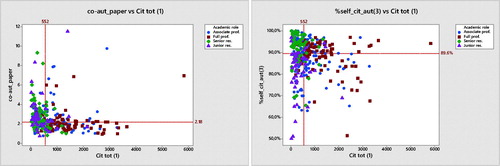
The right graph of the same figure plots the percentage of no self-citations (%self_cit_aut(3)) over total citations. It reflects the pattern of the companion graph and therefore has the same qualitative order of quadrants.
The best position of the left graph in Figure is the HH quadrant, that is, researchers with a high degree of not self-citation and high H-index calculated without self-citations followed by LH, HL and LL quadrants.
Figure 4. ASPA scientific community divided by academic role. Scatterplot of % total citations excluded self-citations (%self_cit_aut(3)) by each member plotted against H-index excluded self-citations (H(3), on the left) and average citations per co-author(cit/aut_all, on the right) indices and the relative position to medians (red scattered lines).
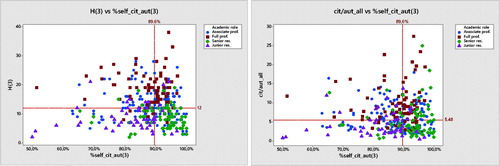
The right graph in the same figure plots the average citation per author per paper against the self-citations index. It can be interpreted with the same order of quadrants of the companion graph.
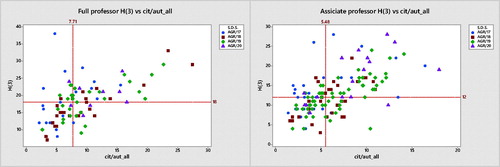
Finally, Figures shows the distribution of the H-index excluded the self-citations by the researcher plotted against the average citation per author per paper for full and associate professors respectively. The best position is that of quadrant HH (high citation per co-author coupled with high H-index cleaned by self-citations) followed by those of quadrant HL and LH paired, and least LL.
Figure 5. Full and Associate professors, members of ASPA, divided by scientific area (S.D.S.). Scatterplots of H-index excluded self-citations (H(3)) against average citations per co-authors.
Conclusions
The ASPA community exhibits a good scientific performance with high values of the main bibliometric indicators, obviously greater for the older compared to the younger scientists, with a limited number of co-authors per paper and a low degree of self-citations. However, the bimedian method I proposed here, that can be also used with other pairs of medians than those reported in this letter and enriched with Q1 or Q3 thresholds to highlight areas of excellence, could be a useful tool to evaluate our ASPA academic members careers in the light of avoid the ‘Jesus multiplying bread and fish’ myth and ‘Münchausen baron bootstrap’ legend.
Disclosure statement
No potential conflict of interest was reported by the author.
References
- Alonso S, Cabrerizo FJ, Herrera-Viedma E, Herrera F. 2009. h-Index: a review focused in its variants, computation and standardization for different scientific fields. J Informetr. 3(4):273–289.
- ANVUR. 2020. Typology of ANVUR’s activities. ANVUR website, Rome. Accessed date 10th May 2020. https://www.anvur.it/wp-content/uploads/2020/01/Typology-of-ANVUR%E2%80%99s-activities.pdf
- Baccini A, De Nicolao G, Petrovich E. 2019. Citation gaming induced by bibliometric evaluation: a country-level comparative analysis. PLoS One. 14(9):e0221212.
- El Gibari S, Gómez T, Ruiz F. 2018. Evaluating university performance using reference point based composite indicators. J Informetr. 12(4):1235–1250.
- Galam M. 2011. Tailor based allocations for multiple authorship: a fractional gh-index. Scientometrics. 89(1):365–379.
- Hirsch JE. 2005. An index to quantify an individual’s scientific research output. Proc Natl Acad Sci USA. 102(46):16569–16572.
- Hirsch JE. 2010. An index to quantify an individual’s scientific research output that takes into account the effect of multiple coauthorship. Scientometrics. 85(3):741–754.
- OECD. 2008. Handbook on constructing composite indicators: methodology and user guide. Paris (France): OECD publications; p. 1–158.
- Prathap G. 2011. The fractional and harmonic p-indices for multiple authorship. Scientometrics, 86:239–244
- Pulina G, Francesconi HED. 2007. Some bibliometric indexes for members of the Scientific Association of Animal Production (ASPA). Ital J Anim Sci. 6(1):83–103.