
 ?Mathematical formulae have been encoded as MathML and are displayed in this HTML version using MathJax in order to improve their display. Uncheck the box to turn MathJax off. This feature requires Javascript. Click on a formula to zoom.
Abstract
Limited information is available to evaluate optimal growth in Toy Poodles. This work aimed at comparing three growth curves, proposing centile charts and developing a model to estimate the adult body weight (BW) in Toy Poodles. A total of 65 puppies (male = 30, female = 35) born in the same breeding centre were used. BW at birth and, weekly BW, for 53 weeks, BW of parents, litter size, type of management, daily activity and neutering were recorded. Forty-six puppies were sold, and their data were reported by the new owners. Three growth curves (i.e. Hawthorne, Brody and Gompertz) were constructed and compared; Linear Mixed Models including demographic characteristics and management habits were built. The BW at birth was 154 ± 35 g and adult BW was 3208 ± 860 g. Based on the goodness-of-fit and accuracy indices, Gompertz was the best growth model and was selected to plot centile curves based on sex. Toy Poodles achieved 50% of their adult weight at 11–12 weeks, with an overall growth rate of 11.8%. Adult BW was affected by birth BW (p < .01), sex (p < .05) and mother’s BW (p < .01) and their effects varied depending on the age. Extrinsic factors, including litter size, type of management and daily activity were less significant, probably due to the standardised and high-level management of these Toy Poodles. These new and applicable tools for monitoring the growth and predicting adult BW could be useful for veterinarians, breeders and owners for early diagnosis of poor health and welfare. Subject classification codes: companion animals sections
Performance of three logistic models for describing the growth curve in Italian Toy Poodles were compared
Based on the goodness of fit and accuracy indices, Gompertz was the best growth model
The centile growth curves were constructed for males and females using the Gompertz
Adult body weight (BW) was mainly affected by the sex and birth BW, and less by BW of the parents and litter size
Monitoring BW of puppies may be useful to enhance their health and welfare
Highlights
Introduction
Growth is a complex process affected by genetics, nutrition, physical activity and other environmental factors (Posada et al. Citation2014). Growing dogs go through three critical periods: lactation, weaning and post-weaning (Salt et al. Citation2017). The grow rate during the lactation period is strongly affected by litter size, body weight (BW) at birth, and colostrum assumption and quality (Mila et al. Citation2015), with puppies’ birth weight correlated positively with the placenta weight (Tesi et al. Citation2020). Weaning is a well-known critical period and in Italy, puppies are usually weaned between the 3rd and the 8th week and they must not be sold before 60 days of life (Conferenza Unificata Stato-Regioni e Stato-Citta', 2013). Whist breeders take care of the first two periods, owners are responsible for post-weaning growth, which is considered the most critical phase for the correct development of the muscle-skeletal system (Case et al. Citation2011). The fastest growth occurs during the first 3 months of life and small dog breeds reach adult weight between 6 and 12 months (Hawthorne et al. Citation2004; Case et al. Citation2011). Postnatal physical development leads to intense changes in the weight and size of puppies and this process takes place before and after their purchase. The knowledge of changes in the growth rate of pure small dog breeds is therefore of particular interest for both breeders and future owners (German Citation2006). Responsible pet ownership includes access to appropriate food and water and provision for exercise and mental stimulation to protect puppies’ growth, health and welfare (Menchetti et al. Citation2019; American Veterinary Medical Association Citation2020). Consequently, for both breeders and owners, it is important to have reference values for the postnatal growth to predict the adult BW and to monitor the growth percentiles to recognise possible deviations from growth curve due to illness or dietary errors (Ardelean and Suteu Citation2005). Obesity is indeed the biggest welfare issue in western dogs (Gossellin et al. Citation2007; Case et al. Citation2011; American Veterinary Medical Association Citation2020).
Despite the topicality of the theme, little information is available on growth curves, optimal growth and centile curves of dog breeds (Hawthorne et al. Citation2004; Ardelean and Suteu Citation2005; Posada et al. Citation2014; Salt et al. Citation2017). Growth curves are a useful tool to not only describe the changes in BW over time but also to predict the expected weight at specific ages, to evaluate responses to feeding regimes or to select dogs for reproduction (Fitzhugh Citation1976). Several equations have been proposed to fit the growth curve in animal science, such as logistic, Gompertz, Brody and Richards models (Fitzhugh Citation1976; France et al. Citation1996). These nonlinear models, in addition to the BW of the individual (or group) at each age, provide biologically important parameters which can be easily interpreted: growth rate and estimated adult BW. However, each organism follows a specific growth pattern which requires a specific equation. The choice of an appropriate model and the evaluation of its goodness of fit to the actual data is the prerequisite for its practical application (Fitzhugh Citation1976).
In the last decade, the breeds of companion and toy dogs reared in Italy showed a relevant commercial success. Among the different breeds included in this group, the Poodle (FCI-Standard No.172) showed an increase of 65% of the number of puppies registered in the herd book, raised from 1226 to 3271 between 2010 and 2018 (Ente Nazionale Cinofilia Italiana Citation2020). Poodle dog breed includes four different sizes, ‘Standard’, ‘Medium’, ‘Miniature’ and ‘Toy’ which are different in height at the withers and BW. The ‘Toy Poodle’, in compliance with the Fédération Cynologique Internationale (FCI) (FCI Citation2015), has to show a withers height between 24 cm (with a tolerance of 1 cm) and 28 cm (sought after ideal: 25 cm). It has also to maintain, in its ensemble, the aspect of a Miniature Poodle with the same general proportions complying with all the points of the standard of the breed. With regards to the BW, ‘Standard’, ‘Medium’, ‘Miniature’ and ‘Toy’ should be about 26–27, 10–12, 5–10 and less than 5.0 kg, respectively (Stafford Citation2006). The puppies of the Toy size represent about 15% of the total puppies of Poodle breed registered in the Italian herdbook in 2018 (Ente Nazionale Cinofilia Italiana Citation2020).
To the best of the authors’ knowledge, a study on the growth of Toy Poodles has never been carried out. To fill this gap, this study aimed at developing two easy and applicable tools for Toy Poodle breeders, owners and veterinarians: weight-for-age charts and predictive models. Therefore, the first goal was to select an appropriate non-linear equation to provide a specific shape of the growth curve from birth to 1 year of age in Toy poodles and built centile growing charts for male and female puppies. Then, hypothesising that adult BW would be positively associated with intrinsic (i.e. sex and parents BW) and extrinsic (i.e. physical activity and management) factors, the second goal was to construct a linear model to predict the adult BW in Toy Poodles using some simple characteristics, namely BW at birth, gender, mother’s and father’s BW, litter size, neutering, daily activity and management (professional/owner) using a population of puppies born in the same breeding centre.
Material and methods
Ethical statement
Experimental procedures, involving dogs subjected to conventional farm rearing condition, complied with the European code of practice for the care and use of animals for scientific purposes (Directive 2010/63/EU). Before the experiment began, the procedure was explained to the breeder and the owners and informed written consent were obtained. Since no tissues or any other samples were collected, there was no need for approval by the Italian Health Ministry in agreement with the EU legislation Directive 2010/63/EU.
Animals and experimental protocol
The trial was conducted at an Italian breeding centre (La Fioravanta, Bologna, Italy). A total of 65 puppies (30 males and 35 females) of Toy Poodle breed born from January to August 2019 were included in the study. During the study, the dogs were treated and regularly checked by a veterinarian; they were healthy, with an ideal body condition score (3) (Stafford Citation2006) and in a good welfare state.
The parents of the tested puppies were registered in the herd book as Toy after being evaluated during official competitions in agreement with the standard compliance of the Toy Poodle breed. Twenty-three bitches (BW = 3604 ± 943), from 1.2 to 7 years old and ranging from 1 to 6 as parity, and nine male dogs (BW = 3822 ± 774 g) were used as breeders.
Ten days before the expected data of delivery the bitches started to be fed with a commercial feed (Mini puppy) with Crude Protein 31.0%, Fat 20.0%, Ash 7.7%, Fibre 1.4%. At birth, the BW of each puppy was obtained using an electric scale (Kerbl mod. 29923, Germany). Puppies with a very little size or not able to suck enough milk from their mothers were temporarily moved to other nursing bitches, if available, or were artificially fed with a milk replacement (Crude protein 24.0%, Fat 24.0%, Ash 7.0%, Crude fiber 0%). Body weight was recorded every week, the same day of the birth, at the same time (early morning) and before feeding. Each litter, including bitch and puppies, were housed in a box of 16 m2; during the milking the bitches were fed with the same commercial feed (Mini puppy) used in the later pregnancy. Around the second week, another commercial feed (Ministarter; Crude Protein 30.0%, Fat 22.0%, Ash 7.5%, fiber 1.3%) previously grounded and mixed with water was also available for the puppies. This feed was provided for 1–2 weeks until the puppies were able to eat the commercial feed (Mini puppy) provided to the bitches. Puppies were separated from the mother around the 9th week. They were dewormed with 0.45 mg Emodepside/kg BW and 9 mg di Toltrazuril/kg BW (Procox Bayer, Germany) at the 5th, 8th and 10th week and vaccinated for canine parvovirus (CPV) (Canigen Puppy, Virbac, Italy) and canine distemper virus (CDV), canine adenovirus (CAV-1 and CAV-2) (Versican Plus DHPPi, Zoetis Belgium) at the 6th, 9 th and 10 th week administered by the veterinarian of the breeding centre. After weaning, the diet was kept and based totally on the same commercial feed for 1 year (Mini puppy) covering the nutritional requirements estimated by NRC (Citation2006). Out of the 65 puppies, 46 (21 females and 25 males) were sold after the 10th week of age (range = 11–46 weeks; median = 22 weeks) while 19 (14 females and 5 males) remained at the breeding centre until the end of the study. The unsold puppies stayed at the breeding centre and were fed with the same commercial feed (Mini puppy). After weaning, they were housed in a box with a dimension of 16 m2. In each box, there were 4–6 dogs of different litters/breeds, to meet the needs of locomotory and social behaviours. For statistical purposes, two groups were created: puppies remained in the breeding centre (professional management group) and dogs sold to private owners before reaching 99% of their adult BW (T99 calculated according to the best growth curve; owner management group). The new owners were contacted by email to be informed and to consent to be part of the study. The email explained the aims of the study, and how to record the weekly BW (weekly, early morning, before feeding) until the 53rd week of age (maximum follow-up time). Owners used electric scales of different brands with the same accuracy (1 g). The owners sent weekly an email with the BW of their dogs; in a successive email, they also reported whether there were any changes in the type of feeding, the daily activity (i.e. the type of exercise; the number of walks per day (d) or free exercise in the outdoor garden) and whether the dog had been spayed or castrated. Afterwards, daily activity was categorised into three levels: 1–2 walks/day, >2 walks/day and free exercise in the outdoor garden or box. All new owners continued to manage the puppies following the breeder’s advise.
Statistical analysis
Descriptive statistics were used to present dog population reporting means ± SD or numbers and percentages. Diagnostic graphics and Levene tests were used to check assumptions. Moreover, distributions within categorical variables (sex, daily activity and management) were evaluated using Chi-Square Goodness of Fit Tests (each assuming all categories equal). The differences in neutering and management habits were compared by Chi-square test.
Growth curves
First, data set was stratified by sex and, for each time point, the outliers were eliminated according to the Horn’s algorithm using Tukey's interquartile fences and box-and-whisker plots (Friedrichs et al. Citation2012). Moreover, the puppies whose BW did not reach at least the 40th week (lost to follow-up) were excluded.
Then, three functions were applied to the data (Table ). In addition to a global model, separate curves were also built for sex.
Table 1. Nonlinear functions applied to describe the growth curves in Toy Poodle puppies.
The outliers of all models were identified and eliminated using the method proposed by Motulsky and Brown (Citation2006). The goodness of fit was assessed using the higher R2 (coefficient of determination), the lower RMSE (root mean square error) and AICc (corrected Akaike’s Information Criteria) values. The difference between AICc values for two models was indicated as ΔAICc. Moreover, the bias (mean difference between predicted and actual values) with 95% limits of agreement were evaluated (LoA; Bland and Altman Citation1999), and the mean absolute error (MAE) and mean absolute percentage error (MAPE) were calculated as below (Li Citation2017; Waiz et al. Citation2019):
Finally, z-scores were computed and, using the best fit model, growth centile curves were built showing centiles 3, 5, 10, 25, 50, 75, 90, 95 and 97%.
Multivariable model predicting BW
The following model to predict adult BW was built using Linear Mixed Models (LMMs) and Restricted Maximum Likelihood (REML) for estimating the parameters:
where b0 is the intercept, G is the fixed effect of gender (intact or castrated male, intact or spayed female), bBW is the fixed effect of birth body weight, mBW is the fixed effect of mother’s body weight, fBW is the fixed effect of father’s body weight, Ls is the fixed effect of litter size, Da is the fixed effect of daily activity (1–2 walks/day, 3–6 walks/day, garden or box), M is the fixed effect of management (professional or owner), Ai is the random animal effect and ε is the error. Mother and father were considered repeated factors.
To evaluate the factors affecting BW until 3 months of age, a simplified model was built including sex (male or female), birth BW, mother’s and father’s BW and litter size:
Diagnostic graphics were used to check assumptions. Sidak adjustment was used for carrying out multiple comparisons. Results were presented as estimated marginal means, b parameters, and standard errors (SE). The goodness of fit and the accuracy of the predictive model were evaluated by AICc, MAE and MAPE (Li Citation2017; Waiz et al. Citation2019).
All statistical analyses were performed with SPSS Statistics version 25 (IBM, SPSS Inc., Chicago, IL) and GraphPad Prism, version 7.0 (GraphPad Software, San Diego, CA). The level of statistical significance was set at <0.05.
Results
Dog population
Table shows descriptive statistics for demographic data and management habits. There was no statistical difference in the proportion of males (n = 30) and females (n = 35, p = .535) of the population studied. The mean litter size was three puppies (SD = 1; range 1–5 puppies). The birth BW ranged from 82 to 252 g without significant differences between males and females (p = .510). Moreover, there was no difference in neutering rate between sexes (p = .320). Most of the dogs (62.9%) were freely exercised in a garden or a large box (p value of Chi-Square Goodness of Fit Tests <0.001). Nine dogs (6 males and 3 females) were not included in the adult BW analysis as weekly BW did not reach the 40th week.
Table 2. Demographic data and management of the Toy Poodle dogs (n = 65) according to sex. Descriptive statistics: means ± SD or numbers and percentages.
Growth curves
Figure shows the pattern of each model from birth to 53 weeks of age: sigmoid for Hawthorne and Gompertz and exponential for Brody function. The tested growth curves explained more than 67% of the variance (Table ) but the comparison between models showed that the best fits were obtained by stratifying the curves according to the sex for all models, namely for Hawthorne (ΔAICc = 25.77), Gompertz (ΔAICc = 24.1) and Boyle (ΔAICc= 17.9).
Figure 1. Changes in body weights (g) as a function of age (weeks) obtained with the observed curve and the three different growth models for Toy Poodle dogs.
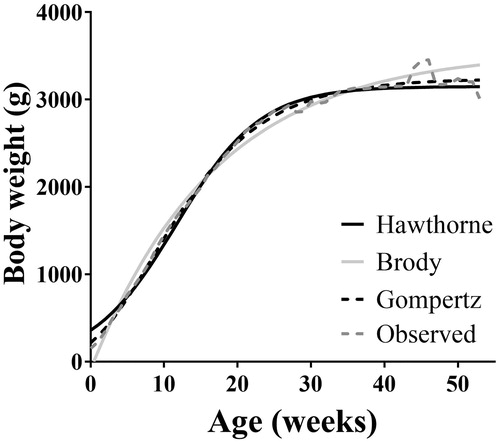
Table 3. Growth characteristics and goodness of fit of growth curves calculated on 65 Toy Poodle dogs (30 males and 35 females).
Estimated adult BW ranged from 3150 ± 25 g (Hawthorne) to 3560 ± 54 g (Brody) (Table ). Hawthorne and Gompertz equations estimated higher adult weights in males than females, while Brody predicted a higher value for females. Males reached 50% of their BW at 10.9–11.2 weeks. The females took a week longer than males to reach 50% of their BW, and their growth rate was lower. During the exponential phase, their BW increased 19.1 and 13.0% per week according to Hawthorne and Gompertz, respectively. Regardless of sex, Toy Poodles achieved 50% of the adult weight at 11.6–12.2 weeks. The growth rates obtained by the Brody equation was about half of those calculated with the other models and showed the greatest coefficients of variability. The estimated time to reach 30 and 50% of the adult weight was similar in all models. Based on Hawthorne and Gompertz models, dogs reached 99% of their adult weight between 35 and 51 weeks. This parameter calculated by the Brody model provided implausible values (71–87 weeks).
The AICc approach suggested that the Gompertz was much more likely to be better than both Hawthorne (94.8% probability for males (ΔAICc= 5.8) and 99.9% probability for females (ΔAICc= 19.4)) and Brody models (>99.9% probability for males (ΔAICc= 34.4) and 98.5% probability for females (ΔAICc= 8.4)). According to R2 values of global curve, models fall in the order Gompertz > Hawthorne > Brody while RMSE values were in the following order: Brody > Hawthorne > Gompertz.
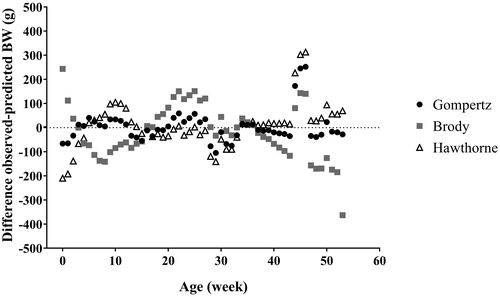
Figure shows that the Brody equation produced wide differences with respect to the actual values registered at birth (243 g) and 53 weeks of age (−363 g). The trend of differences between observed and predicted values (mean error = −18.0 g, LoA= −239.5–203.5 g; MAE= 91.4 g; MAPE= 3.8%) was fluctuating and age-dependent. Similarly, Hawthorne showed large differences at birth (−209.8 g) although lower differences between observed and predicted values were observed later (mean error = 9.7 g, LoA= −175.9 to 195.3 g; MAE= 62.9 g; MAPE= 2.7%). Hawthorne model underestimated the adult weight of 70 g. The Gompertz model showed the lowest differences, both at birth (−66 g) and at 53 weeks of age (−28 g), and both in terms of mean error (3.4 g, LoA= −124.7-131.5 g), MAE (42.0 g), and MAPE (1.9%). A considerable underestimation of the observed weight between weeks 44 and 46 was present using all the equations.
Figure 2. Differences between mean observed and predicted values for the body weight (BW) of Toy Poodle dogs at different ages obtained by three different models.
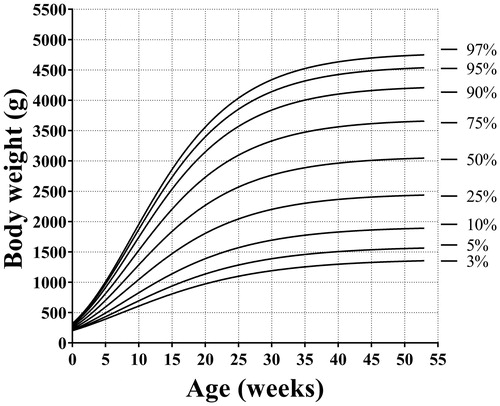
Based on the goodness of fit and accuracy indices, Gompertz was the best predictive model and, therefore, it was used to build the centile growth curves for males and females (Figures and ).
Figure 3. Growth chart percentiles for males Toy Poodle puppies.
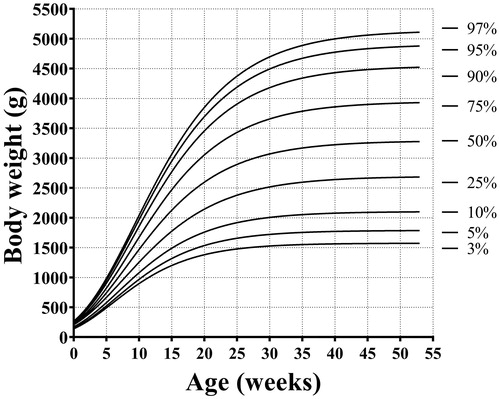
Figure 4. Growth chart percentiles for females Toy Poodle puppies.
Factors affecting BW from birth to 3 months (12 weeks)
The birth BW was influenced only by the mother's weight (b = 0.017, SE b = 0.007; p = .004). Thereafter, birth BW was a significant factor for BW at all ages (Tables and ). Table shows the factors affecting the weight of puppies during the first 4 weeks of life, at the 9th (weaning) and 12th week. Differences in BW between males and females were significant at 1 (p < .05) and 3 weeks of age (p < .01) as well as after weaning (p < .05; Table and 1SM). Up to 3 weeks, albeit discontinuously, a negative association was found between BW and litter size (p < .05). However, the effect of the litter size was not significant after the 4th week of age. At the beginning of weaning (weeks 3–4), the puppy’s weight negatively associated with the father's weight (p < .01). Afterwards, only the effects of sex (p < .05), birth weight (p < .01) and the mother's weight (p < .01) were found.
Table 4. Factors affecting the weight of puppies at different ages, from 1 week to 3 months of age (12 weeks).
Table 5. Fixed-effect estimates and significance for model of the predictors of adult body weight (b coefficient, standard error of b and significance of b).
Multivariable model predicting adult BW
The differences found in 3-month-old puppies remained significant until adulthood. Indeed, the adult BW of dogs was affected by their birth weight (p < .01) and by the mother’s BW (p < .01) while the BW of father and litter size were not significant (Table ). Intact males (3496 ± 196 g) had higher adult weight than intact females (2966 ± 161 g; p < .05) but they showed no difference compared to neutered animals (3194 ± 354 g and 2743 ± 539 g for neutered males and females, respectively). Twenty-four dogs were not sold before reaching 99% of their adult weight (T99 obtained by the Gompertz equation: 35.2 and 40.0 weeks for male and female, respectively) and, therefore, included in the professional management group. Their estimated adult weight (3087 ± 257 g) was lower in comparison to the estimated BW of the owner management group (3112 ± 172 g) but the p-value associated with its b coefficient was statistically not significant. Daily activity was also not significant. The MAE for the full model was 499 g (range = 32–1405 g), corresponding to 15.7% of observed mean BW.
A reduced model only including sex, birth weight and mother’s BW was built but its AICc indicated a worse fit than the full model (ΔAICc = 95.2).
Discussion
This study compared three different growth curves and proposed easy and applicable tools to monitor the growth and predict adult BW of Toy Poodles. One curve was constructed using the equation proposed by Hawthorne et al. (Citation2004) which has been used to describe BW changes in puppies of different breeds. The other two curves were constructed using the equations of Gompertz (Citation1825) and Brody (Citation1945) which have been widely used to describe the growth not only of several animal species, but also of tumours, bacteria and other biological phenomena (Engida Sado Citation2015; Tjørve and Tjørve Citation2017; Do and Miar Citation2019). The Gomertz model seemed to have the best fit for the growth patterns of Toy Poodles, and it should be recommended to monitor their growth and predict their adult BW.
Different results have been obtained in other species. In sheep, for example, some authors (Topal et al. Citation2004; Malhado et al. Citation2009) found the best fit by using Gompertz while others (Gbangboche et al. Citation2008; Hojjati and Hossein-Zadeh Citation2018) by Brody model. For the goats, García-Muñiz et al. (Citation2019) did not highlight differences in the performance of these two models while Waiz et al. (Citation2019) selected Brody. Forni et al. (Citation2009) reported a lower AIC by Gompertz model, but they concluded that Brody function represented the best way to describe the cattle growth based on standard deviance of fitting errors. Finally, Atil et al. (Citation2007) selected the logistic model for chickens while Sabbioni et al. (Citation2009) confirmed the applicability of the Gompertz model also to describe the growth of pigs.
Growth patterns in pets are less studied than in livestock species. Most of the previous studies on dogs (Hawthorne et al. Citation2004; Trangerud et al. Citation2007; Posada et al. Citation2014; Salt et al. Citation2017) evaluated the variations in growth patterns of different breeds but they did not compare the fitting of different equations. Among these, of particular interest is the study of Salt et al. (Citation2017) who, using a semi-parametric regression type model, also assessed the effect of neutering status and proposed size-specific rather than breed-specific curves. However, Hawthorne et al. (Citation2004) and Posada et al. (Citation2014) evaluated other toy breeds, using small sample sizes, and only using a logistic model. Vázquez et al. (Citation2012) collected data of several animal species, including dogs and cats, and estimated the performance of five nonlinear equations to model growth. The latter authors found the best fit for dogs using a modified Hill curve but got a high R2 by the Gompertz model (Vázquez et al. Citation2012). However, the breed of the dogs used to build the before mentioned model was not specified. Our results are consequently novel and fill a gap of knowledge in the pet literature.
The highest adult BW values for Toy Poodles were obtained by the Brody model, the lowest by the Hawthorne model. All three models recognised that the puppies achieved 50% of their adult weight at ∼11 weeks. This age is in agreement with Hawthorne et al. (Citation2004) while it is lower than the age reported by Posada et al. (Citation2014) for toy breeds. The time required to reach 99% of the adult weight calculated by Gompertz and Hawthorne models varied from 35 to 51 weeks, depending on sex. These findings are in line with previous reports (Hawthorne et al. Citation2004; Posada et al. Citation2014) while, in general, large dog breeds reach T99 later (Posada et al. Citation2014). The novelty of this study was the determination of the time required to reach 30% of adult BW, which was about 7 weeks of age.
The evaluation of the goodness of fit indicated that sex-specific curves were preferable to the global one for all the models tested. This result confirms the sexual dimorphism of Toy Poodles, which has to be clearly visible as requested by the breed standard (FCI Citation2015). As suggested by Salt et al. (Citation2017), separate models for neutering status would also be needed. However, in the present study, the low number of sterilised animals (11 out of 65) and the short-time monitoring (1 year of age) limited the analysis.
Gompertz and Hawthorne models calculated growth rates fluctuating between 11% and 19%, similar to other toy breeds (Hawthorne et al. Citation2004; Posada et al. Citation2014). All Gompertz, Brody and Hawthorne models confirmed an earlier maturation in males than females. However, unlike the other models, the adult weight estimated by the Brody equation was greater in females than in males and the values showed higher variability. Brody also showed the lowest estimated k values and the highest adult weights. Indeed, this model overestimated the adult BW by 11% compared to the observed mean, while the differences between observed and estimated values were less than 1% by Gompertz and around 2% by Hawthorne model, respectively. As a result, the Brody model provided an implausible value for the time necessary to reach 99% of the adult weight (78 weeks) suggesting its inapplicability.
The Gompertz was the best model also based on Akaike’s Information Criteria, coefficient of determination, and RMSE although the differences compared to Hawthorne in these values indicating the goodness of fit seem negligible. However, accuracy indices (i.e. the MAE) and diagnostic graphs (i.e. the residual plot) confirmed that the Gompertz model exhibited the best performance showing the lowest differences between observed and predicted values. Conversely, all the indices confirmed that the Brody model had the worst performance. Moreover, the age-dependent relationships between observed and predicted values also suggested a non-normal distribution of errors in Brody model. This could determine a bias in statistical inferences although robust fitting methods were used in the present study (Motulsky and Brown Citation2006; GraphPad Citation2014).
In regards to the goodness of fit, it should be also noted that the coefficients of determination reported in most previous works are > 0.9 (Hawthorne et al. Citation2004; Trangerud et al. Citation2007; Vázquez et al. Citation2012; Posada et al. Citation2014), higher than those obtained in this study. The different sample size and the different approach can explain this inconsistency. Anyway, it is also important to note that R2 is not an appropriate measure in the field of nonlinear fitting (Spiess and Neumeyer Citation2010).
Surprisingly, the mean observed values increased abruptly, deviating from the expected curve during the weeks 44–46. Afterwards, the gaps between expected and predicted values decreased, indicating that the BW changes were again consistent with the asymptotic phase of the curve. This variation may be due to the difference in growth patterns between males and females during those weeks, with males reaching the adult weight earlier than females. However, biases in the model fit may be also linked to the discontinuation of data collected from some owners which happened during that period. Another possible reason for this unpredicted increase in mean BW during the asymptotic phase could be due to the hidden effects of management or physiological changes. The previous weeks are, in fact, compatible with the time of sale or neutering of some dogs. Overall, even if our results relating to the growth curves are preliminary and need to be ascertained using a larger dataset over a longer period and separating the models for diverse combinations of demographic factors, we may conclude that (i) a sigmoidal curve describes better than an exponential one the growth of Toy Poodles and (ii) the Gompertz model is the most appropriate.
The second goal of the study was to propose simple and applicable tools for breeders and owners. One tool is useful to predict adult weight taking into account both extrinsic and intrinsic factors, and the other tools, the centile charts, are essential for monitoring the growth of the puppies based on their sex. Body weight was strongly affected by the sex and BW at birth, and in a minor extent by the parents’ BW and litter size. Their effects varied depending on the week of age (phase of growth), as was expected. Knowing the factors affecting the growth in the first 3 months of life is useful, considering that this is the period of maximal growth (Ardelean and Suteu, Citation2005). The same authors reported that management, including feeding of the bitches and the puppies before and after weaning, is crucial. The puppies in our study were managed in compliance with the guide of responsible dog breeding (AKC 2020). The genetics of both sire and dam were well known and mating planned to avoid genetic disease, low BW puppies were fed using fostering or artificial milk feeding, feeding during pregnancy and lactation was accurate, and weaning was gradual. This could explain the limited effects on the BW that BW at birth and litter size showed. The high standard of the breeder management which were continued by the new owners may also be the reason for the fact we failed to find a significant effect of daily activity and type of management on the adult BW. Consequently, our results highlight the importance of following the animal welfare standards and guidelines for dogs to ensure optimal growth, and good health and welfare (Department for Environment, Food and Rural Affairs Citation2017; Department of Primary Industries, Parks, Water and Environment Citation2020). However, it is worth noting that even if our predictive model was accurate and the study was conducted in a breeding centre where the management was appropriate, our results highlight that there was still a great individuality in the growth patterns of the examined Toy Poodles, confirming the current literature (Ardelean and Suteu Citation2005, Salt et al. Citation2017).
Considering this individuality, monitoring growth becomes a crucial practice of responsible ownership, and the centile curves are essential (Salt et al. Citation2017). The centiles, also used by the WHO Multicentre Growth Reference Study Group (Citation2006), are easier to understand and more practical to use than z-scores (Wang and Chen Citation2012). Indeed, the centile curves are a useful tool not only for professionals working in genetic improvement or veterinarians monitoring the growth but also for the owner who want to optimise their dog's management and feeding practices (Salt et al. Citation2017; Do and Miar Citation2019). In this regard, it is crucial to note that, despite the pathological consequences of obesity are widely recognised, its prevalence has increased over the years affecting 20–40% of the canine population. Often the owner fails to comply with dietary and exercise recommendations, but the owner could also be unable to identify or be reluctant to admit the obesity of its dog (Gossellin et al. Citation2007; Case et al. Citation2011). The best indicator for obesity is BCS (Laflamme Citation2006; Ricci et al. Citation2007). However, the assessment of BCS needs training and it may be challenging for owners; the owners’ underestimation of the BCS of their dogs was indeed found to be a risk factor for obesity (Laflamme Citation2006). Monitoring the growth of the puppies using the centile curves proposed and the weekly recording of their BW by breeders and owners may, therefore, be recommended as useful practices to prevent poor health and welfare in Toy Poodles.
Even if this study is the first to describe the growth curse of Toy Poodles, our results need to be interpreted with caution because the study was limited by several factors. First, all examined puppies were born in the same breeding centre and managed following the breeder’s instruction even after being sold. This limited the possible effects of the extrinsic factors usually affecting animal growth. Consequently, our data cannot be used as a predictive model of the breed before being ascertained in a bigger sample of dogs coming from a representative number of breeding centres. Secondly, not all the dogs were sold at the same age and some of the new owners did not weigh their dogs until the requested follow-up; moreover, the data reported by the new owners could have been less accurate and be responsible for the variability found. Thirdly, the effect of neutering could have been biased by the small sample size of the sprayed and castrated dogs and from the different ages of the surgery. Fourthly, the age and the parity of the bitches were not considered as a factor in our model due to the small sample size. Finally, we did not record the height at withers, which is one of the parameters of the gold standard of this breed. However, the withers height is taken by a judge during official expositions when the dog is already an adult with the only purpose of registering the dog in the herdbook. This measurement may also be more difficult to monitor for owners in comparison with the BW. Those are the reasons why we decided to not include it as a parameter. BW is instead extremely applicable to monitor the growth and the reason why we decided to focus on it. Notwithstanding the aforementioned limitations, this is the first study describing the growth of Toy Poodles proposing easy tools for monitoring their BW. Responsible ownership is one of the most important welfare requirements nowadays, so giving tools which allow the owners to monitor BW is crucial.
Conclusions
After comparing three different growth curves, this study showed that a sigmoidal curve, the Gompertz model, was the most appropriate to describe the growth of Toy Poodles. A simple model to predict adult BW and centile charts based on sex were also proposed as easy tools for breeders, owners and veterinarians to monitor growth and management of Toy Poodles. Further studies should be carried out including a larger number of puppies and breeding centres to validate our preliminary results at a breed level.
Author contributions
Conceptualisation, LM, BP, and LNC.; Methodology, FBF and LNC.; Formal Analysis, LM.; Data Curation, LM and LNC; Writing-Original Draft Preparation, LM and BP.; Writing-Review & Editing, B.P.and LNC; Supervision, LNC
Acknowledgements
The authors thank the breeder and all the owners for the collaboration in the collection of the weekly BW and Gregory Gal for editing the English.
Disclosure statement
The authors declare no conflict of interest.
References
- American Veterinary Medical Association. 2020. Guidelines for Responsible Pet Ownership [Internet]. [accessed 2020 Apr 22]. https://www.avma.org/policies/guidelines-responsible-pet-ownership
- Ardelean A, Suteu E. 2005. The estimation of the growth curve at dog. Bull Univ Agric Sci Vet Med Cluj-Napoca - Vet Med. 63:175–181.
- Atil H, Grossman M, Takma Ç. 2007. Comparison of growth curve models on average and individual body weights in chickens. Arch Fur Geflugelkd. 71(1):1–5.
- Bland JM, Altman DG. 1999. Measuring agreement in method comparison studies. Stat Methods Med Res. 8(2):135–160.
- Brody S. 1945. Bioenergetics and growth. New York, NY: Reinhold Publishing.
- Case L, Daristotle L, Hayek M, Raasch MF. 2011. Canine and feline nutrition. Maryland Heights, MO: Elsevier - Mosby.
- Conferenza Unificata Stato-Regioni e Stato-Citta’ 2013. d Autonomie Locali. ex art.8 D.L. n. 281, 1997. Italy: Gazzetta Ufficiale della Repubblica Italiana.
- Department for Environment, Food and Rural Affairs. 2017. Code of practice for the welfare of dogs. Department for Environment F and RA, editor. London, UK: APS Group.
- Department of Primary Industries, Parks, Water and Environment. 2020. Animal welfare standards and guidelines for dogs [Internet]. [accessed 2020 Apr 30]. https://dpipwe.tas.gov.au/Documents/AnimalWelfareGuideline_BreedingDogs.pdf.
- Do DN, Miar Y. 2019. Evaluation of growth curve models for body weight in American mink. Animals. 10(1):22.
- Engida Sado A. 2015. Application of Brody growth function to describe dynamics of breast cancer cells. AJAM. 3(3):138.
- Ente Nazionale Cinofilia Italiana 2020. Barboni [Internet]. [accessed 2020 Apr 30]. https://www.enci.it/libro-genealogico/razze/barboni
- FCI 2015. FCI-Standard N° 172 [Internet]. Thuin (Belgique). http://www.fci.be/Nomenclature/Standards/172g09-en.pdf
- Fitzhugh HA. 1976. Analysis of growth curves and strategies for altering their shape. J Anim Sci. 42(4):1036–1051.
- Forni S, Piles M, Blasco A, Varona L, Oliveira HN, Lôbo RB, Albuquerque LG. 2009. Comparison of different nonlinear functions to describe Nelore cattle growth. J Anim Sci. 87(2):496–506.
- France J, Dijkstra J, Dhanoa MS. 1996. Growth functions and their application in animal science. Anim Res. 45(Suppl. 1):165–174.
- Friedrichs KR, Harr KE, Freeman KP, Szladovits B, Walton RM, Barnhart KF, Blanco-Chavez J, American Society for Veterinary Clinical Pathology 2012. ASVCP reference interval guidelines: Determination of de novo reference intervals in veterinary species and other related topics. Vet Clin Pathol. 41(4):441–453.
- García-Muñiz JG, Ramírez-Valverde R, Núñez-Domínguez R, Hidalgo-Moreno JA. 2019. Dataset on growth curves of Boer goats fitted by ten non-linear functions. Data Br. 23
- Gbangboche AB, Glele-Kakai R, Salifou S, Albuquerque LG, Leroy PL. 2008. Comparison of non-linear growth models to describe the growth curve in West African Dwarf sheep. Animal. 2(7):1003–1012.
- German AJ. 2006. The growing problem of obesity in dogs and cats. J Nutr. 136(7 Suppl):1940S–1946S.
- Gompertz B. 1825. On the nature of the function expressive of the law of human mortality, and on a new mode of determining the value of life contingencies. Philos Trans R Soc Lond. 115:513–583.
- Gossellin J, Wren JA, Sunderland SJ. 2007. Canine obesity - an overview. J Vet Pharmacol Ther. 30(s1):1–10.
- GraphPad 2014. GraphPad Curve Fitting Guide [Internet]. San Diego, CA. http://www.graphpad.com/guides/prism/6/curve-fitting/index.htm?reg_the_differencese_between_linea.htm
- Hawthorne AJ, Booles D, Nugent PA, Gettinby G, Wilkinson J. 2004. Body-weight changes during growth in puppies of different breeds. J Nutr. 134(8 Suppl):2027S–2030S.
- Hojjati F, Hossein-Zadeh NG. 2018. Comparison of non-linear growth models to describe the growth curve of Mehraban sheep. J Appl Anim Res. 46(1):499–504.
- Laflamme, D. P. (2006). Understanding and managing obesity in dogs and cats. Veterinary Clinics: Small Animal Practice, 36(6), 1283–1295.
- Li J. 2017. Assessing the accuracy of predictive models for numerical data: Not r nor r2, why not? Then what? PLoS One. 12(8):e0183250.
- Malhado CHM, Carneiro PLS, Affonso P, Souza AAO, Sarmento J. 2009. Growth curves in Dorper sheep crossed with the local Brazilian breeds, Morada Nova, Rabo Largo, and Santa Inês. Small Rumin Res. 84(1-3):16–21.
- Menchetti L, Guelfi G, Speranza R, Carotenuto P, Moscati L, Diverio S. 2019. Benefits of dietary supplements on the physical fitness of German Shepherd dogs during a drug detection training course. PLoS One. 14(6):e0218275.
- Mila H, Grellet A, Feugier A, Chastant-Maillard S. 2015. Differential impact of birth weight and early growth on neonatal mortality in puppies. J Anim Sci. 93(9):4436–4442.
- Motulsky HJ, Brown RE. 2006. Detecting outliers when fitting data with nonlinear regression - a new method based on robust nonlinear regression and the false discovery rate. BMC Bioinformatics. 7(1):123.
- NRC. 2006. Nutrient requirements of dogs and cats/Ad Hoc committee on dog and cat. Washington, DC: National Academy Press.
- Posada OS, Gomez OL, Rosero NR. 2014. Application of the logistic model to describe the growth curve in dogs of different breeds. Rev MVZ Córdoba. 19(1): 4015–4022.
- Ricci R., F. Gottardo, J. C. Ferlito, A. Stefani, L. Ravarotto & I. Andrighetto. (2007) Body condition score (BCS) and metabolic status of shelter dogs, Italian Journal of AnimalScience, 6:sup1, 859–861, DOI: 10.4081/ijas.2007.1s.859
- Rogers SR, Pesti GM, Marks HL. 1987. Comparison of three nonlinear regression models for describing broiler growth curves. Growth, Dev Aging. 51(2):229–239.
- Sabbioni A, Beretti V, Manini R, Cervi C, Superchi P. 2009. Application of different growth models to “Nero di Parma” pigs. Ital J Anim Sci. 8(Supp 2):537–539.
- Salt C, Morris PJ, German AJ, Wilson D, Lund EM, Cole TJ, Butterwick RF. 2017. Growth standard charts for monitoring bodyweight in dogs of different sizes. PLoS One. 12(9):e0182064.
- Spiess AN, Neumeyer N. 2010. An evaluation of R2as an inadequate measure for nonlinear models in pharmacological and biochemical research: a Monte Carlo approach. BMC Pharmacol. 10(1):1–11.
- Stafford K. 2006. Canine nutrition and welfare. In: Stafford K: The welfare of dogs. The Netherlands: Springer. 83–100.
- Tesi M, Miragliotta V, Scala L, Aronica E, Lazzarini G, Fanelli D, Abramo F, Rota A. 2020. Relationship between placental characteristics and puppies’ birth weight in toy and small sized dog breeds. Theriogenology. 141:1–8.
- Tjørve KMC, Tjørve E. 2017. The use of Gompertz models in growth analyses, and new Gompertz-model approach: an addition to the Unified-Richards family. PLoS One. 12(6):e0178691.
- Topal M, Ozdemir M, Aksakal V, Yildiz N, Dogru U. 2004. Determination of the best nonlinear function in order to estimate growth in Morkaraman and Awassi lambs. Small Rumin Res. 55(1-3):229–232.
- Trangerud C, Grøndalen J, Indrebø A, Tverdal A, Ropstad E, Moe L. 2007. A longitudinal study on growth and growth variables in dogs of four large breeds raised in domestic environments. J Anim Sci. 85(1):76–83.
- Vázquez JA, Lorenzo JM, Fuciños P, Franco D. 2012. Evaluation of non-linear equations to model different animal growths with mono and bisigmoid profiles. J Theor Biol. 314:95–105.
- Waiz HA, Gautam L, Waiz SA. 2019. Appraisal of growth curve in Sirohi goat using non-linear growth curve models. Trop Anim Health Prod. 51(5):1135–1140.
- Wang Y, Chen HJ. 2012. Use of percentiles and Z-scores in anthropometry. In: Preedy VR, ed. Handbook of Anthropometry - Physical Measures of Human Form in Health and Disease. New York, NY: Springer.
- WHO Multicentre Growth Reference Study Group. 2006. WHO child growth standards: length/height-for-age, weight-for-age, weight-for-length, weight-forheight and body mass index-for-age: methods and development. WHO Child Growth Stand. http://hpps.kbsplit.hr/hpps-2008/pdf/dok03.pdf