
 ?Mathematical formulae have been encoded as MathML and are displayed in this HTML version using MathJax in order to improve their display. Uncheck the box to turn MathJax off. This feature requires Javascript. Click on a formula to zoom.
Abstract
The objective of this study was to use pedigree analysis to describe the population structure, genetic variability and inbreeding to quantify their effects on growth traits in Shall sheep. The analysis was based on the pedigree information of 64,964 animals. Data and pedigree information used in this study were collected from 1982 to 2012 by the Animal Breeding Centre of Iran. Growth traits included were birth weight (n = 12,786), 3-month weight (n = 9521), 6-month weight (n = 5106), average daily gain from birth to three- (n = 8543) and 6-month of age (n = 4,303) and their corresponding Kleiber ratios (n = 8543; n = 4,303, respectively). The CFC program was applied to calculate pedigree statistics and the population genetic structure of the Shall sheep. Also, the INBUPGF90 program was used for calculating inbreeding coefficients for individuals. The pedigree analysis indicated that the inbreeding coefficient ranged from 0 to 38% with an average of 1.62%. The average coancestry was 0.0072% and the generation interval was 3.755 years. Inbreeding depression was observed for all growth traits in this population of sheep. Based on the estimate of effective population size (910.25), it is expected to have enough genetic variability in the understudy population. On the other hand, the ratio of the effective number of founders to the effective number of ancestors (1.001) indicated no genetic bottleneck in Shall sheep. Breeders must do their best to prevent the mating between closely related animals and use this as an appropriate strategy to maintain the inbreeding under control in this sheep breed.
The average coefficients of inbreeding and coancestry were low in Shall sheep.
Enough genetic variability was available in Shall sheep and no genetic bottleneck occurred in this population.
Inbreeding depression was observed for growth traits in this population of sheep.
HIGHLIGHTS
Introduction
Efficacious management of genetic resources in livestock needs complete information on the features of breeds, including knowledge on actual and effective population size and structure, within and between breed genetic diversity, geographical dissemination and breeds’ production environment (Groeneveld et al. Citation2010). Keeping the genetic diversity of a population is generally obtained by minimising the inbreeding rate or by maximising the effective population size (Rodríguez-Ramilo et al. Citation2019). The happening of likely changes in the distribution of genetic variability within and between subpopulations would be investigated by the evaluation of population structure. The population structure is ascertained by the frequency of alleles that form the various genotypes of the individuals included in it (Barros et al. Citation2017).
A complete pedigree is important in studies of population structure in farm animals to evaluate accurately the main relevant parameters such as inbreeding and coancestry coefficients, genetic diversity, effective population size, the effective number of founders and non-founders, founder genome equivalent, generation interval and the number of discrete generation equivalents (Martínez et al. Citation2008; Ghavi Hossein-Zadeh Citation2016). An incomplete pedigree or lack of sufficient information in the pedigree can lead to false interpretations and result in under-estimation or over-estimation of main population parameters (Goyache et al. Citation2003; Ghavi Hossein-Zadeh Citation2016).
Mating between genetically related individuals would result in inbreeding. The consequence of mating between relatives is inbreeding depression and a decline in the performance of animals, especially for reproduction and fitness characters which have generally greater sensitivity to inbreeding depression due to their low heritability compared with growth-related traits (McParland et al. Citation2007).
The Shall sheep is a local genetic resource of Iran with a population of more than 600,000 heads. This breed is distributed throughout the Qazvin Province in the north-west of the country. The coat colour of this breed is mostly black or brown with white spots in front of the head, and the breed has good adaptability to unsuitable climate conditions. The Shall sheep, as a large-sized fat-tailed breed, is reared principally for meat production, but the sale of excess lambs is the principal source of income for breeders (Ghavi Hossein-Zadeh Citation2013, Citation2015). There are different reports in the literature on the population genetic structure of sheep breeds (Pedrosa et al. Citation2010; Ghavi Hossein-Zadeh Citation2012a; Eteqadi et al. Citation2014; Yavarifard et al. Citation2014; Barros et al. Citation2017; Figueredo et al. Citation2019; Kiya et al. Citation2019; Vatankhah et al. Citation2019), but there were no published reports of population structure analysis in Shall sheep. Therefore, the main objective of this study was to describe the population structure, genetic variability and inbreeding in Shall sheep of Iran using pedigree analysis. The other objective was to quantify the effect of inbreeding on growth traits in this breed of sheep. The genealogical data for the Iranian Shall sheep would provide important and practical insights into how to manage and keep the genetic variability within the entire population and would help to progress the breeding programs in this breed of sheep.
Material and methods
Data set and pedigree information
Data and pedigree information was obtained from the Animal Breeding Centre of Iran from 1982 to 2012. The initial pedigree file included 90,280 animals. The detailed description of animal management in the flocks was reported in previous studies (Amou Posht-e-Masari et al. Citation2013; Ghavi Hossein-Zadeh Citation2015).
The growth traits included were: birth weight (BW, n = 12,786), 3-month weight (3MW, n = 9521), 6-month weight (6MW, n = 5106), average daily gain from birth to 3- (ADG1, n = 8543) and 6-month of age (ADG2, n = 4303) and their corresponding Kleiber ratios (KR1, n = 8543; KR2, n = 4303, respectively). Summary statistics for growth traits in Shall sheep are presented in Table . The Kleiber ratios were calculated as follows:
Table 1. Summary statistics for growth traits in Shall sheep.
The Kleiber ratio, as a helpful measure of growth rate, was proposed to be an indirect selection criterion for feed efficiency in farm animals (Scholtz and Roux Citation1988).
The CFC 1.0 program (Sargolzaei et al. Citation2006) was applied to calculate pedigree statistics including probabilities of gene origin and genetic structure analysis of the Shall sheep. Also, this program was used to control the pedigree for likely errors such as repeated identification, cycling pedigrees, registration numbers of offspring lower than the numbers of their parents and individuals appearing as both sires and dams. All of these errors were deleted after identification. After editing, the pedigree file included the records of 64,964 lambs born from 720 sires and 18,345 dams. The INBUPGF90 program (Aguilar and Misztal Citation2008) was applied for measuring inbreeding coefficients of individuals in the pedigree using a recursive algorithm presuming non-zero inbreeding for unknown parents. There were totally 2945 full-sib groups with an average family size of 2.13 in the pedigree of Shall sheep.
Average inbreeding coefficient and inbreeding change
The average coefficient of inbreeding at a given generation t could be calculated as follows (Falconer and Mackay Citation1996):
where
is new inbreeding or the change in inbreeding from one generation to the next. This parameter was estimated as follows:
where b is the regression coefficient of the average inbreeding on the birth year, L is the generation interval in the understudy population and Ft is the average inbreeding in the last year.
Effective population size and generation interval
The estimate of the effective number (Ne) (Gutiérrez et al. Citation2008) can be calculated by the following formula:
The average age of the parents (sires and dams) at the birth of their offspring is used to estimate the generation interval (L).
Probability of gene origin
The effective number of founders (fe) accounts for unequal founder representation and estimated as follows (Lacy Citation1989):
where
is the expected proportional genetic contribution of founder i, calculated by the average relationship of the founder to each animal in the current population, and n is the total number of founders.
The founder genome equivalent (fg) which considers bottlenecks, genetic drift and unequal founder contributions, can be estimated using the following formula:
where
is the expected proportion of founder i’s alleles which remain in the current population (Lacy Citation1989). The effective number of non-founders (
) is estimated as:
The effective number of ancestors (fa) is calculated by the minimum number of ancestors that justify the total genetic diversity of the population (Boichard et al. Citation1997), and was estimated as:
where pj is the marginal contribution of the jth ancestor. The marginal contribution is defined as the surplus genetic contribution offered by an ancestor that was not justified by another formerly selected ancestor (Gutiérrez and Goyache Citation2005).
The ratio between the effective number of founders and ancestors () is associated with the amount of genetic bottleneck. The ratios equal or close to one, show no genetic bottleneck whereas ratios greater than one show a likely genetic bottleneck in the population. In the latter case, an effective number of founders is proposed to be larger than the effective number of ancestors in the population (Gutiérrez and Goyache Citation2005).
Number of discrete generation equivalents
The number of discrete generation equivalents () is a parameter to evaluate the pedigree depth in the reference population. This parameter indicated the expected number of generations from the base population to the reference population if generation advanced discretely (Woolliams and Mantysaari Citation1995) and can be estimated as follows:
where
is the total number of ancestors of animal j in the reference population,
is the number of generations between animal j and its ancestor
and N is the number of animals in the reference population (Woolliams and Mantysaari Citation1995).
Genetic structure
The F-statistics of FIT, described by Wright (Citation1965), provides summary information related to the structure of the population under study and measures the deviation of the genotype frequencies of the population in relation to the Hardy–Weinberg equilibrium, which was calculated as follows:
where F and AC are average inbreeding and coancestry in total population, respectively.
Effects of inbreeding on growth characteristics
The inbreeding depression was calculated as a partial linear regression coefficient of growth traits on inbreeding estimated by using the Average Information Restricted Maximum Likelihood (AIREML) algorithm of the Wombat program (Meyer Citation2007) by fitting six single-trait animal models which ignore or include additive direct and maternal genetic and permanent environmental effects. The GLM procedure of the SAS program (Version 9.1, 2003, SAS Inst. Incorporation, Cary, NC) was used for detecting the fixed factors which had a significant effect on the investigated traits. After data verification, defective and doubtful records were deleted (e.g. records higher or lower than three standard deviations from the mean of the growth traits were excluded). The model of analysis for BW included the fixed class effects of the flock, lambing year, lamb’s sex (in two classes: male and female), birth type (in three classes: single, twin and triplet), dam age at lambing (in six classes: from 2 through 7-years-old), interaction effects between lamb’s sex and birth type, and between dam age and birth type. The models of analysis for 3MW and 6MW included the fixed class effects of the flock, lambing year and month, lamb’s sex, dam age at lambing, interaction effects between lamb’s sex and dam age, and between dam age and birth type. The model of analysis for ADG1 included the fixed class effects of the flock, lambing year and month, lamb’s sex, dam age at lambing and interaction effect between dam age and birth type. The model of analysis for ADG2 included the fixed class effects of the flock, lambing year and month, lamb’s sex and dam age at lambing. The model of analysis for KR1 included the fixed class effects of flock, lambing year and month, lamb’s sex, dam age at lambing and interaction effect between lamb’s sex and birth type. Also, the model of analysis for KR2 included the fixed class effects of flock, lambing year and month and interaction effect between lamb’s sex and dam age at lambing. The linear effect of the inbreeding coefficient was fitted as a covariable in all models of analysis. Also, the age of the animal at weighing was a covariate effect which significantly affected on 3MW and 6MW. Inbreeding trend over the years was estimated using the linear regression of individual inbreeding on the birth year using the Reg procedure of SAS (Version 9.1, 2003, SAS Inst. Incorporation, Cary, NC; SAS Institute Inc. Citation2003).
Results
Population parameters of Shall sheep obtained from the pedigree analysis are shown in Table . Average inbreeding and coancestry coefficients were 1.62% and 0.0072% in this breed of sheep. The new inbreeding or change in inbreeding from one generation to the next one was 0.0005493 and the overall generation interval was 3.775 years in the studied population. The effective population size was 910.25 in Shall sheep. The ratio of the effective numbers of founders and ancestors
was equal to unity and founder genome equivalent was lower than the fe and fa values. Average number of discrete generation equivalents (ge) was 0.458568 in Shall sheep. The FIT coefficient was estimated to be 0.016 in the pedigree of Shall sheep. Pedigree completeness up to three generations back in Shall sheep is shown in Figure . The first ancestor generation of all animals was 22.14% sire and 53.71% dam complete. The inbreeding trend over the years in Shall sheep was depicted in Figure . The trend of inbreeding was positive over the years (p > .05) and its estimate was 0.000146 ± 0.000182. The average inbreeding was 0 until 1984, but after that, indicated abrupt variations. The pedigree analysis indicated that the inbreeding rate varied from 0 to 38% and 88.54% of animals had a low inbreeding coefficient (0<F
0.05).
Figure 1. Pedigree completeness up to three generations back in Shall sheep. GD: Grand dam, GS: Grand sire, GGD: Grand-grand dam, GGS: Grand-grand sire.
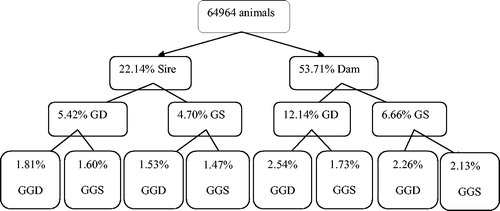
Figure 2. Inbreeding trend over the years in Shall sheep.
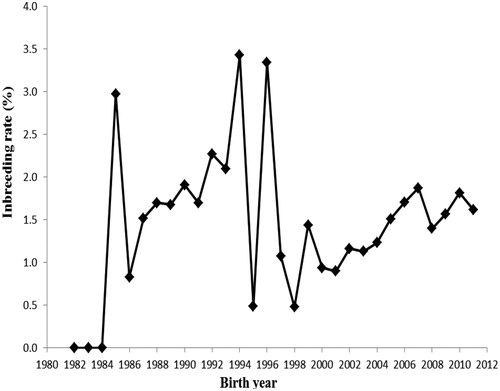
Table 2. Population parameters of Shall sheep obtained from pedigree analysis.
Table shows the regression coefficients of growth traits on the inbreeding of lambs for a change of one percent in inbreeding. The regression coefficients of BW, 3MW, 6MW, ADG1, ADG2, KR1, and KR2 on lamb inbreeding were estimated to be −0.965 ± 0.288 (p < .01), −9.740 ± 2.120 (p < .0001), −8.697 ± 3.499 (p < .05), −0.156 ± 0.024 (p < .0001), −0.039 ± 0.024 (p < .05), −0.0008 ± 0.0002 (p < .01) and −0.0004 ± 0.0001 (p < .01), respectively; therefore, all growth traits decreased due to one percent increase in inbreeding in this population of sheep. Considering the sex of lambs, except for the positive effect of inbreeding on ADG2 in male lambs which was not significant, negative regression coefficients observed for other growth traits in both sexes (Table ).
Table 3. Regression coefficients (±SE) of growth traits on inbreeding of Shall lambs for a change of one percent in inbreeding.
Discussion
The genetic diversity preservation is a major goal in the process of managing animal populations kept for conservation and breeding plans (Fernández et al. Citation2005). Consequently, the description of genetic variability and genetic structure is mandatory (Goyache et al. Citation2003). Effective population size, as a suitable measure of genetic loss, has been regularly used for monitoring genetic diversity in animal populations because it has an opposite association with inbreeding (Oliveira et al. Citation2016). The breed extinction hazard also would be assessed by these parameters. Compared with molecular technologies, pedigree analysis is the cheapest and easiest method to evaluate genetic diversity and population structure parameters in a specified breed over generations or for a given time period (Gutiérrez et al. Citation2003). Although studies based on pedigree data are available for different sheep breeds in the literature, there is no report of population structure analysis in Shall sheep, as one of the main fat-tailed sheep breeds of Iran, based on pedigree analysis.
The effective population size in this sheep breed (910.25) was greater than that reported by Barros et al. (Citation2017) in Segureña sheep (46.55), by Vatankhah et al. (Citation2019) in Lori–Bakhtiari sheep (144.13), by Kiya et al. (Citation2019) in Dorper sheep (83.07), and by McManus et al. (Citation2019) in Brazilian Morada Nova hair sheep (31.45). The number of animals that mate in an ideal population determines the effective size of the population and provides the same inbreeding increase in the studied population (Hill Citation1979; Ghavi Hossein-Zadeh Citation2016). The method for calculating effective population size in the current study does not rely on the mating policy in the whole reference population, but on the matings performed all over an individual’s pedigree (Gutiérrez et al. Citation2008; Eteqadi et al. Citation2014). Effective population size in the range from 500 to 5000 is proposed by biologists to conserve the evolutionary potentiality of natural populations (Frankham et al. Citation2002; Ghavi Hossein-Zadeh Citation2016). Based on the FAO recommendation, the effective size of a population of more than 50 animals is necessary to preserve genetic variability (FAO Citation2007). The estimate of Ne for the Shall sheep was much greater than the above recommendations. Therefore, it is expected to have enough genetic variability in this breed of sheep. Effective population size reduction, as a direct outcome of a decrease in genetic diversity, connects with different disadvantageous events such as inbreeding depression in fitness characters and an increased fluctuation in response to selection (Falconer and MacKay Citation1996).
The average coefficients of inbreeding and coancestry were low in Shall sheep. Average inbreeding in this sheep breed (1.62%) was greater than the values reported for Guilan sheep (0.15%, Eteqadi et al. Citation2014), Segureña sheep (0.60%, Barros et al. Citation2017), Dorper sheep (0.32%, Kiya et al. Citation2019) and Lori–Bakhtiari sheep (1.26%, Vatankhah et al. Citation2019), but was lower than the average inbreeding rate in Moghani sheep (2.93%, Ghavi Hossein-Zadeh Citation2012a), Mehraban sheep (1.69%, Yavarifard et al. Citation2014), Brazilian Morada Nova hair sheep (6.73%, McManus et al. Citation2019), and French dairy sheep (2.34–3.11%, Rodríguez-Ramilo et al. Citation2019). The range of inbreeding in the current sheep population (from 0 to 38%) indicated that some matings of close relatives happened, but the number of these types of matings was generally low. The percentage of inbred animals (F > 0) was 88.54% in the current sheep population which may quickly result in an increment of the average inbreeding rate in the population if no definite or designed system of mating among animals is supplied to prevent the inbreeding. Most breeding plans may attempt to minimise inbreeding accumulation and calculate the increase by measuring the new inbreeding or change in inbreeding per generation (ΔF) (Boichard et al. Citation1997) in order to restrict the likely negative impact of inbreeding on different traits (Eteqadi et al. Citation2014). A similar expanding trend for inbreeding was obtained by Barczak et al. (Citation2009), Ghavi Hossein-Zadeh (Citation2012a), Eteqadi et al. (Citation2014), Yavarifard et al. (Citation2014), Kiya et al. (Citation2019) and Vatankhah et al. (Citation2019) in multi-breed sheep population, Moghani, Guilan, Mehraban, Dorper and Lori–Bakhtiari sheep breeds, respectively. The sharp and or irregular change of inbreeding in some years could result from the variations in the number of equivalent generations (Santana et al. Citation2011; Ghavi Hossein-Zadeh Citation2016). The sharp increase in the inbreeding rate in some years could be due to the decline in the number of sires used. In addition, some animals within the understudy population might have high inbreeding, implying the severe use of a small number of sires for matings. A low rate of inbreeding in some years would be because of the lack of selection of superior sires in this sheep population (Eteqadi et al. Citation2014). Pedigree completeness and its depth along with the intensity of selection are factors that greatly determine the inbreeding level in an animal population (Barczak et al. Citation2009; Eteqadi et al. Citation2014). The intensity of selection is frequently enhanced by applying the reproductive technologies being focussed on a small number of higher-ranking animals (particularly sires) and the use of modern genetic evaluation procedures (Ghavi Hossein-Zadeh Citation2012b; Ghavi Hossein-Zadeh Citation2016). Populations reconstruct from slight founder numbers show a high level of inbreeding, which in this case the pedigree incompleteness would greatly determine the accuracy (Barczak et al. Citation2009; Eteqadi et al. Citation2014). Generally, two types of pedigree errors would influence the outputs of genetic evaluations: wrong and or missing pedigree information (Harder et al. Citation2005; Ghavi Hossein-Zadeh Citation2016). The influence of pedigree errors on decreasing genetic gain is great. It was reported that the wrong pedigree impact is 1.4 times more deleterious than the impact of missing pedigree; although missing parents result in significant underestimation of inbreeding (Sanders et al. Citation2006; Ghavi Hossein-Zadeh Citation2016).
Consistent with the low average coancestry between animals in this breed of sheep (0.0072%), Eteqadi et al. (Citation2014), Yavarifard et al. (Citation2014) and Rochus and Johansson (Citation2017) reported low levels of coancestry in Guilan, Mehraban and Gute sheep breeds, respectively. The average coancestry coefficient could be applied for inbreeding coefficient prediction at subsequent generation; therefore, this parameter would be considered in animal breeding plans (Eteqadi et al. Citation2014). Low level of coancestry in a population can lead to high genetic diversity and due to the increase of variance between animals; it will result in the enhancement in response to selection. Therefore, one of the appropriate methods for maintaining genetic variability is to minimise the average coancestry in a population (Martínez et al. Citation2008; Ghavi Hossein-Zadeh Citation2016).
The high values of fe (8372.39) and fa (8366.46) indicate that the reference population was derived from a great proportion of genetic variability in the base population, which can prevent the loss of rare alleles and occurring genetic bottleneck in the current population of sheep. Also, this could be indicated the balanced contribution of parents for generating the subsequent generations. The effective number of founders estimates the total founder presentation in a controlled population, considering the genetic variation loss resulted from an unbalanced contribution of founders (Eteqadi et al. Citation2014; Ghavi Hossein-Zadeh Citation2016). Also, the founder genome equivalent provides complementary details to the conventional estimates of the Ne and the evolution of inbreeding rates (Ghavi Hossein-Zadeh Citation2016). The shows that whether founder animals were contributed in a balanced manner or not. The values of this ratio greater than one indicate the decline in the number of sires, the increase in inbreeding rate, and finally the decrease in the genetic variability and consequent genetic bottleneck (Silva et al. Citation2016; Vatankhah et al. Citation2019). The
ratio obtained in this study (1.001) would be considered as ideal value for this parameter, proposes that nearly all of ancestors in the current sheep population were the founders, indicating no genetic bottleneck. Greater
ratios were reported by Pedrosa et al. (Citation2010), Barros et al. (Citation2017), Figueredo et al. (Citation2019), Kiya et al. (Citation2019), Vatankhah et al. (Citation2019) in Santa Inês (1.35), Segureña (1.12), Brazilian Somali (1.18), Dorper (1.09) and Lori–Bakhtiari (1.11) sheep breeds, respectively. Similar to the result of this study, McManus et al. (Citation2019) obtained the value of one for
ratio in Brazilian Morada Nova hair sheep. Similar to the low estimate of FIT statistics in the pedigree of Shall sheep, Barros et al. (Citation2017), Figueredo et al. (Citation2019) and McManus et al. (Citation2019) reported low values for this statistics in Segureña sheep (0.006), Brazilian Somali sheep (0.069) and Brazilian Morada Nova hair sheep (0.060), respectively. The low value of FIT suggests the presence of gene flow among the flocks which may result from the sharing of rams or the application of artificial insemination. This prevents the formation of subpopulations. Also, this low value could be explained by the low average inbreeding (1.62%) in the pedigree of Shall sheep and indicates that allele fixation by homozygosis is not happening in this population (Barros et al. Citation2017).
The generation interval of Shall sheep (3.775 years) in this study was lower than the reports of Gowane et al. (Citation2013), Barros et al. (Citation2017), Kiya et al. (Citation2019), Vatankhah et al. (Citation2019) in Bharat Merino (4.95 years), Segureña (3.79 years), Dorper (4.0 years) and Lori–Bakhtiari (4.11 years) sheep breeds, respectively; but was greater than the reports of Pedrosa et al. (Citation2010), Eteqadi et al. (Citation2014), Yavarifard et al. (Citation2014), Rochus and Johansson (Citation2017), CitationFigueredo et al. (2019) and McManus et al. (Citation2019) in Santa Inês (3.70 years), Guilan (2.85 years), Mehraban (2.15 years), Gute (3.60 years), Brazilian Somali (3.53 years) and Brazilian Morada Nova (3.60 years) sheep breeds, respectively. The possible reasons for different estimates of generation interval for various sheep breeds were because of the differences in breeding plans and culling/replacement strategies in the corresponding populations (Vatankhah et al. Citation2019). Lower generation intervals would result in a greater annual genetic gain for economic traits in animal breeding programs; but, on the other hand, the short time of keeping the rams in the flock causes the least contribution of these animals and this leads to losses in genetic variability. Therefore, it is necessary to find a balance between genetic variation conservation programs and animal breeding plans to reach a generation interval that result in appropriate response to selection while at the same time guaranteeing the continuance of genetic variation.
In this study, inbreeding had a negative effect on the growth traits of Shall sheep. Similar to the results of this study, several studies reported an inbreeding depression for growth traits in different sheep breeds (Analla et al. Citation1998; Carolino et al. Citation2004; Pedrosa et al. Citation2010; Selvaggi et al. Citation2010; Ghavi Hossein-Zadeh Citation2012a; Eteqadi et al. Citation2014; Yavarifard et al. Citation2014; Eteqadi et al. Citation2017). Barros et al. (Citation2017) and Kiya et al. (Citation2019) did not find a significant effect of inbreeding on growth traits of different sheep breeds. Yavarifard et al. (Citation2017) estimated both significant and non-significant effects of inbreeding on daily weight gain and Kleiber ratio traits in Mehraban sheep. In contrary to the results of this study, Eteqadi et al. (Citation2017) obtained a positive effect of inbreeding on ADG2, KR1, and KR2 in Guilan sheep. As pointed out by Ghavi Hossein-Zadeh (Citation2012a), different variables are existent which determine the effect of inbreeding on growth traits. Generally, both positive and negative inbreeding impacts could be observed in the same population, as well as similar characteristics being influenced in various ways (Barczak et al. Citation2009; Selvaggi et al. Citation2010; Eteqadi et al. Citation2014). The variations observed regarding to the influence of inbreeding on growth traits may be assigned to different allele segregation among breeds, genetic variability in the base population with one or more unknown parents, breeding method, and the diversity and origin of the contributed founders in the under study populations (Eteqadi et al. Citation2014; Kiya et al. Citation2019).
Conclusions
The population genetic structure analysis of the Shall sheep provides important and practical information into how to control and keep the genetic variability in this population of sheep. The estimate of effective population size showed that enough genetic variability is present in this breed of sheep. Therefore, the pedigree analysis showed no signs of genetic variation loss or bottleneck in this breed. Although the level of inbreeding was low in this sheep population, inbreeding was currently a possible reason for the decrease in the growth performance of Shall sheep because all growth traits decreased due to a 1% increase in inbreeding in this population of sheep. Breeders must do their best to prevent mating between closely related animals and use this as an appropriate strategy to maintain the inbreeding under control in this sheep breed.
Acknowledgement
The authors thank the Animal Breeding Center of Iran for providing the data used in this study.
Disclosure statement
No potential conflict of interest was reported by the author(s).
References
- Aguilar I, Misztal I. 2008. Technical note: recursive algorithm for inbreeding coefficients assuming nonzero inbreeding of unknown parents. J Dairy Sci. 91(4):1669–1672.
- Amou Posht-e-Masari H, Shadparvar AA, Ghavi Hossein-Zadeh N, Hadi Tavatori MH. 2013. Estimation of genetic parameters for reproductive traits in shall sheep. Trop Anim Health Prod. 45(5):1259–1263.
- Analla M, Montilla JM, Serradilla JM. 1998. Analyses of lamb weight and ewe litter size in various lines of Spanish Merino sheep. Small Rumin Res. 29(3):255–259.
- Barczak E, Wolc A, Wójtowski J, Ślósarz P, Szwaczkowski T. 2009. Inbreeding and inbreeding depression on body weight in sheep. J Anim Feed Sci. 18(1):42–50.
- Barros EA, Brasil LHA, Tejero JP, Delgado-Bermejo JV, Ribeiro MN. 2017. Population structure and genetic variability of the Segureña sheep breed through pedigree analysis and inbreeding effects on growth traits. Small Rumin Res. 149:128–133.
- Boichard D, Maignel L, Verrier É. 1997. The value of using probabilities of gene origin to measure genetic variability in a population. Genet Sel Evol. 29(1):5–23.
- Carolino N, Lopes S, Gama L. 2004. Inbreeding and inbreeding depression in a Churra Badana sheep flock. Arch Zootecn. 53:229–232.
- Eteqadi B, Ghavi Hossein-Zadeh N, Shadparvar AA. 2014. Population structure and inbreeding effects on body weight traits of Guilan sheep in Iran. Small Rumin Res. 119(1–3):45–51.
- Eteqadi B, Ghavi Hossein-Zadeh N, Shadparvar AA. 2017. Inbreeding effects on average daily gains and Kleiber ratios in Guilan province sheep. Anim Prod Res. 6(3):43–52.
- Falconer DS, Mackay TFC. 1996. Introduction to quantitative genetics. 4th ed. Harlow (UK): Longman Group Ltd.
- FAO. 2007. The state of the world’s animal genetic resources for food and agriculture. Rome (Italy): FAO.
- Fernández J, Villanueva B, Pong-Wong R, Toro MA. 2005. Efficiency of the use of pedigree and molecular marker information in conservation programs. Genetics. 170(3):1313–1321.
- Figueredo JS, Cruz JF, Sousa LS, Teixeira Neto MR, Carneiro PLS, Brito ND, Pinheiro RGS, Lacerda KSO, Mottin VD. 2019. Genetic diversity and population structure estimation of Brazilian Somali sheep from pedigree data. Small Rumin Res. 179:64–69.
- Frankham R, Ballou JD, Briscoe DA. 2002. Introduction to conservation genetics. Cambridge, UK: Cambridge University Press.
- Ghavi Hossein-Zadeh N. 2012a. Inbreeding effects on body weight traits of Iranian Moghani sheep. Arch Anim Breed. 55(2):171–178.
- Ghavi Hossein-Zadeh N. 2012b. Bayesian estimates of genetic changes for body weight traits of Moghani sheep using Gibbs sampling. Trop Anim Health Prod. 44(3):531–536.
- Ghavi Hossein-Zadeh N. 2013. Inbreeding effects on average daily gains and Kleiber ratios in Iranian Moghani sheep. Iranian J Appl Anim Sci. 3(3):545–551.
- Ghavi Hossein-Zadeh N. 2015. Modeling the growth curve of Iranian Shall sheep using non-linear growth models. Small Rumin Res. 130:60–66.
- Ghavi Hossein-Zadeh N. 2016. Analysis of population structure and genetic variability in Iranian buffaloes (Bubalus bubalis) using pedigree information. Anim Prod Sci. 56(7):1130–1135.
- Gowane GR, Prakash V, Chopra A, Prince LLL. 2013. Population structure and effect of inbreeding on lamb growth in Bharat Merino sheep. Small Rumin Res. 114(1):72–79.
- Goyache F, Gutierrez JP, Fernandez I, Gomez E, Alvarez I, Diez J, Royo L. 2003. Using pedigree information to monitor genetic variability of endangered populations: the Xalda sheep breed of Asturias as an example. J Anim Breed Genet. 120(2):95–105.
- Groeneveld LF, Lenstra JA, Eding H, Toro MA, Scherf B, Pilling D, Negrini R, Finlay EK, Jianlin H, Groeneveld E, et al. 2010. Genetic diversity in farm animals – a review. Anim Genet. 41(1):6–31.
- Gutiérrez JP, Altarriba J, Diaz C, Quintanilla R, Canon J, Piedrafita J. 2003. Pedigree analysis of eight Spanish beef cattle breeds. Genet Sel Evol. 35(1):43–63.
- Gutiérrez JP, Cervantes I, Molina A, Valera M, Goyache F. 2008. Individual increase in inbreeding allows estimating effective sizes from pedigrees. Genet Sel Evol. 40(4):359–378.
- Gutiérrez JP, Goyache F. 2005. A note on ENDOG: a computer program for analysing pedigree information. J Anim Breed Genet. 122(3):172–176.
- Harder B, Bennewitz J, Reinsch N, Mayer M, Kalm E. 2005. Effect of missing sire information on genetic evaluation. Arch Anim Breed. 48(3):219–232.
- Hill WG. 1979. A note on effective population size with overlapping generations. Genetics. 92(1):317–322.
- Kiya CK, Pedrosa VB, Muniz KFA, Gusmão AL, Batista LFP. 2019. Population structure of a nucleus herd of Dorper sheep and inbreeding effects on growth, carcass, and reproductive traits. Small Rumin Res. 177:141–145.
- Lacy RC. 1989. Analysis of founder representation in pedigrees: founder equivalents and founder genome equivalents. Zoo Biol. 8(2):111–123.
- Martínez RA, García D, Gallego JL, Onofre G, Pérez J, Cañón J. 2008. Genetic variability in Colombian Creole cattle populations estimated by pedigree information. J Anim Sci. 86(3):545–552.
- McManus C, Facó O, Shiotsuki L, Jivago de Paula Rolo JL, Peripolli V. 2019. Pedigree analysis of Brazilian Morada Nova hair sheep. Small Rumin Res. 170:37–42.
- McParland S, Kearney JF, Rath M, Berry DP. 2007. Inbreeding effects on milk production, calving performance, fertility, and conformation in Irish Holstein-Friesians. J Dairy Sci. 90(9):4411–4419.
- Meyer K. 2007. WOMBAT: a tool for mixed model analyses in quantitative genetics by restricted maximum likelihood (REML). J Zhejiang Univ Sci B. 8:815–821.
- Oliveira RR, Brasil LHA, Delgado JV, Peguezuelos J, León JM, Guedes DGP, Arandas JKG, Ribeiro MN. 2016. Genetic diversity and population structure of the SpanishMurciano–Granadina goat breed according to pedigree data. Small Rumin Res. 144:170–175.
- Pedrosa VB, Santana ML, Jr Oliveira PS, Eler JP, Ferraz JBS. 2010. Population structure and inbreeding effects on growth traits of Santa Inês sheep in Brazil. Small Rumin Res. 93(2–3):135–139.
- Rochus CM, Johansson AM. 2017. Estimation of genetic diversity in Gute sheep: pedigree and microsatellite analyses of an ancient Swedish breed. Hereditas. 154:4.
- Rodríguez-Ramilo ST, Elsen JM, Legarra A. 2019. Inbreeding and effective population size in French dairy sheep: comparison between genomic and pedigree estimates. J Dairy Sci. 102(5):4227–4237.
- Sanders K, Bennewitz J, Kalm E. 2006. Wrong and missing sire information affects genetic gain in the Angeln dairy cattle population. J Dairy Sci. 89(1):315–321.
- Santana ML, Aspilcueta-Borquis RR, Bignardi AB, Albuquerque LG, Tonhati H. 2011. Population structure and effects of inbreeding on milk yield and quality of Murrah buffaloes. J Dairy Sci. 94(10):5204–5211.
- Sargolzaei M, Iwaisaki H, Colleau JJ. 2006. CFC: A tool for monitoring genetic diversity. Proc. 8th World Congr. Genet. Appl. Livest. Prod., CD-ROM Communication 27-28. Belo Horizonte, Brazil, Aug. 13-18, 2006.
- SAS Institute Inc. 2003. SAS user’s guide: version 9.1. Cary (NC): SAS Institute Inc.
- Scholtz MM, Roux CZ. 1988. The Kleiber ratio (growth rate/metabolic mass) as possible selection criteria in the selection of beef cattle. Paper presented at the 3rd World Cong. on Sheep and Beef Cattle Breed; June 19–23; Paris, France.
- Selvaggi M, Dario C, Peretti V, Ciotola F, Carnicella D, Dario M. 2010. Inbreeding depression in Leccese sheep. Small Rumin Res. 89(1):42–46.
- Silva MA, Mario H, Malhado D, Mendes CH, Costa JL, Cobuci JA, Costa CN, Carneiro PLS. 2016. Population genetic structure in the Holstein breed in Brazil. Trop Anim Health Prod. 48(2):331–336.
- Vatankhah M, Sigdel A, Abdollahi-Arpanahi R. 2019. Population structure of Lori-Bakhtiari sheep in Iran by pedigree analysis. Small Rumin Res. 174:148–155.
- Woolliams JA, Mantysaari EA. 1995. Genetic contributions of Finnish Ayshire bulls over four generations. Anim Sci. 61(2):177–187.
- Wright S. 1965. The interpretation of population structure by F-statistics with special regard to systems of mating. Evolution (Nova York). 19:395–420. https://doi.org/10. 2307/2406450.
- Yavarifard R, Ghavi Hossein-Zadeh N, Shadparvar AA. 2014. Population genetic structure analysis and effect of inbreeding on body weights at different ages in Iranian Mehraban sheep. J Anim Sci Technol. 56(1):31.
- Yavarifard R, Ghavi Hossein-Zadeh N, Shadparvar AA. 2017. Inbreeding effects on average daily gain and Kleiber ratio in Mehraban sheep. Iranian J Anim Sci Res. 9(1):113–124.