
 ?Mathematical formulae have been encoded as MathML and are displayed in this HTML version using MathJax in order to improve their display. Uncheck the box to turn MathJax off. This feature requires Javascript. Click on a formula to zoom.
Abstract
Genetic parameters of litter size (LS) and number of kids born alive (NBA) were estimated across parities in Florida and Payoya goat breeds using a threshold random regression model (RRM). We analysed the reproductive records for the Florida and Payoya breeds separately, and a total of 130.849 and 67.478 reproductive records from the first to the seventh parities from Florida and Payoya, respectively, were included in the analysis. Random regressions on Legendre polynomials of standardised parity were included for permanent environmental and additive genetic effects. We based our estimation of all the covariance components on Bayesian inference under categorical distribution and considered heterogeneous residual variances in the model. The estimates of heritabilities ranged from null to 0.37 for LS and from 0.02 to 0.20 for NBA, while the repeatability estimates were between 0.008–0.60 and 0.03–0.44 for LS and NBA, respectively. Phenotypic correlations within-trait along parities ranged widely from −0.31 to 0.97, while the genetic correlations within-trait through parities showed a wider range and magnitude of values, from −0.98 to 0.99 for LS and from −0.72 to 0.99 for NBA. The estimates of genetic correlations between LS and NBA in the different parities were positive in the first two parities and negative in the later ones. Due to the noticeable changes in variance and the incomplete genetic correlations, the use of a random regression model to analyse LS and NBA is recommended in goat breeds.
A bivariate threshold random regression model has been used for the first time to estimate genetic parameters of litter size and number of kids born alive across parities in Spanish goat breeds.
The evolution of genetic parameters along parities is different between Florida and Payoya that have different production systems, being more intensive in the case of the Florida breed.
Estimates of variance were not constant across parities for both traits and breeds.
Genetic correlations within-trait across parities were different from unity.
Thus, LS and NBA should be treated as different traits in successive parities.
Given that the estimates of variance and covariances are not constant across parities for both traits and breeds, the use of RRM is highly recommended.
HIGHLIGHTS
Introduction
Over the last years, genetic improvement in Spanish dairy goats has focused on milk production and milk composition traits (Menéndez-Buxadera et al. Citation2008, 2010; Molina et al. Citation2018). Nevertheless, there are other important economic traits in small ruminants, such as litter size and number of kids born alive, especially for breeds facing extinction like the Payoya breed. In the Florida breed, they already represent a significant source of income for breeders by producing a large average litter size. Florida and Payoya breeds are native Spanish dairy goats reared under different production systems varying from semi-extensive to semi-intensive for Florida and from semi-extensive to extensive for Payoya. Florida is spread all over the country (Andalusia, Castilla la Mancha, Extremadura, etc) and in different countries in the world (Italy, Portugal, Venezuela, etc) whereas the Payoya breed is present only in the Andalusian Spanish region. Several approaches have been used to carry out genetic evaluation of litter size in goat, the most common being repeatability and multiple-trait models. A repeatability animal model assumes that genetic correlations between litter sizes are equal to the unity and that the variance is constant in successive parities (Mrode and Thompson Citation2005). Nevertheless, it has been argued in several studies using multiple-trait model and random regression model (RRM) that phenotypic and additive genetic correlations between litter sizes in adjacent parities are often lower than unity (Alfonso et al. Citation1994; Irgang et al. Citation1994; Fernández et al. Citation2008; Skorput et al. Citation2014), especially between the first and the later parities (Serenius et al. Citation2003; Oh et al. Citation2005; Skorput et al. Citation2014). Multiple-trait model and random regression model consider subsequent measures to be different traits. Nevertheless, a random regression model has some advantages in comparison with multiple-trait model: the possibility of estimating covariance structure and breeding values at any point of the trait trajectory, and the reduction on the number of parameters to be estimated (Kirkpatrick et al. Citation1990; Meyer and Hill Citation1997). Also, RRM offers more accurate modelling of covariance structure, giving more accurate predictions of breeding values (Huisman Citation2002).
In goat, RRM has been used for analysing growth and feed intake (Barazandeh et al. Citation2012 in Raini; Kheirabadi and Rashidi Citation2016 in Markhoz; Desire et al. Citation2018 in mixed-breed Saanen, Alpine, and Toggenburg dairy goats) and milk yield and composition traits (Menéndez-Buxadera et al. Citation2008 in Payoya; 2010 in Murciano-Granadina; Andonov et al. Citation2013 in Norwegian goats; Silva et al. Citation2013 in Alpine; Arnal et al. Citation2019 in Saanen); however, their application to genetic evaluation of litter size has not yet been implemented, and estimation of genetic parameters for litter size or number born alive using RRM has been reported only in pigs (Lukovic et al. Citation2003, 2004, Citation2006; Fernández et al. Citation2008; Chen et al. Citation2010; Skorput et al. Citation2014; Ogawa et al. Citation2019). Litter size is measured more than once in an animal’s lifetime and, despite being different from longitudinal traits because the parity number is a discrete variable, the application of RRM to analyse this trait is feasible (Schaeffer Citation2004).
Therefore, the main aim of this study was to estimate for the first time in Florida and Payoya goat breeds genetic parameters and their changes across parities for litter size (LS) and number of kids born alive (NBA) treated as threshold traits using a bivariate random regression model (RRM).
Material and methods
Data description
The reproductive and genealogical records of the Florida and Payoya goats were provided by ACRIFLOR (National Association of Florida Goat Breeders) and ACAPA (Association of Payoya Goat Breeders), respectively. The original datasets comprised 143,002 and 72,514 records, respectively. Data from herds with less than 10 records or scarce genetic connections were removed. Genetic links were due to the use of artificial insemination sires. After data editing, a total of 130,849 records from 48,984 Florida females collected between 1986 and 2019 (an average of 2.67 kiddings per female) and 67,478 records from 14,942 Payoya females recorded between 2003 and 2019 (an average of 4.51 kiddings per female) were used in this analysis. Traits considered were litter size (LS), estimated as the total number of kids born per kidding and number of kids born alive (NBA), both recorded on the day of kidding from the first to the seventh parity in both breeds. For the Florida pedigree, only animals with approved parentage tests using DNA microsatellites were considered. The pedigree was traced back for as many generations as available in the breeds herd book, being 7.3 equivalent generations for Florida and 4 generations for Payoya. The total number of animals in the pedigree was 55,748 for Florida and 26,392 for Payoya.
Statistical analysis
The analyses were performed for the Florida and Payoya breeds separately, fitting the following bivariate random regression model (RRM) for LS and NBA:
where y is a vector with n observations of LS and NBA, ‘fixed’ is the combined effect of herd-year-month of kidding (2629 levels for Florida and 803 for Payoya),
are k coefficients of fixed regression of the LS and NBA traits across parities with orthogonal second-order Legendre polynomials. Seven parity classes were considered as the unit of time t for both traits and breeds corresponding to parity numbers (t = 1–6 and t ≥ 7).
and
are the random regression coefficients associated with the additive genetic function of animals and the permanent environmental function of the goat with LS and NBA records, respectively, and e is the residual modelled with heterogeneous variance according to parity with three measurements for Florida (parity 1, 2, and ≥ 3) and five measurements for the Payoya breed (parity 1, 2, 3 and 4, 5 and ≥ 6). X, Z, and W are incidence matrices relating y with the new parameters in β, α, and µ, respectively.
To deal with the non-normal distribution of LS and NBA, these traits were treated as a threshold trait, divided into two categories in both breeds (one; more than one).
The (co)variance components, heritabilities (h2), repeatabilities (t), and additive genetic correlations (rg) throughout the scale of values of parity were estimated by the expression proposed by Jamrozik and Schaeffer (Citation1997).
Estimation of all the (co)variance components was based on the Bayesian inference methodology using the Gibbs Sampling algorithm in the THRGIBBS3F90 software (Misztal et al. Citation2016). Flat priors were assumed for systematic effects of herd-year-month of kidding, as well as for additive genetic, permanent environmental, and residual effects. Chains of 100,000 samples were used, with a burn-in period of 20,000. One sample per 100 was saved to avoid high correlations between consecutive samples. A post-Gibbs analysis using the POSTGIBBSf90 program (Tsuruta and Misztal Citation2006) was performed in order to calculate posterior means and high posterior density intervals and to check convergence with the Geweke test.
Results and discussion
Up to now, there have been no studies on the estimation of genetic parameters for litter size with random regression model in goat: previous studies on the genetic analysis of litter size have normally used repeatability and multiple-trait approaches. In this work, we analysed the change in genetic parameters of LS and NBA across female parities with a threshold random regression model in Florida and Payoya goat breeds.
The distribution of number of records and average female age at different parities in Florida and Payoya breeds is provided in Table . The least-squares means for litter size (LS) and number of kids born alive (NBA) over the seven parities are summarised in Figures and , respectively. The average values were 1.61–1.6 and 1.6–1.57 for LS and NBA, for Florida and Payoya breeds, respectively. The maximum values of LS and NBA were observed in the fourth parity in Florida and in the sixth parity in Payoya. The phenotypic trajectories of both traits (Figures and ) reflected the high reproductive performance of Florida and Payoya breeds and their high persistence. However, the initial increase and the final decline in both traits in the Florida breed were more remarkable and occurred earlier than in Payoya, possibly due to its high production level and the fact that the Payoya breed is a more rustic (less improved) breed and is, therefore, less precocious.
Figure 1. Least-squares means of litter size (LS) across parities in Florida and Payoya breeds.
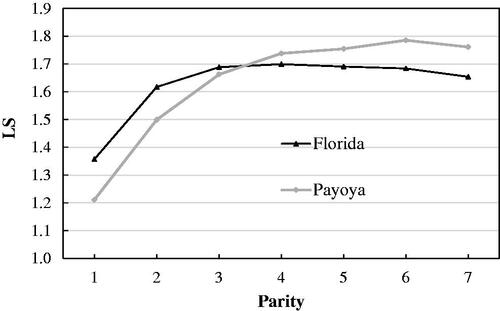
Figure 2. Least-squares means of number of kids born alive (NBA) across parities in Florida and Payoya breeds.
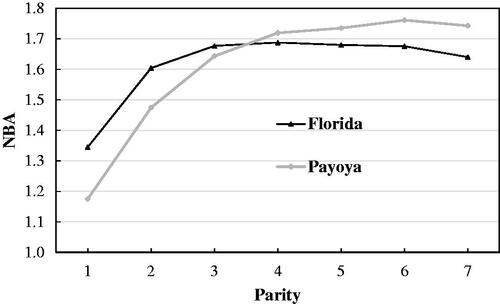
Table 1. Distribution of data over parities in Florida and Payoya breedsa.
The results of variance components (additive genetic, permanent environmental, and residual), heritabilities (h2), and repeatabilities (t) across the seven parities in Florida and Payoya breeds for litter size and number of kids born alive are presented in Tables and , respectively. All estimates of variance components, heritabilities, repeatabilities, and additive genetic correlations in this study for LS and NBA in both breeds were presented on a liability scale. Estimates of variance components for LS in both breeds presented the same tendency, decreasing from the first parity to the second parity which presented the lowest values, and increasing up to the latest parities, reaching the highest values in the sixth and seventh parities. Heritability and repeatability estimates of LS in both breeds showed the same pattern as the variance components. Their estimated values oscillated between null to 0.22 and 0.008 to 0.42 in Florida and from 0.01 to 0.37 and 0.02 to 0.60 in Payoya for heritability and repeatability, respectively (Table ). Variance components, h2, and t for NBA in both breeds did not present a clear pattern from the first to the seventh parity.
Table 2. Estimates of variance components, heritabilities, and repeatabilities for litter size (LS) across parities in Florida and Payoya breeds using a threshold random regression modela.
Table 3. Estimates of variance components, heritabilities, and repeatabilities for number of kids born alive (NBA) across parities in Florida and Payoya breeds using a threshold random regression modela.
Nevertheless, in the Payoya breed, the first parity presented the lowest estimates. Besides, the highest values for variance components, h2, and t were observed in the latest parity (h2 was 0.19 and 0.20 and t was 0.30 and 0.44 in Florida and Payoya, respectively, Table ).
The estimated variance components and h2 for LS and NBA changed over parities and differed slightly between Florida and Payoya breeds, showing low values, as expected for reproductive traits. In general, all HPD95% for heritabilities for LS and NBA in both breeds were small.
To date, there are no works on the estimation of genetic parameters of reproductive traits in goat using threshold RRM. In previous studies conducted in other goat breeds, a wide range of h2 values has been reported for LS (Kasap et al. Citation2013 in Saanen; Atoui et al. Citation2018 in local Tunisian breed; Abdoli et al. Citation2019 in Markhoz), but all these estimates have been obtained with linear repeatability models. For NBA, there are no available studies on estimating its genetic parameters, and this work is the first to estimate it in goat using RRM. The high estimated repeatabilities observed in the last parities could be explained by the fact that at this stage, the least reproductively efficient animals have already been discarded. The differences found between Florida, Payoya and other breeds may be attributable to estimation errors due to differences in the used methodologies, the size of the datasets, the genetic structure of the populations, or management practices.
Estimates of the phenotypic (rp) and additive genetic (rg) correlations within-trait over the seven parities in Florida and Payoya breeds are provided in Tables and for LS, and Tables and for NBA, respectively. Phenotypic correlations within-trait along parities ranged widely from −0.26 to 0.96 for LS and −0.24 to 0.96 for NBA in Florida (Tables and , respectively) and from −0.31 to 0.97 for LS and −0.30 to 0.97 for NBA in the Payoya breed (Tables and , respectively). The estimated genetic correlations for LS were generally similar in both breeds and covered a very wide range of values varying from −0.90 to 0.96 in Florida (Table ) and from −0.98 to 0.99 in Payoya (Table ). These estimates were high between the adjacent parities (in the diagonal) and close to unity, except for rg between the second and third parities in both breeds, and decreased as the interval between parities increased, except for rg between the seventh parity and the first and second parities, which showed a small increase. In both breeds, the decrease in rg from the first-second parities to the second-third parities was sudden, with clearly contrasting values. For NBA, estimates of rg varied from −0.66 to 0.99 in Florida (Table ) and from −0.72 to 0.99 in Payoya (Table ). Estimated rg among the first five parities, unlike LS, presented only positive values. In subsequent parities, the values were high, except for rg between the fifth and sixth parities (0.28 in Florida and 0.17 in Payoya, Table ). Unlike LS, the variation in rg as the interval between parities increased did not present a clear pattern in both breeds.
Table 4. Estimates of additive genetic correlations (above diagonal) and phenotypic correlations (below diagonal) between litter size (LS) across parities in Florida breed using a threshold random regression model.
Table 5. Estimates of additive genetic correlations (above diagonal) and phenotypic correlations (below diagonal) between litter size (LS) across parities in Payoya breed using a threshold random regression model.
Table 6. Estimates of additive genetic correlations (above diagonal) and phenotypic correlations (below diagonal) between number of kids born alive (NBA) across parities in Florida breed using a threshold random regression model.
Table 7. Estimates of additive genetic correlations (above diagonal) and phenotypic correlations (below diagonal) between number of kids born alive (NBA) across parities in Payoya breed using a threshold random regression model.
A low genetic correlation within-trait in different parities indicates that LS and NBA records from different parities should be treated as different traits (Irgang et al. Citation1994; Roehe and Kennedy Citation1995; Skorput et al. Citation2014). Direct additive genetic correlations were highest between adjacent parities and decreased as the interval between parities increased. This decreasing tendency of rg with the increasing distance between parities was in agreement with the findings of Lukovic et al. (Citation2006) and Skorput et al. (Citation2014) in pigs. This could be explained by the smaller amount of data in later parities and the imprecise recording of parity order (Skorput et al. Citation2014).
Additive genetic and phenotypic correlations between LS and NBA in Florida and Payoya breeds across parities are presented in Table . The estimated rg between both traits covered a wide range and magnitude of values, being positive in the first two parities with the highest values in the first parity for Florida (0.81, Table ) and the first and second ones in Payoya (0.93 and 0.66 for first and second parity, respectively, Table ), and negative in the later parities. Therefore, a selection made at any parity will have a positive or negative impact on the other trait throughout the rest of the productive life of the goat, particularly after the third parity. On the other hand, the phenotypic correlations were much smoother compared to the genetic ones. The wide range and magnitude of rg estimates between LS and NBA at different parities implies that selection for increasing one of these traits will produce a genetic response (limited given the low magnitude of heritabilities) whose magnitude will depend on the moment it is selected. The maximum direct and correlated responses can be obtained by selecting during the first two parities in Payoya and the first parity in Florida.
Table 8. Estimates of phenotypic (rp) and additive genetic (rg) correlations between litter size (LS) and number of kids born alive (NBA) across parities in Florida and Payoya breeds using a threshold random regression model.
It is also important to recognise litter size as a complex trait (Pérez-Enciso et al. Citation1994, Rauw et al. Citation1999; Menéndez-Buxadera et al. Citation2004). LS is the best natural index as it combines ovulation rate and survival rate of the embryos (directly dependent on the maternal uterine environment). Litter size is therefore considered as a trait genetically related only to the mother of the litter, although some authors (Menéndez-Buxadera et al. Citation2004) have shown that there may be a small paternal component (probably due to the fact that there is an additive component of the embryo or embryos that make them more or less robust), consistent with Falconer’s (Citation1960) hypothesis.
Random regression model has become commonly used to analyse longitudinal data or repeated records of individuals over time. RRM is a suitable way of dealing with repeated traits since it describes performance over time for each animal to allow for individual variation in the course of the trajectory (Meyer 1998). To estimate the genetic parameters for LS and NBA in Florida and Payoya goat breeds, the use of RRM is justified since both traits show a very wide variation in variances and genetic correlations throughout parities. Even for lower values of h2, as in the case of reproductive traits, and for negative genetic correlations, the possibility of optimally selecting for increasing female prolificacy is suggested.
The wide range of estimates of genetic correlations for LS and NBA between the different parities confirms that these traits are partially controlled by different genes at the first two parities and at the later parities. Genetic selection of animals for reproductive traits could be implemented involving LS and NBA in the first and second parities in Florida and in the first parity in Payoya.
Finally, this study provides estimates of genetic parameters for LS and NBA across the female parities, using a random regression model that can be used in the future to support decisions about selection aims within the current selection programs of Florida and Payoya breeds. It also suggests that future research should evaluate the traits of litter size and number of kids born alive in conjunction with the current selection criteria (milk production and milk composition traits).
Conclusions
Using a threshold model in which a continuous variable underlying LS and NBA traits across parities by a bivariate RRM in Florida and Payoya goats, our results indicate that litter size and the number of kids born alive in subsequent parities are genetically not the same traits because estimated variances and covariances were not constant over parities and genetic correlations between repeated measures of the traits differed from unity. Hence, the use of a random regression model to genetically analyse litter size or the number of kids born alive over parities is recommended in both breeds. Although low heritability estimates were obtained, improvement of litter size and number of kids born alive by selection is feasible. Given the genetic correlations between both traits across parities, an early genetic response can be achieved if selection occurs in the two first parities for Payoya and the first one for Florida breed.
Ethical approval
This study did not require manipulation or modification of the usual handling of the animals, since we have worked directly with the routine records provided by the breeders' associations of the Florida and Payoya breeds.
Acknowledgments
The authors would like to thank the ACRIFLOR (Asociación Nacional de Criadores de Ganado Caprino de Raza Florida – National Association of Florida Goat Breeders) and the ACAPA (Asociación de Criadores de Raza Caprina Payoya – Association of Payoya Goat Breeders) for providing the data for this study.
Disclosure statement
The authors declare that there is no conflict of interest associated with the paper.
References
- Abdoli R, Zamani P, Mirhoseini SZ, Hossein-Zadeh NG, Almasi M. 2019. Genetic parameters and trends for litter size in Markhoz goats. Rev Colom Cienc Pecua. 32(1):58–63.
- Alfonso L, Noguera JL, Babot D, Estany J. 1994. Selection for litter size in swine using a multivariate animal model. Proceedings of the World Congress on Genetics Applied to Livestock Production, Guelph (Canada). p. 347–350.
- Andonov S, Odegard J, Svendsen M, Adnoy T, Vegara M, Klemetsdal G. 2013. Comparison of random regression and repeatability models to predict breeding values from test-day records of Norwegian goats. J Dairy Sci. 96(3):1834–1843.
- Arnal M, Larroque H, Leclerc H, Ducrocq V, Robert-Granie C. 2019. Genetic parameters for first lactation dairy traits in the Alpine and Saanen goat breeds using a random regression test-day model. Genet Sel Evol. 51(1):43.
- Atoui A, Carabaño MJ, Najari S. 2018. Evaluation of a local goat population for fertility traits aiming at the improvement of its economic sustainability through genetic selection. Span J Agric Res. 16(2):e0404.
- Barazandeh A, Moghbeli S, Ghavi Hossein-Zadeh N, Vatankhah M. 2012. Genetic evaluation of growth in Raini goat using random regression models. Livestock Science. 145(1–3):1–6.
- Chen CY, Misztal I, Tsuruta S, Herring WO, Holl J, Culbertson M. 2010. Genetic analyses of stillbirth in relation to litter size using random regression models. J Anim Sci. 88(12):3800–3808.
- Desire S, Mucha S, Coffey M, Mrode R, Broadbent J, Conington J. 2018. Deriving genomic breeding values for feed intake and body weight in dairy goats. Proceedings of the World Congress on Genetics Applied to Livestock Production. p. 818.
- Falconer D. 1960. The genetics of litter size in mice. J Cell Comp Physiol. 56(Suppl 1):153–167.
- Fernández A, Rodrigáñez J, Zuzúarregui J, Rodríguez MC, Silió L. 2008. Genetic parameters for litter size and weight at different parities in Iberian pigs. Span J Agric Res. 6(S1):98. 105424/sjar/200806S1-378.
- Huisman A. 2002. Genetic analysis of growth and feed intake patterns in pigs. Wageningen Universiteit Promotor: Profdrir JAM van Arendonk - [Sl]: [sn], 2002 - ISBN 90-5808-766-2.
- Irgang R, Fávero JA, Kennedy BW. 1994. Genetic parameters for litter size of different parities in Duroc, Landrace, and large white sows. J Anim Sci. 72(9):2237–2246.
- Jamrozik J, Schaeffer LR. 1997. Estimates of genetic parameters for a test day model with random regressions for yield traits of first lactation holsteins. J Dairy Sci. 80(4):762–770.
- Kasap A, Mioc B, Skorput D, Pavic V, Antunovic Z. 2013. Estimation of genetic parameters and genetic trends for reproductive traits in Saanen goats. Acta Vet (Beogr). 63(2–3):269–277.
- Kheirabadi K, Rashidi A. 2016. Genetic description of growth traits in Markhoz goat using random regression models. Small Ruminant Res. 144:305–312.
- Kirkpatrick M, Lofsvold D, Bulmer M. 1990. Analysis of the inheritance, selection and evolution of growth trajectories. Genetics. 124(4):979–993.
- Luković Z, Malovrh Š, Gorjanc G, Uremovic M, Kovač M. 2003. Genetic parameters for number of piglets born alive using a random regression model. Agriculturae Conspectus Scientificus. 68(2):105–108.
- Luković Z, Malovrh Š, Gorjanc G, Kovač M. 2004. A random regression model in analysis of litter size in pigs. S Afr J Anim Sci. 34:241–248.
- Lukovic Z, Uremovic M, Konjacic M, Uremovic Z, Vincek D. 2006. Genetic parameters for litter size in pigs using a random regression model. Asian Australas J Anim Sci. 20(2):160–165.
- Menéndez Buxadera A, Alexandre G, Mandonnet N. 2004. Discussion on the importance, definition and genetic components of the number of animals born in the litter with particular emphasis on small ruminants in tropical conditions. Small Ruminant Res. 54(1–2):1–11.
- Menendez-Buxadera A, Molina A, Arrebola F, Gil MJ, Serradilla JM. 2010. Random regression analysis of milk yield and milk composition in the first and second lactations of Murciano-Granadina goats. J Dairy Sci. 93(6):2718–2726.
- Menendez-Buxadera A, Romero F, González O, Molina F, Molina Alcalá A. 2008. Estimates of genetic parameters of milk yield and milk composition using random regression model in Payoya goat. ITEA Informacion Tecnica Economica Agraria. 104:127–132.
- Meyer K. 1998. Estimating covariance functions for longitudinal data using a random regression model. Genet Sel Evol. 30(3): 221–240.
- Meyer K, Hill WG. 1997. Estimation of genetic and phenotypic covariance functions for longitudinal or ‘repeated’ records by restricted maximum likelihood. Livestock Prod Sci. 47(3):185–200.
- Misztal I, Tsuruta S, Lourenco D, Masuda Y, Aguilar I, Legarra A, Vitezica Z. 2016. Manual for BLUPF90 family of programs http://nce.ads.uga.edu/wiki/lib/exe/fetch.php?media=blupf90_all5.pdf.
- Molina A, Muñoz E, Díaz C, Menéndez-Buxadera A, Ramón M, Sánchez M, Carabaño MJ, Serradilla JM. 2018. Goat genomic selection: impact of the integration of genomic information in the genetic evaluations of the Spanish Florida goats. Small Ruminant Res. 163:72–75.
- Mrode R.A, R. Thompson. 2005. Linear models for the prediction of animal breeding values. Chapter 1,p 5. CABI.
- Ogawa S, Konta A, Kimata M, Ishii K, Uemoto Y, Satoh M. 2019. Genetic parameter estimation for number born alive at different parities in Landrace and Large White pigs. Anim Sci J. 90(9):1111–1119.
- Oh SH, Lee DH, See MT. 2005. Estimation of genetic parameters for reproductive traits between first and later parities in pig. Asian Australas J Anim Sci. 19(1):7–12.
- Pérez-Enciso M, Foulley JL, Bodin L, Poivey JP. 1994. Genetic implications of a bivariate threshold model for litter size components1. J Anim Sci. 72(11):2775–2786.
- Rauw WM, Luiting P, Beilharz RG, Verstegen MWA, Vangen O. 1999. Selection for litter size and its consequences for the allocation of feed resources: a concept and its implications illustrated by mice selection experiments. Livestock Prod Sci. 60(2–3):329–342.
- Roehe R, Kennedy BW. 1995. Estimation of genetic parameters for litter size in Canadian Yorkshire and Landrace swine with each parity of farrowing treated as a different trait. J Anim Sci. 73(10):2959–2970.
- Schaeffer LR. 2004. Application of random regression models in animal breeding. Livestock Prod Sci. 86(1–3):35–45.
- Serenius T, Sevón-Aimonen ML, Mäntysaari EA. 2003. Effect of service sire and validity of repeatability model in litter size and farrowing interval of Finnish Landrace and Large White populations. Livestock Prod Sci. 81(2–3):213–222.
- Silva FG, Torres RA, Brito LF, Euclydes RF, Melo AL, Souza NO, Ribeiro JI, Jr., Rodrigues MT. 2013. Random regression models using Legendre orthogonal polynomials to evaluate the milk production of Alpine goats. Genet Mol Res. 12(4):6502–6511.
- Skorput D, Gorjanc G, Dikic M, Lukovic Z. 2014. Genetic parameters for litter size in Black Slavonian pigs. Span J Agric Res. 12(1):89.
- Tsuruta S, Misztal I. 2006. THRGIBBS1F90 for estimation of variance components with threshold-linear models. Proceedings of the 8th World Congress on Genetics Applied to Livestock Production, Belo Horizonte, Brazil. 89. p. 27–31.