
 ?Mathematical formulae have been encoded as MathML and are displayed in this HTML version using MathJax in order to improve their display. Uncheck the box to turn MathJax off. This feature requires Javascript. Click on a formula to zoom.
Abstract
Central composite design (CCD; 3 levels and 3 factors) and response surface methodology (RSM) were used to evaluate the average daily body weight gain (ADG) and feed conversion ratio (FCR) in broiler chicks to different levels of dietary sugar beet pulp (SBP), tallow (T) and soybean oil (SO). A total of 60 battery brooder cages of 7 birds each were assigned to 15 diets of CCD containing 3 levels of SBP (0.00, 1.75, 3.50%), T (0.00, 0.50, 1.00%) and SO (0.00, 0.50, 1.00%), from 0 to 14 days of age. The testable outcomes of CCD were fitted with the quadratic model. The response surface analysis showed significant linear, quadratic, and interaction models for ADG and FCR from 0 to 7 and 7 to 14 days of age. At 7 days of age, maximum ADG and minimum FCR were observed with 0.00% of SBP, T, and SO in the diet. At 14 days of age, maximum ADG was obtained at 0.60%, 0.33% and 0.45% of SBP, T and SO in the diet, and the minimum FCR was observed with 0.98%, 0.00% and 1.00% of SBP, T and SO in diet, respectively. The results of this study showed that with increasing age and development of the gastrointestinal tract of broilers, adverse effects of soluble fibres are reduced, and response surface models can explain the correlation among dietary nutrient concentrations and young broiler performance to achieve the optimal target.
Central composite design reduces the number of trials and the costs.
The development of the gastrointestinal tract will moderate the adverse effects of dietary soluble fibre.
By the response surface model, the correlations between dietary nutrients can be explained.
HIGHLIGHTS
Introduction
Different advances in poultry nutrition have drawn nutritionists’ attention to interactions between the components of the diet. Fibre is one of the most substantial ingredients in poultry diets. Traditionally, dietary fibre has been suggested as a diluent and anti-nutritional factor. However, it has been found that fibre’s appropriate values improve digestive organ development, enzyme secretion, and nutrient digestibility in poultry. Dietary fibre features including viscosity (Miyamoto and Chang Citation1992), emulsifying capacity (Collins and Post Citation1981), and their interactions with cholesterol (Bangoura et al. Citation2009), and interactions between different types of fibres (Saki et al. Citation2011), have received much consideration.
Sugar beet pulp (SBP) remains after sugar extraction and contains approximately 400 g/kg of neutral detergent fibre (NDF) and 250 g/kg of pectin as soluble fibre (Voelker and Allen Citation2003). One kilogram of dry sugar beet pulp contains 9.7–11.2 MJ/kg of metabolisable energy and 102.7 g/kg of crude protein. It contains relatively high calcium, sodium, magnesium and trace elements. Since it contains almost no lignin, it has a high digestibility in pigs (Koschayev et al. Citation2019). Due to the pectin content of the SBP, it can produce viscose and moist excretion by creating viscosity and water holding feature (Józefiak et al. Citation2006).
Energy makes up a large part of the costs of balanced diets for poultry. One of the most applied manners to increase energy density in poultry diets is applying fats and oils (Peebles et al. Citation2000). Oils and fats include unsaturated fatty acids, unsaturated fatty acids with a double bond, and unsaturated fatty acids with several double bonds (Wathes et al. Citation2007). Animal fats, especially tallow, mostly contain saturated fatty acids and often contain triglycerides and a little free fatty acid (Bartov Citation1988). Soybean oil is rich in linoleic acid, which is the most important member of the omega-6 family of fatty acids. Oxidation is higher in soybean oil due to its high levels of unsaturated fatty acids, and it has been observed that the rate of lipid peroxidation is lower in broilers fed with tallow (Hosseini-Vashan et al. Citation2014). Velasco et al. (Citation2010) found that broilers consuming diets containing sunflower oil showed a better FCR than chickens consuming diets containing palm oil. On the other hand, when using two oil sources in broiler diets, Abudabos (Citation2013) did not observe a significant difference among the treatments in terms of feed intake and body weight gain. He stated that the nutrition values of fats and oils are totally dependent on their metabolisable energy contents, and the metabolisable energy content of them is a function of their digestibility and absorption.
Obstacles related to distinguishing the best measure of urgent nutrients in the diet are argued (Lerman and Bie Citation1975). Therefore, it is useful to design experiments using new mathematical-statistical methods to optimise the test conditions and achieve more accurate results (Ahmadi and Golian Citation2010). The response surface methodology (RSM) consists of statistical and mathematical methods used in designing experiments, modelling, analysing data, evaluating the impact of input variables, and finding optimal conditions based on inputs (Box et al. Citation1978). This method is based on a specific type of experimental design in which the effects of multiple factors on one or more outputs are investigated, and the data obtained from the experiment design are fitted on a quadratic polynomial model (Ahmadi and Golian Citation2011). If the researcher intends to examine several factors at the same time, the RSM is an appropriate model because it has a useful set of statistical and mathematical methods to study the responses obtained by combination factors to find efficient solutions (Myers et al. Citation2009), optimising the interaction among the agents and their levels, and reducing research costs (Hu Citation1999). The central composite design (CCD) is the most usual design of the experiment used in the RSM in which the inputs take on 3 or 5 various levels, but not all combinations of these factors appear in the factorial design; then, it requires fewer experimental runs. This trial aimed to optimise broiler chickens’ growth performance to various amounts of dietary fibre and fat using RSM at 0 to 7 days and 7 to 14 days of age.
Materials and methods
Birds and diets
A total of 420 One-day-old Ross 308 male broiler chicks with average weights of 46.45 ± 0.97 g were obtained from a local commercial hatchery and randomly distributed into 60 battery brooder cages. According to the scheme produced by 3-level, 3-factor CCD, 60 cages of 7 birds each were assigned to 15 diets containing 3 levels of SBP (0.00, 1.75, and 3.5%), T (0.00, 0.50, and 1.00%), and SO (0.00, 0.50 and 1.00%), from 0 to 7 days and 7 to 14 days of age (Tables and ). Ingredients and chemical composition of the experimental diets are shown in Tables and . Diet samples were analysed for neutral detergent fibre (Mertens et al. Citation2002), acid detergent fibre, and insoluble fibre (Association of Official Analytical Chemists Citation2005). The soluble fibre was calculated from the difference of total crude fibre from its insoluble fraction. Fatty acids profiles of tallow and soybean oil were determined using gas chromatography (Table ). Rearing house temperature was set at 32 °C in the first week, which was decreased by 3 °C each week to eventually reach 25 °C and remained constant until the end of the experiment. Light and darkness were provided as 18 h light and 6 h dark throughout the experiment.
Table 1. Dietary nutrient concentrations used in central composite design response surface methodology to feed broiler chicks from 0 to 14 days of age.
Table 2. Sugar beet pulp (SBP), Tallow (T), and Soybean oil (SO) concentrations in experimental diets prepared according to a central composite design (3 levels, 3 factors) and corresponding experimental response values for ADG and FCR in broiler chicks from 0 to 7 days and 7 to 14 days of age.
Table 3. Composition of the experimental diets.
Table 4. Chemical composition of the experimental diets (calculated and determined analysis, %).
Table 5. Analysis of major fatty acids in tallow and soybean oil (%).
Growth performance
The group weight of birds in every cage was measured at the beginning and end of the study (end of 7 days and 14 days of age). The average daily body weight gain (ADG) was calculated from birds’ weight gain in each cage. Feed intake was calculated by subtracting the remaining feed from the offered feed in each cage during the study. Feed conversion ratio (FCR) was corrected for mortality and represented as grams of feed consumed by all birds divided by grams of body weight gain. Mortality was recorded daily (Imari et al. Citation2020). After running a growth experiment by CCD, a data set, including 60 data lines, was produced and subjected to statistical analyses.
Statistical analyses
The most commonly used model in RSM analysis is the following second-order polynomial equation (Box et al. Citation1978):
Where y is ADG or FCR, k is the number of input variables (k = 3), xi represents the input variables (dietary percentage of SBP, T, and SO), β0 is the constant term, βi represents the coefficients of the linear parameters, βij represents the coefficients of the interaction parameters, βii represents the coefficients of the quadratic parameter, and ɛ is the residual associated with the experiment. The experimental data (60 data lines) collected by CCD were fitted to the second-order polynomial equation by Minitab 17. Using ANOVA and corresponding absolute t-value of the model parameters, a procedure of the sensitivity analysis was done on RSM models to discover which model term is considered more notable within the modelling procedure. A more important model term (linear, quadratic, or interaction of obtained model related to dietary SBP, T, and SO concentration) has a higher absolute t-value. Thus, the input variables may be sorted in the order of importance.
Results
ADG and FCR (0–7 days of age)
The polynomial equation from raw experimental data for ADG (R2 = 0.82; root MSE = 1.41) and FCR (R2 = 0.83; root MSE = 0.14) was generated as follows:
The estimated parameters for SBP, T, SO, SBP × SBP, SO × SO, SBP × SO, and T × SO terms in the ADG model, and SBP, SO, SBP × SBP, and SBP × SO terms in the FCR model were significant (p < .05). The fit of the RSM model was also expressed by the R2 value, which was found to be 0.82 and 0.83 for ADG and FCR model, respectively, indicating that almost 80% of the variability in the responses could be explained by the model. The contribution of each type of effect in the RSM model (linear, quadratic, and interaction) to the statistical fit (in terms of R2) is shown in Table . In the ADG model, the linear terms have a higher contribution (partial R2 = 0.49) to explain existing variation in the response of chickens. It was followed by quadratic (partial R2 = 0.24) and interaction (partial R2 = 0.10) terms. In the FCR model the linear (partial R2 = 0.60) and quadratic (partial R2 = 0.20) terms had contribution to explain existing variation in feed efficiency, and the interaction terms (partial R2 = 0.03) had a little contribution (Table ). Maximum ADG and minimum FCR were observed with the diet containing 0.00% SBP, 0.90% T, and 0.00% SO (Table ). The predicted ADG and FCR at the optimal points were 21.56 g/bird per day and 1.01, respectively.
Table 6. Analysis of variance on the experimental results along with the contribution of each type of effect (linear, quadratic, and interaction) to the statistical fit in response surface model for ADG and FCR in broiler chicks from 0 to 7 days of age.
Table 7. Optimisation analysis on response surface model (RSM) to reach maximum ADG and minimum FCR in broiler chicks from 0 to 7 and 7 to 14 days of age.
The regression coefficient estimates and corresponding t- value and p-value are shown in Table . The absolute t-value (|t-value|) may illustrate to what extent each model term contributed to the statistical fit so that the greater the absolute t-value, the more remarkable the corresponding coefficient. The coefficient calculates for ADG model and the related absolute t-values demonstrate that across the attending nutrients and their interactions, the linear effect of dietary SBP had greatest effect on ADG of chicks (|t-value| = 11.34), followed by quadratic effect of SBP × SBP (|t-value| = 4.35), interaction between T and SO (|t-value| = 3.74), linear effect of SO (|t-value| = 3.15), interaction between SBP and SO (|t-value| = 3.04), quadratic effect of SO × SO (|t-value| = 2.67) and linear effect of T (|t-value| = 2.47) (Figure ). The coefficient calculates for FCR model and the related absolute t-values (Table ) indicate that linear effect of dietary SBP has the highest effect on FCR of chicks (|t-value| = 13.04), followed by quadratic effect of SBP × SBP (|t-value| = 4.43), linear effect of SO (|t-value| = 2.90), interaction between SBP and SO (|t-value| = 2.51) (Figure ). Other ADG and FCR model terms were insignificant. Lack of fit for both ADG and FCR models was significant (Table ), showing that a more complicated modelling method or another testing with extra variables should be made.
Figure 1. Absolute t-value indicating contribution of each response surface model term to the statistical fit for average daily body weight gain (ADG) in broiler chicks. SBP: sugar beet pulp; T: tallow; SO: soybean oil (0–7 days of age); ns: not significant.
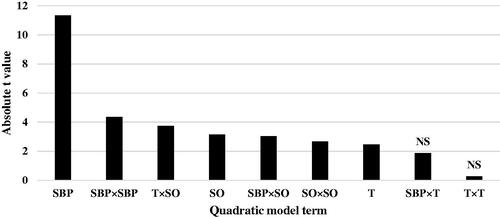
Figure 2. Absolute t-value indicating contribution of each response surface model term to the statistical fit for feed conversion ratio (FCR) in broiler chicks. SBP: sugar beet pulp; T: tallow; SO: soybean oil (0–7 days of age); ns: not significant.
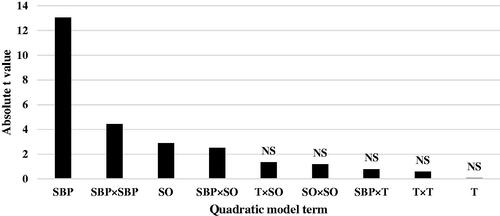
Table 8. Estimated parameters of response surface model for ADG and FCR in broiler chicks from 0 to 7 days of age.
ADG and FCR (7–14 days of age)
The polynomial equation from raw experimental data for ADG (R2 = 0.74; root MSE = 5.33) and FCR (R2 = 0.74; root MSE = 0.24) was generated as follows:
The estimated parameters for SBP, SBP × SBP, SO × SO, and T × SO terms in the ADG model, and SBP, SBP × SBP, SBP × SO, and T × SO terms in the FCR model were significant (p < 0.05). The R2 value was found to be 0.74 and 0.74 for the ADG and FCR model, respectively, showing that the model could explain almost 70% of the responses’ variability. The contribution of each type of effect in the RSM model (linear, quadratic, and interaction) to the statistical fit (in terms of R2) is shown in Table . In the ADG model, the quadratic terms have a superior portion (partial R2 = 0.50) to illustrate available alteration in the response of chickens. It was followed by linear (partial R2 = 0.21) and interaction (partial R2 = 0.04) terms. In the FCR model the linear (partial R2 = 0.42) and quadratic (partial R2 = 0.27) terms had portion to explain present variation in feed efficiency, and the interaction terms (partial R2 = 0.02) had a little role (Table ). Maximum ADG was observed with a diet containing 0.60% SBP, 0.33% T, and 0.45% SO, and least FCR may be gained with a diet including 0.98% SBP, 0.00% T, and 1.00% SO. The predicted ADG and FCR at the optimal points were 43.44 g/bird per day and 1.10, respectively (Table ).
Table 9. Analysis of variance on the experimental results along with contribution of each type of effect (linear, quadratic, and interaction) to the statistical fit in response surface model for ADG and FCR in broiler chicks from 7 to 14 days of age.
The regression coefficient estimates and corresponding t-value and p-value are given in Table . The linear effect of dietary SBP the had greatest effect on ADG of chicks at 14 days of age (|t-value| = 5.88), followed by quadratic effect of SBP × SBP (|t-value| = 4.21), quadratic effect of SO × SO (|t-value| = 3.26) and interaction between T × SO (|t-value| = 3.04) (Figure ). The coefficient estimates for FCR model and the corresponding absolute t-values (Table ) indicate that linear effect of dietary SBP the highest effect on FCR of chicks (|t-value| = 9.00), followed by quadratic effect of SBP × SBP (|t-value| = 6.50), interaction between T × SO (|t-value| = 2.29) and interaction between SBP × SO (|t-value| = 2.07) (Figure ). Other ADG and FCR model terms were insignificant. Lack of fit for both ADG and FCR models was insignificant (Table ), showing that the observed data are in good agreement with the model.
Figure 3. Absolute t-value indicating contribution of each response surface model term to the statistical fit for average daily body weight gain (ADG) in broiler chicks. SBP: sugar beet pulp; T: tallow; SO: soybean oil (0–7 days of age); ns: not significant.
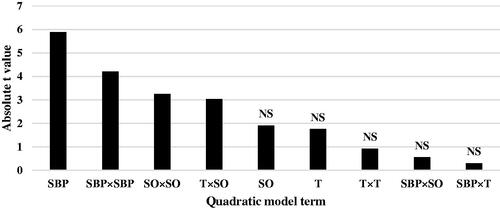
Figure 4. Absolute t-value indicating contribution of each response surface model term to the statistical fit for feed conversion ratio (FCR) in broiler chicks. SBP: sugar beet pulp; T: tallow; SO: soybean oil (0–7 days of age); ns: not significant.
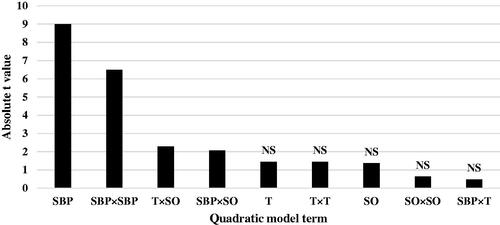
Table 10. Estimated parameters of response surface model for ADG and FCR in broiler chicks from 7 to 14 days of age.
Discussion
Several studies have been conducted on the effect of dietary fibre on broiler performance. Recent research with broilers (Jiménez-Moreno et al. Citation2013), laying pullets (Guzmán et al. Citation2015) and turkeys (Roma et al. Citation1999) has shown that the use of moderate amounts of fibre sources in the diet is beneficial for the development and proper functioning of the gastrointestinal tract and improves nutrient digestibility and productive performance of the birds. Jiménez-Moreno et al. (Citation2009) used two sources of fibre (3% oat hull, 3% sugar beet pulp) and two sources of fat (5% soybean oil, 5% yellow grease) to investigate the broiler performance. They stated that adding temperate values of fibre to the broiler diets could improve the performance and digestibility of nutrients. It was reported that the highest body weight gain and the lowest feed conversion ratio were observed in the broilers receiving 5 g/kg of processed fibre and the group consuming 5 g/kg of corn hulls had the highest feed intake and the highest feed conversion ratio. These researchers attributed the positive effect of processed fibre on performance to its beneficial effect in improving the morphology of the small intestine (Rezaei et al. Citation2012). There are many factors in the response of poultry species to the inclusion of fibre in the diet. Some of these agents are related to the age and species of the bird; some depend on the type of fibre used in the diet, such as the amount of soluble and insoluble fibres, the lignin content, and the particle size. Other factors such as bird management and environmental conditions during breeding, disease challenge, and health status can also be effective in the response of birds to dietary fibre. Therefore, it is not easy to predict the birds’ response to adding fibre to the diet and recommending the appropriate amount of fibre used in the poultry diets (Mateos et al. Citation2012).
Viveros et al. (Citation2009) reported that FCR and ADG were not affected by different sources of fat (saturated and unsaturated). The feed conversion ratio is improved by consuming diets containing sources of unsaturated fatty acids in poultry diets (Villaverde et al. Citation2004). The present study showed that at 7 days of age, the best performance was observed in the groups receiving diets with 0.00% SBP, 0.00% T, and 0.00% SO, which may be due to the incomplete gastrointestinal development. With increasing age and development of the gastrointestinal tract at the age of 14 d, the lowest feed conversion ratio was observed at diet containing 0.98% SBP, 0.00% T, and 1.00% SO. Although various studies have reported the negative effect of soluble fibre sources, in the current study, the presence of SBP (up to 0.98% of diet) in the diet probably improves the development of the gastrointestinal tract and, as a result, ameliorates ADG and FCR at 14d of age.
In young birds, due to insufficient bile and lipase enzymes secretion, the digestion of triglycerides is low. Whereas with increasing age and secretion of bile and lipid digestive enzymes, the bird’s ability to digest fats increases (Freitas et al. Citation2005). Unsaturated fatty acids have higher digestibility and more metabolisable energy, which improve growth performance and reduces carcase fat deposition (Zulkifli et al. Citation2006). Mechanisms that lead to decreased emulsification diminish pancreatic lipase activity and micelle formation in the intestine, which is more relevant for saturated fatty acids. Factors that improve the evolvement of the gastrointestinal tract in broiler chickens and promote bile acid secretion can increase the digestibility and absorption of fat in young chickens (McNab and Boorman Citation2002). In our study, at 14 days of age, ADG was reduced by increasing the fat in the diet, whereas at day 7, the highest ADG was obtained at the 0.00% level of tallow. This shows that younger chickens cannot completely utilise dietary fat. Faria Filho et al. (Citation2008) reported that RSM is efficient in predicting ADG and FCR in broilers. These models allow for more accurate determination of optimal levels of dietary protein, growth temperature, and slaughter age of broilers. It is stated that because of the linear relationship between the factors, response surface, and neural network models showed similar results (Ghanaatparast-Rashti et al. Citation2017). In the other hand, Ahmadi and Golian (Citation2011), in reviewing the response surface models and artificial neural network for broiler performance stated that the artificial neural network models had more accurate and correct predictions for both body weight gain and feed conversion ratio.
Conclusions
Current results showed that with increasing age and evolution of the birds’ gastrointestinal tract, the adverse effects of soluble fibres are decreased, and the broilers can digest and absorb fats more efficiently. During 0–7 days of age, maximum ADG and minimum FCR were observed with a diet containing 0.00% SBP, 0.90% T, and 0.00% SO. The predicted ADG and FCR at the optimal points were 21.56 g/bird per day and 1.01, respectively. At 7–14 days of age, maximum ADG was observed with a diet containing 0.60% SBP, 0.33% T, and 0.45% SO, and the least FCR may be gained with a diet including 0.98% SBP, 0.00% T, and 1.00% SO. The predicted ADG and FCR at the optimal points were 43.44 g/bird per day and 1.10, respectively. Central composite design reduces the number of trials and the costs. The response surface model can be used to describe the relationship of nutrients to reach the optimum point.
Ethical approval
All procedures were approved by the Animal Care and Use Committee of the Ferdowsi University of Mashhad, Mashhad, Iran.
Disclosure statement
No potential conflict of interest was reported by the author(s).
Additional information
Funding
References
- Abudabos AM. 2013. Feeding alternative source of fat to broilers. Res. 10:84–87.
- Ahmadi H, Golian A. 2010. The integration of broiler chicken threonine responses data into neural network models. Poult Sci. 89(11):2535–2541.
- Ahmadi H, Golian A. 2011. Response surface and neural network models for performance of broiler chicks fed diets varying in digestible protein and critical amino acids from 11 to 17 days of age. Poult Sci. 90(9):2085–2096.
- Association of Official Analytical Chemists. 2005. Official methods of analysis of the AOAC. 18th ed. Gaithersburg (MD): Association of Official Analytical Chemists.
- Bangoura M, Wenshui X, Jiali Z. 2009. In vitro binding capacity of cholesterol and bile salts by partially depolymerized chitosans. Am J Food Technol. 4(3):126–135.
- Bartov I. 1988. Fats in poultry nutrition. Poultry Int. 27:70–72.
- Box GEP, Hunter WG, Hunter JS. 1978. Statistics for experimenters: an introduction to design, data analysis and model building. New York (NY): Wiley.
- Collins JL, Post AR. 1981. Peanut hull flour as a potential source of dietary fiber. J Food Science. 46(2):445–448.
- Faria Filho DE, Rosa PS, Torres KAA, Macari M, Furlan RL. 2008. Response surface models to predict broiler performance and applications for economic analysis. Rev Bras Cienc Avic. 10(2):131–138.
- Freitas ER, Sakomura NK, Neme R, Dos AS. 2005. Energetic value of soybean acid oil in poultry nutrition. Rev Bras Cienc Avic. 40:3–8.
- Ghanaatparast-Rashti M, Mottaghitalab M, Ahmadi H. 2017. Effect of in-ovo feeding of beta-hydroxy beta-methylbutyrate and dextrin and posthatching water and feed deprivation on body glycogen resources and jejunal morphology of broilers at 7 days of age using response surface methodology. Iran J Anim Sci. 48:273–286.
- Guzmán P, Saldana B, Mandalawi HA, Pérez-Bonilla A, Lázaro R, Mateos GG. 2015. Productive performance of brown-egg laying pullets from hatching to 5 weeks of age as affected by fiber inclusion, feed form, and energy concentration of the diet. Poult Sci. 94(2):249–261.
- Hosseini-Vashan SJ, Golian A, Yaghoubfar A, Raji A, Nassiri Moghaddam H. 2014. Evaluation of the effects of tomato pomace, herbal oil sources and tallow on blood lipids, plasma enzyme activity and antioxidant system of heat stressed broiler chickens. Iran J Anim Sci. 98:64–75.
- Hu R. 1999. Food product design: a computer-aided statistical approach. Washington (DC): CRC Press.
- Imari ZK, Hassanabadi A, Nassiri Moghaddam H. 2020. Response of broiler chickens to calcium and phosphorus restriction: effects on growth performance, carcase traits, tibia characteristics and total tract retention of nutrients. Ital J Anim Sci. 19(1):929–939.
- Jiménez-Moreno E, Frikha M, de Coca-Sinova A, Garcıa J, Mateos GG. 2013. Oat hulls and sugar beet pulp in diets for broilers. Effects on growth performance and nutrient digestibility. Ani Feed Sci and Technol. 182(1–4):33–43.
- Jiménez-Moreno E, González-Alvarado JM, González-Serrano A, Lázaro R, Mateos GG. 2009. Effect of dietary fiber and fat on performance and digestive traits of broilers from one to twenty-one days of age. Poult Sci. 88(12):2562–2574.
- Józefiak D, Rutkowski A, Jensen BB, Engberg RM. 2006. The effect of beta-glucanase supplementation of barley- and oat-based diets on growth performance and fermentation in broiler chicken gastrointestinal tract. Br Poult Sci. 47(1):57–64.
- Koschayev I, Boiko I, Komienko S, Tatiyanicheva O, Sein O, Zdanovich S, Popova O. 2019. Feeding efficiency of dry beet pulp to broiler chickens. Paper presented at the 1st International Symposium Innovations in Life Sciences; October 10–11; Belgorod, Russia.
- Lerman PM, Bie SW. 1975. Problems in determining the best levels of essential nutrients in feedingstuffs. J Agric Sci. 84(3):459–468.
- Mateos GG, Jiménez-Moreno E, Serrano MP, Lázaro RP. 2012. Poultry response to high levels of dietary fiber sources varying in physical and chemical characteristics. J Appl Poult Res. 21(1):156–174.
- McNab JM, Boorman KN. 2002. Poultry feedstuffs: supply, composition and nutritive value. Wallingford (UK): CABI Publishing.
- Mertens DR, Allen M, Carmany J, Clegg J, Davidowicz A, Drouches M, Frank K, Gambin D, Garkie M, Gildemeister B. 2002. Gravimetric determination of amylase-treated neutral detergent fiber in feeds with refluxing in beakers or crucibles: collaborative study. J AOAC Int. 85:1217–1240.
- Miyamoto A, Chang K. 1992. Extraction and physicochemical characterization of pectin from sunflower head residues. J Food Science. 57(6):1439–1443.
- Myers RH, Montgomery DC, Anderson-Cook CM. 2009. Response surface methodology: process and product optimization using designed experiments. 3rd ed. New York (NY): Wiley.
- Peebles ED, Zumwalt CD, Doyle SM, Gerard PD, Latour MA, Boyle CR, Smith TW. 2000. Effects of dietary fat type and level on broiler breeder performance. Poult Sci. 79(5):629–639.
- Rezaei M, Karimi Torshizi MA, Rouzbehan Y. 2012. Effect of dietary fiber on intestinal morphology and performance of broiler chickens. Iran J Anim Sci. 90:52–60.
- Roma E, Adamidis D, Nikolara R, Constantopoulos A, Messaritakis J. 1999. Diet and chronic constipation in children: the role of fiber. Pediatr Gastroenterol Nutr. 28:169–174.
- Saki A, Matin HH, Zamani P, Tabatabai M, Vatanchian M. 2011. Various ratios of pectin to cellulose affect intestinal morphology, DNA quantitation, and performance of broiler chickens. Livest Sci. 139(3):237–244.
- Velasco S, Ortiz LT, Alzueta C, Rebole A, Trevino J, Rodriguez ML. 2010. Effect of inulin supplementation and dietary fat source on performance, blood serum metabolites, liver lipids, abdominal fat deposition, and tissue fatty acid composition in broiler chickens. Poult Sci. 89(8):1651–1662.
- Villaverde C, Cortinas L, Barroeta AC, Martin-Orué SM, Baucells MD. 2004. Relationship between dietary unsaturation and vitamin E in poultry. J Anim Physiol Anim Nutr. 88(3–4):143–149.
- Viveros A, Ortiz LT, Rodriguez ML, Rebolé A, Alzueta C, Arija I, Centeno C, Brenes A. 2009. Interaction of dietary high-oleic-acid sunflower hulls and different fat sources in broiler chickens. Poult Sci. 88(1):141–151.
- Voelker JA, Allen MS. 2003. Pelleted beet pulp substituted for high-moisture corn: 2. Effects on digestion and ruminal digestion kinetics in lactating dairy cows. J Dairy Sci. 86(11):3553–3561.
- Wathes DC, Abayasekara DR, Aitken RJ. 2007. Polyunsaturated fatty acids in male and female reproduction. Biol Reprod. 77(2):190–201.
- Zulkifli I, Htin NN, Alimon AR, Loh TC, Hair-Bejo M. 2006. Dietary selection of fat by heat-stressed broiler chickens. Asian Australas J Anim Sci. 20(2):245–251.