
 ?Mathematical formulae have been encoded as MathML and are displayed in this HTML version using MathJax in order to improve their display. Uncheck the box to turn MathJax off. This feature requires Javascript. Click on a formula to zoom.
Abstract
Long-term physical restriction may lead to affective and physiological disorders in sows; pupillary light reflex (PLR) characteristics might be a good indicator to diagnose these symptoms. Accordingly, the physiological and psychological states of sows with different PLR characteristics were investigated in this study. Gestating sows of three parities (parity 0, 2, and 5) were divided into strong reflex (SR) and weak reflex (WR) groups, according to a PLR test. In each group, miRNA expression and serum physiological indices were detected. Compared with the SR group, WR group showed lower 5-hydroxytryptamine levels and higher cortisol, interleukin-6, and beta-endorphin levels (p < .05) in all parities; higher immunoglobulin A and tumour necrosis factor-α levels in the parity 0 and 2 sows (p < .05); and lower miR-335, miR-16, and miR-1202 expression (p < .05) and higher miR-132, miR-504, miR-34a, and miR-30e expression in the parity 2 and 5 sows. Compared with the parity 0 sows, parity 5 sows showed higher cortisol, interleukin-6, tumour necrosis factor-α, and beta-endorphin levels; higher miR-504 and miR-34a expression (p < .05); and lower miR-335, miR-16, miR-134, and miR-1202 expression in both groups. Thus, psychophysiological state differs among sows with different PLR characteristics, and, that of sows with weak PLR characteristics, is consistent with depression disorder, and as parity increases, these psychophysiological differences widen.
PLR characteristics could reflect different physiological states including neurophysiological and immunological states in sows.
The miRNA molecular markers and serum physiological indices of sows with weak pupillary light responses were consistent with depression disorder.
Long-term physical restriction might worsen physiological and psychological disorders in sows.
HIGHLIGHTS
Introduction
With a growing interest in better animal welfare, crates have been gradually eliminated in modern pig farming. However, many sows (especially lactating sows) are still confined in crates to improve space utilisation in intensive pig farms. The narrow and barren environment of crates may cause psychological frustration (Fraser et al. Citation2013), depressed psychological responses (Yin et al. Citation2019), and even physiological disorders in sows. These psychophysiological abnormalities of animals are often evaluated by monitoring their behaviour (such as stereotypical behaviour) or physiological discomfort. However, these indicators cannot directly and accurately reflect the psychological state of sows. Pupillary light reflex (PLR) characteristics are considered sensitive markers of psychiatric status (Bao et al. Citation2013) and might be a better way to monitor psychological status of animals.
PLR is controlled by the sympathetic and parasympathetic nerves of the autonomic nervous system (Bar et al. Citation2004). Parasympathetic nerves play an inhibitory role in regulating PLR, while sympathetic nerves play an excitatory role. Certain diseases, drugs, emotions, and other factors affect the activity of the autonomic nervous system, affecting the heart rate, blood pressure and PLR indices (Laeng et al. Citation2012). Abnormal PLR characteristics indicate a disorder of the autonomic nervous system, which might be caused by an individual psychological or neurological disorder. Patients with neurological disorders, including traumatic neurological disorders, anxiety disorders (Bakes et al. Citation1990), specific phobias (Kojima et al. Citation2004), and depression (Laeng et al. Citation2012; Sokolski et al. Citation2000; Siegle et al. Citation2001), exhibit specific PLR characteristics. Bao et al. found that stall-housed sows showed more prolonged PLR latenies and longer PLR durations than group-housed sows (Bar et al. Citation2004). These symptoms indicated the poor psychological state of sows, and the chronic stress caused by their restricted activities played an important role in these results.
Animals in a poor psychological state have also been found to exhibit other physiological disorders, such as immune response disorders (Laeng et al. Citation2012; Singh and Chaudhuri Citation2014); inflammatory response disorders (Bergink et al. Citation2014; Muller Citation2018); and the abnormal release of endogenous opioid peptides (Lutz and Kieffer Citation2013), neurotransmitters 5-hydroxytryptamine (5-HT), dopamine (DA), and stress hormones (Keay et al. Citation2006; Joels et al. Citation2007; Kim and Haller Citation2007). These symptoms resulted from long-term confinement in a narrow and barren environment, and could also predict the psychological distress of the animal. Studies have shown that immune inflammatory responses can induce schizophrenia and bipolar disorder (Lutz and Kieffer Citation2013; Muller Citation2018). In addition, increased levels of proinflammatory cytokines, including interleukin-6 (IL-6) and tumour necrosis factor-α (TNF-α), have been found in patients with schizophrenia (Bergink et al. Citation2014; Fillman et al. Citation2014) and depression (Hussein et al. Citation2015; Filho et al. Citation2018; Mao et al. Citation2018). The immunoglobulin A (IgA) concentration was significantly higher in the serum of patients with depression than in that of other people (Gold et al. Citation2012; Maes et al. Citation2012). Major depressive disorder (MDD) has also been found to be associated with changes in endogenous opioid peptides (Keay et al. Citation2006). Emotional abnormalities caused by environmental stress, such as depression and anxiety, have been related to abnormal levels of neurotransmitters such as DA and 5-HT (Xiao et al. Citation2017; Li et al. Citation2020). 5-HT levels were also reduced in a model of depression induced by social isolation stress in adult mice (Wang et al. Citation2019). These studies provide a basis for revealing the physiological value of different PLR characteristics in sows.
Specific PLR characteristics can be observed in sows following psychological distress and changes of physiological state in sows reflect various psychological disorders. It is therefore necessary to accurately identify these states in sows. MiRNA is a short, non-coding RNA that regulates brain development and dendritic spine morphology. They play a role in the pathogenesis of many psychiatric disorders, including schizophrenia (Jian et al. Citation2017; Xu et al. Citation2019) and depression (Zurawek et al. Citation2016; Tavakolizadeh et al. Citation2018); thus, they have been used as an important clinical diagnostic biomarker (Smigielski et al. Citation2020). MiR-335 (Li et al. Citation2015), miR-1202 (Fiori et al. Citation2017; Lopez et al. Citation2017), and miR-16 (Song et al. Citation2015) are down-regulated in patients with depression. Brain-derived neurotrophic factor (BDNF) expression and synaptic plasticity are regulated by miR-134 and miR-132 (Shen et al. Citation2019), and the former is involved in nervous system function and functional plasticity during depression (Castren and Rantamaki Citation2010). In patients with schizophrenia, plasma miR-30e (Sun et al. Citation2015a) and brain tissue miR-34a expression were significantly increased and miR-30e expression was significantly reduced after treatment with antipsychotic drugs (Sun et al. Citation2015b). Rats under chronic stress were found to have high miR-504 expression in their nucleus accumbens, and their miR-504 levels were positively correlated with the severity of depression-like behaviour after stress (Zhang et al. Citation2013). In summary, miRNA may be a good biomarker for the diagnosis and treatment of multiple affective disorders. Therefore, detecting the expression levels of miRNA markers in sows with different PLR characteristics could identify the psychological state of sows.
In this study, we focus on the variations in the PLR characteristics of sows (same parity) continuously confined for similar periods and use this variation as the basis for distinguishing their affective states. This could help create a sow psychological states evaluation system from a new perspective. The affective disorders of confined sows with different PLR characteristics were diagnosed by determining the levels of immunoregulatory factors, endogenous peptides, neurophysiological indicators, and the relative expression of some serum miRNAs to verify if the psychological state of sows can be determined by PLR characteristics. This study could elucidate whether there is differentiation among the affective states of sows affected by confining environments, and promote sow welfare research from qualitative to quantitative methods.
Materials and methods
Animals, treatments, management, and feeding
This experiment was approved by the Animal Ethics Committee of the College of Animal Science and Veterinary Medicine, Heilongjiang Bayi Agricultural University and conducted on a commercial pig farm (Heilongjiang Damuren Animal Husbandry Co, Ltd.) located in Heilongjiang Province in northeast China. A total of 48 Yorkshire × Landrace sows with different parity (parity 0, 2, and 5; 16 sows each) were selected. All sows had been pregnant for 42–95 d and were housed in identical gestation crates (2.15 × 0.65 × 0.96 m, length × width × height). The sows were selected from a large group through strict healthy cheques and had received standard immunisation procedures. The physiological status of each sow was as consistent as possible. The housing temperature and humidity were maintained at 18–20 °C and 60–62%. All sows were fed at 06:00 am (3.0 kg each) and were provided ad libitum access to water. The nutritional standards of the formula feed for pregnant sows are shown in Table . The gestation crates were cleaned at 06:30 am; other management practices were conducted following the uniform standards for commercial pig farms.
Table 1. Nutritional standards of formula feed for pregnant sows (%).
Pupillary light reflex test
PLR characteristics in each group were assessed using a hand-held pupillometer Neur Optics PLR-200 (NeurOptics, Laguna Hills, CA). The PLR test was conducted from 08:00 to 09:00 am each day under an illuminance intensity of <250 l×. Each eye of every sow was measured three times for the following parameters at an interval of >5 min: maximum pupil diameter, minimum pupil diameter, contraction rate of pupil, latency of the pupillary response, average contraction velocity, maximum contraction velocity, average dilation velocity, and time for 75% recovery of the initial pupil diameter. All indicators of PLR are defined in Table .
Table 2. Definitions of pupillary light reflex indicators.
Sample collection
The blood of all sows was sampled from the anterior vena cava before feeding. The sampling time of each sow did not exceed 5 min. All blood sample were collected in 5-mL anticoagulant or 5-mL procoagulant tubes. The samples in procoagulant tubes were centrifuged (1200 g, 10 min; Cence, Changsha HN, China) after allowing them to stand for 30 min. The serum was collected in enzyme-free EP tubes. All blood samples were stored in a liquid nitrogen container until the assay.
Serum indicator measurements
The concentrations of cortisol (COR), 5-HT, DA, IgA, TNF-α, and beta-endorphin (β-EP) were determined using commercial enzyme-linked immunosorbent assay kits (MLBIO Biotechnology, Shanghai, China).
miRNA expression analysis
The expression of miR-335, miR-1202, miR-16, miR-134, miR-132, miR-504, miR-30e, and miR-34a in each group was detected by quantitative real-time polymerase chain reaction (qPCR). Total RNA was extracted from whole blood using a TRIzol kit and dissolved in diethyl pyro carbonate (Sigma, St. Louis, MO). The concentration and purity of the RNA were determined using an ultra-micro spectrophotometer K5600 (KAIAO Technology, Beijing, China). Reverse transcription (RT)-PCR was performed according to the manufacturer instructions for the Prime Script RT Reagent Kit with gDNA Eraser (Takara Bio, Dalian, LN, China). RT-PCR was conducted in a PCR machine, the Cycler™ II (Select Bioproducts, New York City, NY); the program was set as follows: 37 °C, 60 min → 85 °C, 5 min → 4 °C, ∞. After the reaction was completed, the obtained cDNA solution was stored at −20 °C. For conducting qPCR, three replicate wells per sample were prepared. The internal reference for the primers (Scientia Biotech, Harbin, HL, China) (Table ) was U6. qPCR was carried out using a Real-Time PCR Detection System (Bio-Rad Laboratories, Hercules, CA), according to the following reaction conditions: 95 °C, 30 s → 95 °C, 5 s → 60 °C, 30 s → 4 °C, ∞, repeated for 40 cycles. The Ct value of each sample was recorded, and the relative miRNA expression was calculated using the 2−ΔΔCt method.
Table 3. Primer sequence.
Statistical analysis
IBM SPSS statistics 19.0 (IBM, Armonk, NY, USA) was used to analyse the data. The PLR data from the left and right eye of each sow were analysed by Fisher’s exact test. The data are expressed as means ± standard deviations. As shown in Table , PLR data from the left and right eyes of the sows showed no significant differences (p > .05, Table ). Therefore, the PLR data from left and right eyes were regarded as repeated data.
Table 4. PLR indicators in left and right eyes of sows.
All PLR indicators were measured using the Kaiser-Meyer-Olkin test. The results of the Bartlett's test showed that the PLR data could be used for factor analysis. The principal component load matrix (U) was calculated using the formula (U: principal component load matrix; A: component matrix; λ: eigenvalue). The Analyse–Descriptive Statistics–Descriptives procedure was followed to standardise the variables, and the comprehensive evaluation score (Y) was calculated using the Transform–Compute Variables procedure. The results showed that the variance contribution rates of the principal components, Y1 and Y2, were 66.413% and 17.527% (Y1 = 0.243X1 + 0.380X2 + 0.413X3 + 0.374X4 + 0.407X5 + 0.386X6 − 0.269X7 − 0.314X8; Y2 = 0.653X1 + 0.381X2 + 0.050X3 + 0.068X4 − 0.177X5 − 0.332X6 + 0.529X7 + 0.023X8). The sows of each parity were divided into weak reflex (WR) and strong reflex (SR) groups, according to their comprehensive evaluation score (Y) (YWR < 0, YSR > 0.8 for the sows in each group), which was determined as follows:
where W1 and W2 correspond to the cumulative variance contribution rates. According to the results of the Kolmogorov–Smirnov test, data on physiological and miRNA expression were found to be normally distributed and were therefore analysed using the independent samples t-test and Fisher’s exact test. The results were expressed as means ± standard deviations.
Results
Neurophysiological indicators among confined sows with different parities and different PLR
Compared with the serum COR and 5-HT concentrations in SR group sows of all parity, the COR concentration was significantly higher in the WR group (p < .05, Figure )), and the serum 5-HT concentration was significantly lower (p < .05, Figure )). Compared with the serum DA concentrations in the SR group of gilts (parity 0), the concentration in the WR group was significantly lower (p < .05, Figure )).
Figure 1. Neurophysiological Indicators levels in confined sows with different parity and different pupillary light reflex (PLR) characteristics, including neurophysiological indicators Among Confined Sows with Different PLR (A1, B1, C1), neurophysiological indicators Among Confined Sows with Different Parities (A2, B2, C2). The parities include parity 0 (P0), parity 2 (P2), and parity 5 (P5). The PLR characteristics include weak reflex (WR) and strong reflex (SR). Differences in the (A1, A2) serum cortisol (COR) level; (B1, B2) serum 5-hydroxytryptamine (5-HT) level; (C1, C2) serum dopamine (DA) level among different parity and different PLR groups in confined sows. The standard deviation is expressed by error bars, *p < .05.
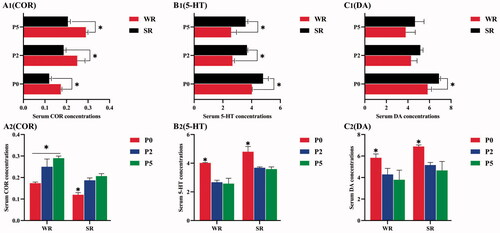
When comparing the serum concentrations of the neurophysiological indicators between sows of different parities with the same PLR characteristics, the serum 5-HT and DA concentrations were significantly lower in in parity 2 or 5 than in parity 0 both the WR and SR groups (p < .05, Figure ), C2), whereas the serum COR concentration was significantly higher in parity 2 or 5 than in parity 0 (p < .05, Figure )). Parity 5 sows in the WR group also had higher COR serum concentrations than parity 2 sows (p < .05, Figure )).
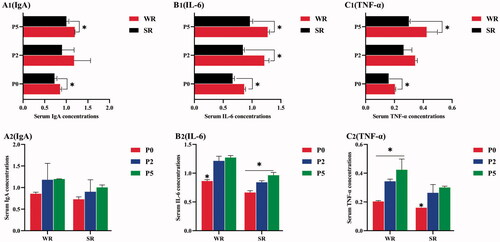
Figure 2. Immunoregulatory Factors levels in confined sows with different parity and different pupillary light reflex (PLR) characteristics, including immunoregulatory Factors Among Confined Sows with Different PLR (A1, B1, C1), immunoregulatory Factors Among Confined Sows with Different Parities (A2, B2, C2). The parities include parity 0 (P0), parity 2 (P2), and parity 5 (P5). The PLR characteristics include weak reflex (WR) and strong reflex (SR). (A1, A2) serum immunoglobulin A (IgA) level; (B1, B2) serum interleukin-6 (IL-6) level; (C1, C2) serum tumour necrosis factor-α (TNF-α) level among different parity and different PLR groups in confined sows. The standard deviation is expressed by error bars, *p < .05.
Immunoregulatory factors among confined sows with different parities and PLR characteristics
Compared with the serum IgA, TNF-α, and IL-6 concentrations in SR-group sows of the same parity, those concentrations in the WR group were significantly higher in the parity 0 and 5 (p < .05, Figure –C1)). And the serum IL-6 c concentrations of the WR group sows were also significantly higher in the parity 2 (p < .05, Figure )).
When comparing the serum concentrations of immunoregulatory factors among sows of different parities with the same PLR characteristics, these concentrations generally increased with parity. The serum IL-6 and TNF-α concentrations in parity 5 sows were significantly higher than those in gilts in both the WR and SR groups (p < .05, Figure , C2)).The serum IL-6 concentrations in parity 5 was significantly higher than those in parity 2 sows in the SR groups (p < .05, Figure )).The serum TNF-α concentrations in parity 5 was significantly higher than those in parity 2 sows in the WR groups (p < .05, Figure )). However, IgA concentration was not significantly different among different-parity sows (p > .05, Figure )).
β-EP among confined sows with different parities and different PLR characteristics
Serum β-EP concentrations in WR sows were significantly higher than those in SR sows of the same parity, for every parity (p < 0.05, Figure )).
Figure 3. β-EP indicator levels in confined sows with different parity and different pupillary light reflex (PLR) characteristics, including β-EP Among Confined Sows with Different PLR (A1), β-EP Among Confined Sows with Different Parities (A2). The parities include parity 0 (P0), parity 2 (P2), and parity 5 (P5). The PLR characteristics include weak reflex (WR) and strong reflex (SR). Differences in the (A1, A2) serum beta-endorphin (β-EP) level among different parity and different PLR groups in confined sows. The standard deviation is expressed by error bars, *p < .05.
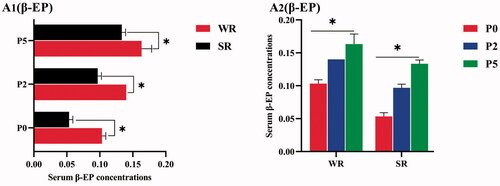
When comparing β-EP concentrations among sows of different parities with the same PLR characteristics, the serum β-EP in parity 5 sows was significantly higher than those in parity 0 and 2 sows in both the WR and SR groups (p < .05, Figure ), whereas the serum β-EP in parity 2 sows was significantly higher than that of gilts in both the WR and SR groups (p < .05, Figure )).
miRNA expression among confined sows with different parities and different PLR characteristics
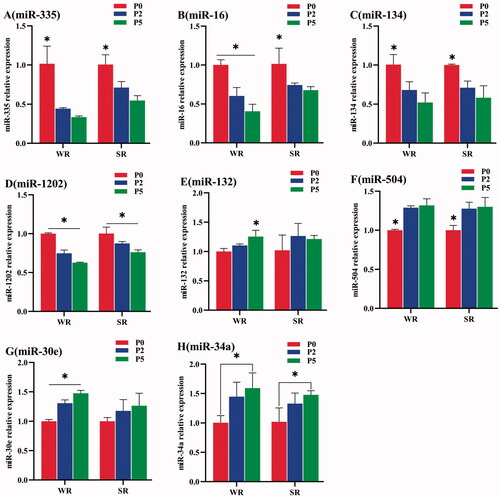
MiR-335, miR-16, miR-1202, miR-134 were high expression in the SR group of all parity, while miR-132, miR-504, miR-30e, miR-34a were high expression in the WR group of all parity. And, the relative miRNA expression differences between the WR and SR groups became larger with the increase of parity. However, the differences between the WR and the SR group were significant only in parity 2 or 5 sows (Figure ).
Figure 4. Relative miRNA expression in sows with different PLR characteristics but the same parity. (A) The relative expression of miR-335; (B) miR-16; (C) miR-134; (D) miR-1202; (E) miR-132; (F) miR-504; (G) miR-30e; and (H) miR-34a. The standard deviation is expressed by error bars, *p < .05; **p < .01.
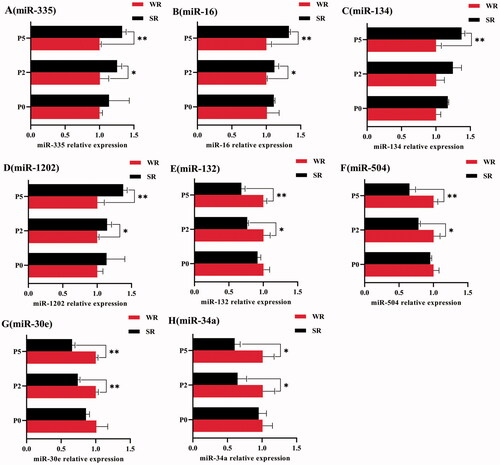
In parity 2 sows, the relative expression of miR-335, miR-16, and miR-1202 was significantly lower in the WR group than in the SR group (p < 0.05, Figure ). However, the relative expression of miR-132, miR-504, miR-34a (p < 0.05, Figure ), and miR-30e (p < 0.01, Figure ) was higher in the WR group.
In parity 5 sows, the relative expression of miR-335, miR-16, miR-134, and miR-1202 was extremely significantly lower in the WR group than in the SR group (p < .01, Figure ), whereas the relative expression of miR-132, miR-504, miR-30e (p < .01, Figure ), and miR-34a (p < .05, Figure ) was higher in the WR group.
When comparing the relative miRNA expression among sows with different parities but the same PLR characteristics, the relative expression of miR-335, miR-16, miR-134, and miR-1202 of gilts were significantly higher than those of parity 2 or 5 sows in both the WR and SR groups (p < .05, Figure ), whereas the relative expression of miR-504 and miR-34a of gilts was lower than those of parity 2 or 5 sows in the WR groups (p < .05, Figure ).
Figure 5. Relative miRNA expression among sows with different parities but the same PLR characteristics. (A) The relative expression of miR-335; (B) miR-16; (C) miR-134; (D) miR-1202; (E) miR-132; (F) miR-504; (G) miR-30e; and (H) miR-34a. The standard deviation is expressed by error bars, *p < .05.
The relative expression of miR-134, miR-504, and miR-34a showed no significant differences between parity 2 and 5 sows with the same PLR characteristics, in either the WR or SR groups (p > .05, Figure ). The relative expression of miR-16, miR-1202, and miR-30e of the WR group was significantly lower in parity 5 sows than in parity 2 sows (p < .05, Figure ). Moreover, the relative expression of miR-1202 in parity 5 sows was significantly lower than that of parity 2 sows in the SR group (p < .05, Figure ). The relative expression of miR-132 and miR-30e of parity 5 sows was significantly higher than that of parity 0 or 2 sows in the SR group (p < .05, Figure ).
Discussion
Neurophysiological indicators of confined sows with different PLR characteristics
There were differences in serum 5-HT, COR, and DA concentrations in confined sows with different PLR characteristics, indicating that these sows had different neurophysiological states. Compared with the SR group, the WR group had lower 5-HT and DA serum concentrations and higher COR serum concentrations. As a suppressive neurotransmitter, 5-HT can regulate mood. Therefore, patients with depression usually report a gloomy and dejected mood, accompanied by low levels of 5-HT. In a rat model of depression, blood 5-HT concentration was effectively relieved after treatment with antidepressants (Jang et al. Citation2019). The serum concentrations of DA were found have the same trends as those of 5-HT in this study. Zhu et al. demonstrated that both maternal deprivation and chronic mild stress could induce depression-like behaviour in rats via the dopaminergic system (Zhu et al. Citation2011). Li et al. (Citation2020) found that oxytocin exerts antidepressant-like effects by improving DA levels in the medial prefrontal cortex. This work shows that the low level of 5-HT is consistent with depression in the WR group sows. In addition, Maeda et al. (Citation2019) found that patients with depression and Alzheimer's disease show higher COR levels, suggesting that neurodegenerative lesions, mainly causing cognitive dysfunction, may occur under stress. Collectively, this work has confirmed that low levels of 5-HT and DA in the blood are typical symptoms of depression and that chronic stress owing to a restrictive environment is the main reason for depression in sows. The results of this study indicate that sows with different PLR characteristics suffer from different mood disorders. In addition, the sows in the WR group exhibited the typical neurophysiological symptoms of depression. For sows with different parities, the serum concentrations of 5-HT and DA reduced with increasing parity and those of COR showed an increasing trend. These indicators in parity 0 sows were significantly different from those in parity 2 and 5 sows. The narrow and barren environment in the crates restricted the normal behaviour and normal psychological expression of the sows, which is a source of anxiety in captive animals. This leads to increased activity of the hypothalamic–pituitary–adrenal axis and the release of glucocorticoids (Morris et al. Citation2012). In this study, serum COR concentration increased with restriction duration, implying that long-term high levels of COR in sows resulting from chronic stress could affect the body's emotional state (Joels et al. Citation2007). Studies have shown that environmental stress leads to an increased risk of depression and anxiety (Pace et al. Citation2006), and animals reared in a stressful environment are more likely to show depression-like behaviour in adulthood. In this study, parity 2 and 5 sows were restricted for a longer time, and their 5-HT and DA serum concentrations were significantly lower than those of gilts. These sows could be considered to have depression. In summary, sows in the WR group had higher levels of COR than those in the SR group, which might indicate the dysfunction of hypothalamic–pituitary–adrenal (HPA) axes. The changes of 5-HT and DA levels might be the manifestation of their psychological disorder. In addition, as parity increases, these symptoms worsen.
Immunoregulatory factors in confined sows with different PLR characteristics
The body's immune functioning is influenced by the environment. Meanwhile, immune function also affects mood and the body's psychological condition (Herrmann-Lingen et al. Citation2019). Abnormal immune and inflammatory reactions could affect the brain, resulting in emotional dysfunction. These reactions are also involved in the development of various mental diseases, including schizophrenia and bipolar disorder (Lutz and Kieffer Citation2013; Muller Citation2018). Zhang et al. (Citation2017) found that IL-6 mRNA was highly expressed in the hippocampus, frontal cortex, and hypothalamus of confined sows, and this was closely associated with the psychological stress of the sows. Therefore, chronic inflammation and immune disorders might be symptoms of psychological abnormalities in sows. Our results showed that the TNF-α, IgA, and IL-6 serum concentrations of the WR group were significantly higher in parity 0 and 5. The dysfunction of the immune system and HPA axis dysregulation are common in chronic stress-induced depression (McEwen Citation1999). Dysfunction of the 5-HT axis can also cause malfunctions of the HPA axis, which in turn activates the cytokine interleukin (IL)-1β signalling pathway, while proinflammatory cytokines could further induce emotional disorders such as depression (Pineda et al. Citation2010; Leonard Citation2014). Studies using a mouse depression model have shown that the mice not only exhibit major pathological symptoms related to depression but also have elevated IL-6 and TNF-α levels in their blood (Ghosh et al. Citation2020; Alshammari et al. Citation2020). Simeonova et al. (Citation2020) detected higher blood levels IgA in patients with MDD. Day et al. also found that German shepherds with depression had higher serum IgA levels (Day et al. Citation1985). These findings indicate that the changes in serum immunomodulatory factors in the WR group sows are consistent with HPA axis dysregulation, which might also contribute to the psychological abnormalities of sows.
In addition, the IL-6 and TNF-α concentrations of gilts were significantly lower than those of parity 5 sows in both the WR and SR groups. This might be the result of long-term chronic stress owing to restricted activities. Environmental stress causes the level of various proinflammatory markers to increase in sows. This was also found in patients with MDD and schizophrenia (Filho et al. Citation2018), and an increasing number of studies have confirmed that chronic psychological stress mediates a variety of affective disorders, including depression and anxiety in animals (Bao et al. Citation2013; Muller Citation2018; Maeda et al. Citation2019). Studies have found that long-term stress also increases the risk of MDD and the level of inflammatory markers (such as IL-6) (Tannous et al. Citation2020). Elevated levels of inflammatory cytokines could cause neuroinflammation or damage brain functioning, which is an important factor leading to various affective disorders (Maeng and Hong Citation2019).
β-EP in confined sows with different PLR characteristics
β-EP and endomorphin-2 function as both hormones and neuromodulators (Janecki et al. Citation2004). Emotional state is significantly influenced by β-EP (Smith et al. Citation1990), and research shows that serum β-EP levels in patients with depression are significantly increased (Millan et al. Citation1981). β-EP serum concentrations in the WR group were significantly higher than those in the SR group in every parity and the β-EP levels in parity 2 and 5 sows were significantly higher than those of gilts in both the WR and SR groups. These results indicate that the sows in the WR group were depressed and that these symptoms will worsen with increasing restriction time.
miRNA expression in confined sows with different PLR characteristics
MiRNAs target and regulate the expression of various genes and are involved in the development, proliferation, and differentiation of neurons. MiRNAs have been shown to be related to the pathogenesis of many psychiatric disorders, including schizophrenia (Ambros Citation2004). Therefore, some miRNAs can be used as biomarkers for psychological obstacles. They were effective for evaluating psychological disorders in sows with different PLR characteristics in our study. The downregulation of miR-335 (Fiori et al. Citation2017), miR-1202 (Song et al. Citation2015), and miR-16 (Shen et al. Citation2019) might be related to the depression of the sows. Among these miRNAs, miR-335 was down-regulated in the prefrontal cortex (Smalheiser et al. Citation2012) and blood (Lopez et al. Citation2017) of patients with depression and was up-regulated after anti-depressant treatment. MiR-1202 is related to the pathophysiology of depression, which can be improved by the regulation of the target gene of this miRNA, GRM4. Based on this, previous studies have reported that miR-1202 is significantly reduced in the brain of patients with MDD (Lopez et al. Citation2014) and that it increases after treatment (Song et al. Citation2015; Lopez et al. Citation2017). MiR-16 might participate in the physio-pathological process of MDD by regulating the expression of serotonin transporter genes (Shen et al. Citation2019). Low levels of miR-16 have been observed in animal depression models of chronic mild stress, which may prevent the animals from resisting stress (Smigielski et al. Citation2020). There was a correlation found between miR-134 and effective mood stabilisers (Rong et al. Citation2011); downregulation of the miR-134 pathway was found in a chronic stress-induced depression model, which may be related to its effect of stabilising emotions (Castren and Rantamaki 2010). The relative expressions of miR-335, miR-16, miR-134, and miR-1202 in the WR group were lower, indicating that the WR group might be in a depressed psychological state, and chronic stress seems to be the main reason for these results.
The relative expression of miR-132, miR-504, miR-30e, and miR-34a in the WR group was higher than that in the SR group, which also indicates that the WR group might be in a depressed psychological state. The high levels of miR-30e and miR-34a were also consistent with schizophrenia in the WR group sows, but this has not been previously reported in sows. MiR-132 and BDNF have a mutually regulating effect that plays an important role in maintaining neuronal activity and regulating neuronal morphology. It is closely related to the occurrence of various mental diseases. MiR-132 expression was found to be up-regulated in patients with depression (Li et al. Citation2013). MiR-504 plays an important role in the development of the rat neurotransmission system, which also affects brain functioning and emotional state; high expression of miR-50 was observed in rat depression models (Huang and Li Citation2009). In addition, the miR-34 family (including miR-34a) is associated with environmental stress, and strongly induced by the TP53 gene, which is a key cell cycle control gene and can also regulate the expression of emotional molecules (Haramati et al. Citation2011). The expression characteristics of miR-30e is positively correlated with depression and the onset of symptoms. Studies have shown that the expression of miR-30e is increased in the peripheral blood samples and post-mortem brain tissue samples of patients with depression (Gorinski et al. Citation2019). These foundings indicate that high expression of miR-30e is also an important factor in depression. The latest research shows that miR-34a is involved in the pathological process of Alzheimer’s disease, schizophrenia, depression, and other mental diseases (Cogswell et al. Citation2008).
Same-parity sows with different PLR characteristics showed different relative expression levels of miRNAs. Although relative miRNA expressions did not significantly differ between the WR and SR groups in gilts, the gap is widening noticeably with the increasing of parities. The relative expression of miR-335, miR-16, miR-134, and miR-1202 down-regulated with the increase of parity, and the relative expression of those miRNA in the parity 5 sows was significantly lower than that of gilts in both the WR and SR groups. While the relative expression of miR-132, miR-504, miR-30e, and miR-34a up-regulated with the increase of parity, and the relative expression of miR-504, miR-34a in the parity 5 sows was significantly higher than that of the gilts in both the WR and SR groups. These results indicate that short-term physical activity restrictions could cause physiological abnormalities in sows, including immune-related and neurophysiological abnormalities, while long-term confinement can induce psychological abnormality in sows over time. In addition, the relative expression of miRNA in the serum of the WR group sows were consistent with depression and that this depression-like physiological state became more obvious as parity increased.
The evidence presented in this study indicates that individualised differences in the effects of adverse environments on emotions of sows can be reflected by PLR. However, there are limitations in the quantitative relationship between PLR characteristics and affective disorders, and the mechanisms that causes sows to manifest specific PLR characteristics are still unclear.
Conclusions
Differences in the levels of immunoregulatory factors, endogenous peptides, and neurophysiological indicators and the relative expression of some miRNAs among confined sows with different PLR characteristics show that there were different psychophysiological states among these sows. Short-term physical activity restriction could cause physiological abnormalities in sows, including immune-related and neurophysiological abnormalities. As parity increases, recurrent periods of restriction can induce the psychological abnormality in sows over time. The physiological and psychological states of sows in the WR group were consistent with depression disorder, and the chronic stress caused by restricted activities was an important factor that led to this condition. Our results could help create a sow welfare evaluation system and promote sow welfare research from qualitative to a quantitative process. Further, to improve the evaluation criteria of PLR, a correlation analysis experiment will be performed using a large amount of data in our next study.
Ethical approval
This study was approved by the Animal Ethics Committee of the Animal Science and Veterinary College of Heilongjiang Bayi Agricultural University.
Acknowledgments
The miRNA-expression analysis was performed at Harbin Scientia Biotechnology Corporation; we thank the staff of the facility for their assistance with this analysis.
Disclosure statement
No potential conflicts of interest were reported by the author(s).
Additional information
Funding
References
- Alshammari TK, Alghamdi H, Alkhader LF, Alqahtani Q, Alrasheed NM, Yacoub H, Alnaem N, Alnakiyah M, Alshammari MA. 2020. Analysis of the molecular and behavioral effects of acute social isolation on rats. Behav Brain Res. 377:1–8.
- Ambros VR. 2004. The functions of animal microRNAs. Nature. 431(7006):350–355.
- Bakes A, Bradshaw CM, Szabadi E. 1990. Attenuation of the pupillary light reflex in anxious patients. Br J Clin Pharmacol. 30(3):377–381.
- Bao J, Li X, Lv FL, Chen D, Li J. 2013. Prolonged latency of pupillary light reflex in confined sows: possible stress-related symptom? J Vet Behav-Clin Appl Res. 8(6):475–478.
- Bar K, Greiner W, Jochum T, Friedrich M, Wagner G, Sauer H. 2004. The influence of major depression and its treatment on heart rate variability and pupillary light reflex parameters. J Affect Disord. 82(2):245–252.
- Bergink V, Gibney SM, Drexhage HA. 2014. Autoimmunity, inflammation, and psychosis: a search for peripheral markers. Biol Psychiatry. 75(4):324–331.
- Castren E, Rantamaki T. 2010. The role of BDNF and its receptors in depression and antidepressant drug action: reactivation of developmental plasticity. Dev Neurobiol. 70:289–297.
- Cogswell JP, Ward J, Taylor IA, Waters M, Shi Y, Cannon B, Kelnar K, Kemppainen J, Brown D, Chen C, et al. 2008. Identification of miRNA changes in Alzheimer's disease brain and CSF yields putative biomarkers and insights into disease pathways. J Alzheimers Dis. 14(1):27–41.
- Day MJ, Eger CE, Shaw SE, Penhale WJ. 1985. Immunologic study of systemic aspergillosis in German Shepherd dogs. Vet Immunol Immunopathol. 9(4):335–347.
- Filho AJMC, Lima CNDC, Vasconcelos SMM, De Lucena DF, Maes M, Macedo DS. 2018. IDO chronic immune activation and tryptophan metabolic pathway: a potential pathophysiological link between depression and obesity. Prog Neuropsychopharmacol Biol Psychiatry. 80(Pt C):234–249.
- Fillman SG, Sinclair D, Fung SJ, Webster MJ, Weickert CS. 2014. Markers of inflammation and stress distinguish subsets of individuals with schizophrenia and bipolar disorder. Transl Psychiatr. 4:1–10.
- Fiori LM, Lopez JP, Richard-Devantoy S, Berlim M, Chachamovich E, Jollant F, Foster J, Rotzinger S, Kennedy SH, Turecki G. 2017. Investigation of miR-1202, miR-135a, and miR-16 in major depressive disorder and antidepressant response. Int J Neuropsychoph. 20(8):619–623.
- Fraser D, Duncan IJH, Edwards SA, Grandin T, Gregory NG, Guyonnet V, Hemsworth PH, Huertas SM, Huzzey JM, Mellor DJ, et al. 2013. General principles for the welfare of animals in production systems: the underlying science and its application. Vet J. 198(1):19–27.
- Ghosh S, Choudhury S, Chowdhury O, Mukherjee S, Das A, Sain A, Gupta P, Adhikary A, Chattopadhyay S. 2020. Inflammation-induced behavioral changes is driven by alterations in Nrf2-dependent apoptosis and autophagy in mouse hippocampus: role of fluoxetine. Cell Signal. 68:1–55.
- Gold PW, Pavlatou MG, Carlson PJ, Luckenbaugh DA, Costello R, Bonne O, Csako G, Drevets WC, Remaley AT, Charney DS, et al. 2012. Unmedicated, remitted patients with major depression have decreased serum immunoglobulin A. Neurosci Lett. 520(1):1–5.
- Gorinski N, Bijata M, Prasad S, Wirth A, Abdel Galil D, Zeug A, Bazovkina D, Kondaurova E, Kulikova E, Ilchibaeva T, et al. 2019. Attenuated palmitoylation of serotonin receptor 5-HT1A affects receptor function and contributes to depression-like behaviors. Nat Commun. 10(1):1–14.
- Haramati S, Navon I, Issler O, Ezra-Nevo G, Gil S, Zwang R, Hornstein E, Chen A. 2011. microRNA as repressors of stress-induced anxiety: the case of Amygdalar miR-34. J Neurosci. 31(40):14191–14203.
- Herrmann-Lingen C, Melzer J, von Boetticher D. 2019. Emotions, bodily changes, and the social environment: how did early psychosomatic medicine consider the social dimension in health and disease? Psychosom Med. 81(8):694–703.
- Huang W, Li MD. 2009. Differential allelic expression of dopamine D1 receptor gene (DRD1) is modulated by microRNA miR-504. Biol Psychiatry. 65(8):702–705.
- Hussein KA, Duaa AA, Arafat HA. 2015. IL-6, IL-18, sIL-2R, and TNFα proinflammatory markers in depression and schizophrenia patients who are free of overt inflammation. J Affect Disord. 182:106–114.
- Janecki T, Fichna J, Janecka A. 2004. Opioid receptors and their ligands. Curr Top Med Chem. 4(1):1–17.
- Jang D, Lee H, Lee K, Kim K, Won R, Lee SE, Shim I. 2019. White ginseng ameliorates depressive behavior and increases hippocampal 5-HT level in the stressed ovariectomized rats. Biomed Res Int. 2019:1–7.
- Jian C, Lu M, Zhang Z, Liu L, Li X, Huang F, Xu N, Qin L, Zhang Q, Zou D. 2017. miR-34a knockout attenuates cognitive deficits in APP/PS1 mice through inhibition of the amyloidogenic processing of APP. Life Sci. 182:104–111.
- Joels M, Karst H, Krugers HJ, Lucassen PJ. 2007. Chronic stress: implications for neuronal morphology, function and neurogenesis. Front Neuroendocrinol. 28(2–3):72–96.
- Keay JM, Singh J, Gaunt MC, Kaur T. 2006. Fecal glucocorticoids and their metabolites as indicators of stress in various mammalian species: a literature review. J Zoo Wildl Med. 37(3):234–244.
- Kim JJ, Haller J. 2007. Glucocorticoid hyper- and hypofunction: stress effects on cognition and aggression. Ann N Y Acad Sci. 1113:291–303.
- Kojima M, Shioiri T, Hosoki T, Kitamura H, Bando T, Someya T. 2004. Pupillary light reflex in panic disorder. A trial using audiovisual stimulation. Eur Arch Psych Clin Neurosci. 254:242–244.
- Laeng B, Sirois S, Gredeback G. 2012. Pupillometry: a window to the preconscious? Perspect Psychol Sci. 7(1):18–27.
- Leonard BE. 2014. Impact of inflammation on neurotransmitter changes in major depression: an insight into the action of antidepressants. Prog Neuropsychopharmacol Biol Psychiatry. 48:261–267.
- Li J, Meng H, Cao W, Qiu T. 2015. MiR-335 is involved in major depression disorder and antidepressant treatment through targeting GRM4. Neurosci Lett. 606:167–172.
- Li Y, Xu M, Gao Z, Wang Y, Yue Z, Zhang Y, Li X, Zhang C, Xie S, Wang P. 2013. Alterations of serum levels of BDNF-related miRNAs in patients with depression. PLoS One. 8(5):e63648–7.
- Li Q, Zhang B, Cao H, Liu W, Guo F, Shen F, Ye B, Liu H, Li Y, Liu Z. 2020. Oxytocin *Exerts Antidepressant-like effect by potentiating dopaminergic synaptic transmission in the mPFC. Neuropharmacology. 162:107836–107836.
- Lopez JP, Lim R, Cruceanu C, Crapper L, Fasano C, Labonte B, Maussion G, Yang JP, Yerko V, Vigneault E, et al. 2014. miR-1202 is a primate-specific and brain-enriched microRNA involved in major depression and antidepressant treatment. Nat Med. 20(7):764–768.,
- Lopez JP, Pereira F, Richard-Devantoy S, Berlim M, Chachamovich E, Fiori LM, Niola P, Turecki G, Jollant F. 2017. Co-variation of peripheral levels of miR-1202 and brain activity and connectivity during antidepressant treatment. Neuropsychopharmacology. 42(10):2043–2051.
- Lutz P, Kieffer BL. 2013. Opioid receptors: distinct roles in mood disorders. Trends Neurosci. 36(3):195–206.
- Maeda S, Ogishima H, Shimada H. 2019. Acute cortisol response to a psychosocial stressor is associated with heartbeat perception. Physiol Behav. 207:132–138.
- Maeng SH, Hong H. 2019. Inflammation as the potential basis in depression. Int Neurourol J. 23(Suppl 2):S63–S71.
- Maes M, Kubera M, Leunis J, Berk M. 2012. Increased IgA and IgM responses against gut commensals in chronic depression: further evidence for increased bacterial translocation or leaky gut. J Affect Disord. 141(1):55–62.
- Mao R, Zhang C, Chen J, Zhao G, Zhou R, Wang F, Xu J, Yang T, Su Y, Huang J, et al. 2018. Different levels of pro- and anti-inflammatory cytokines in patients with unipolar and bipolar depression. J Affect Disord. 237:65–72.
- McEwen B. 1999. Stress and hippocampal plasticity. Annu Rev Neurosci. 22:105–122.
- Millan MJ, Przewlock R, Jerlicz M, Gramsch C, Hollt V, Herz A. 1981. Stress-induced release of brain and pituitary β-endorphin: major role of endorphins in generation of hyperthermia, not analgesia. Brain Res. 208(2):325–338.
- Morris MC, Compas BE, Garber J. 2012. Relations among posttraumatic stress disorder, comorbid major depression, and HPA function: a systematic review and meta-analysis. Clin Psychol Rev. 32(4):301–315.
- Muller N. 2018. Inflammation in Schizophrenia: pathogenetic aspects and therapeutic considerations. Schizophr Bull. 4:973–982.
- National Research Council. 2012. Nutrient requirements of swine. 11th ed. Washington DC (WDC): USA National Academies Press.
- Pace TWW, Mletzko T, Alagbe O, Musselman DL, Nemeroff CB, Miller AH, Heim C. 2006. Increased stress-induced inflammatory responses in male patients with major depression and increased early life stress. Am J Psychiatry. 163(9):1630–1633.
- Pineda E, Shin D, Sankar R, Mazarati AM. 2010. Comorbidity between epilepsy and depression: experimental evidence for the involvement of serotonergic, glucocorticoid, and neuroinflammatory mechanisms. Epilepsia. 51:110–114.
- Rong H, Liu TB, Yang KJ, Yang HC, Wu DH, Liao CP, Hong F, Yang HZ, Wan F, Ye XY, et al. 2011. MicroRNA-134 plasma levels before and after treatment for bipolar mania. J Psychiatr Res. 45(1):92–95.
- Shen J, Li Y, Qu C, Xu L, Sun H, Zhang J. 2019. The enriched environment ameliorates chronic unpredictable mild stress-induced depressive-like behaviors and cognitive impairment by activating the SIRT1/miR-134 signaling pathway in hippocampus. J Affect Disord. 248:81–90.
- Siegle GJ, Granholm E, Ingram RE, Matt GE. 2001. Pupillary and reaction time measures of sustained processing of negative information in depression. Biol Psychiatry. 49(7):624–636.
- Simeonova D, Stoyanov D, Leunis JC, Carvalho AF, Kubera M, Murdjeva M, Maes M. 2020. Increased serum immunoglobulin responses to gut commensal Gram-negative bacteria in unipolar major depression and bipolar disorder type 1, especially when melancholia is present. Neurotox Res. 37(2):338–348.
- Singh B, Chaudhuri TK. 2014. Role of C-reactive protein in schizophrenia: an overview. Psychiatry Res. 216(2):277–285.
- Smalheiser NR, Lugli G, Rizavi HS, Torvik VI, Turecki G, Dwivedi Y. 2012. MicroRNA expression is down-regulated and reorganized in prefrontal cortex of depressed suicide subjects. PLoS One. 7(3):e33201–e33211.
- Smigielski L, Jagannath V, Rossler W, Walitza S, Grunblatt E. 2020. Epigenetic mechanisms in schizophrenia and other psychotic disorders: a systematic review of empirical human findings. *Mol Psychiatr. 25(8):1718–1748.
- Smith R, Cubis J, Brinsmead M, Lewin T, Singh B, Owens P, Chan E-C, Hall C, Adler R, Lovelock M, et al. 1990. Mood changes, obstetric experience and alterations in plasma cortisol, beta-endorphin and corticotrophin releasing hormone during pregnancy and the puerperium. J Psychosomat Res. 34(1):53–69.
- Sokolski KN, Nguyen BD, Demet EM. 2000. Decreases in dilated pupil size in depressed patients with age may reflect adrenergic changes. Psychiatry Res Neuroimaging. 94(3):267–272.
- Song M, Dong J, Wang Y, He J, Ju X, Zhang L, Zhang Y, Shi J, Lv Y. 2015. CSF miR-16 is decreased in major depression patients and its neutralization in rats induces depression-like behaviors via a serotonin transmitter system. J Affect Disord. 178:25–31.
- Sun X-y, Lu J, Zhang L, Song H-t, Zhao L, Fan H-m, Zhong A-f, Niu W, Guo Z-m, Dai Y-h, et al. 2015a. Aberrant microRNA expression in peripheral plasma and mononuclear cells as specific blood-based biomarkers in schizophrenia patients. J Clin Neurosci. 22(3):570–574.
- Sun X-y, Zhang J, Niu W, Guo W, Song H-t, Li H-y, Fan H-m, Zhao L, Zhong A-f, Dai Y-h, et al. 2015b. A preliminary analysis of microRNA as potential clinical biomarker for schizophrenia. Am J Med Genet. 168(3):170–178.
- Tannous J, Godlewska B, Tirumalaraju V, Soares JC, Cowen PJ, Selvaraj S. 2020. Stress, inflammation and hippocampal subfields in depression: a 7 Tesla MRI Study. Transl Psychiatr. 10:1–7.
- Tavakolizadeh J, Roshanaei K, Salmaninejad A, Yari R, Nahand JS, Sarkarizi HK, Mousavi SM, Salarinia R, Rahmati M, Mousavi SF, et al. 2018. MicroRNAs and exosomes in depression: potential diagnostic biomarkers. J Cell Biochem. 119(5):3783–3797.
- Wang Y, Liu Y, Xiong J, Di T, Yuan Z, Wu J, Chen L. 2019. Reduced serotonin impairs long-term depression in basolateral amygdala complex and causes anxiety-like behaviors in a mouse model of perimenopause. Exp Neurol. 321:1–14.
- Xiao W, Zhang X, Wang Z, Wang Y, Guo X, He L, Liang F, Hu H. 2017. Effect of acupuncture treatment on gene expression of neurotransmitters of brain tissue in rats with post-stroke depression. Chin Acupunct Moxibustion. 37:637.
- Xu Y, Xia Q, Xia Q, Zhang X, Liang J. 2019. MicroRNA-based biomarkers in the diagnosis and monitoring of therapeutic response in patients with depression. Neuropsychiatr Dis Treat. 15:3583–3597.
- Yin G, Guan L, Yu L, Huang D. 2019. A pilot study on differential expression of microRNAs in the ventromedial prefrontal cortex and serum of sows in activity restricted crates or activity free pens. Asian-Australas J Anim Sci. 32(9):1169–1447.
- Zhang M, Li X, Li J, Li J, Sun H, Zhang X, Bao J. 2017. Effects of confinement on physiological and psychological responses and expression of interleukin 6 and brain derived neurotrophic factor mRNA in primiparous and multiparous weaning sows. Asian-Australas J Anim Sci. 30(9):1350–1357.
- Zhang Y, Zhu X, Bai M, Zhang L, Xue L, Yi J. 2013. Maternal deprivation enhances behavioral vulnerability to stress associated with miR-504 expression in nucleus accumbens of rats. PLoS One. 8(7):e69934–e69938.
- Zhu X, Peng S, Zhang S, Zhang X. 2011. Stress-induced depressive behaviors are correlated with Par-4 and DRD2 expression in rat striatum. Behav Brain Res. 223(2):329–335.
- Zurawek D, Kusmider M, Faron-Gorecka A, Gruca P, Pabian P, Kolasa M, Solich J, Szafran-Pilch K, Papp M, Dziedzicka-Wasylewska M. 2016. Time-dependent miR-16 serum fluctuations together with reciprocal changes in the expression level of miR-16 in mesocortical circuit contribute to stress resilient phenotype in chronic mild stress – An animal model of depression. Eur Neuropsychopharmacol. 26(1):23–36.