
Abstract
Negative energy balance (NEB) is an important risk factor for the dairy cow’s anoestrus. The purpose of the experiment is to screen out differentially expressed proteins (DEPs) in the follicular fluid (FF) of cows with anoestrus caused by NEB and oestrus from positive energy balance (PEB). NEB and PEB holstein cows were selected 14–21 days postpartum according to the serum concentrations of β-hydroxybutyric acid (BHB) and glucose (Glu). Based on the follicle diameter at 55–60 days postpartum, the two groups were assigned into the anoestrus group (NEB-A; n = 6; follicular diameter < 8 mm) and oestrus group (PEB-E; n = 6; follicular diameter: 15–20 mm). Their FF was aspirated in vivo to screen out DEPs, and analysed by bioinformatics. Five DEPs were verified by western blotting (WB). The study identified 367 proteins. Compared with PEB-E, NEB-A expressed 135 downregulated DEPs and 37 upregulated DEPs. RBP4 (retinol-binding protein 4), adiponectin B, SOD (superoxide dismutase), IGF2 (insulin-like growth factor 2), and CRP (C-reactive protein) were verified by WB, their may have confirmed that cellular lipid metabolism, oxidative stress, and cellular immune function are related to follicular development and anoestrus.
367 proteins identified in the Follicle fluid of dairy cows 55–60 days postpartum.
In the Negative energy balance-anoestrus group, 172 differentially expressed proteins were identified—135 upregulated DEPs and 37 downregulated DEPs.
Confirmed that postpartum Negative energy balance may affect cows’ oestrus behaviour or performance during early lactation by lipid metabolism, the IGF regulation system, and immune and complement systems.
Highlights
Introduction
Follicular fluid (FF) is an important internal environment for the growth of cells in the follicle. FF components are mainly derived from blood circulation and granulocyte (GC) secretion (Fortune Citation1994). FF has hormones and cytokines related to oocyte maturation, and its constituents can affect oocyte maturation, follicular development (Carmen et al. Citation2002) and embryonic development (Satitmanwiwat et al. Citation2017). When dairy cows undergo negative energy balance (NEB) postpartum, the primary metabolic disorders that occur are increased levels of serum BHB and non-free fatty acid (NEFAs) and a decreased concentration of Glu (Fan et al. Citation2017). These serum metabolic changes may affect the composition of FF by penetrating the blood-follicle barrier (Walsh et al. Citation2011) thereby hindering the growth of cells within the follicle follicular development (Warzych and Lipinska Citation2020) and the postpartum oestrus cycle of cows (Santos et al. Citation2016). Some studies have shown that more severe NEB postpartum may delay the recovery of ovarian activity, prolong the first follicular wave, and reduce the ovulation rate (Butler and Smith Citation1989; Beam and Butler Citation1998; Butler Citation2003; Van Knegsel et al. Citation2005; Kawashima et al. Citation2012). The Aardema et al. (Citation2015) study found that cows within 42 days postpartum and with NEB may disturb the generation of dominant follicles and the time of first ovulation. Additionally, O'Doherty et al. (Citation2014) found that, after NEB occurred in cows postpartum, the maturation time of oocytes is longer than in cows without NEB. Macmillan et al. (Citation2020) found that excessive lipid metabolism during early lactation (especially increased NEFAs in the serum) affects the reproductive performance in dairy cows. Our previous research found that, after cows developed NEB postpartum 14–21 days, nearly 50% of them showed ovarian quiescence and 11 plasma protein changes during postpartum 60–90 days (Zhao C et al. Citation2019).To date, no report has investigated the protein changes in the FF of dairy cows with anoestrus caused by NEB. One study showed that, regarding anoestrus cows with NEB and oestrus cows with PEB, 94.4% of high-yielding dairy cows with NEB manifested anoestrus at 60–90 days postpartum (Xu et al. Citation2016).
Proteomics can analyse the overall protein expression in body fluids, cells or tissues. Protein is an important element in the function of cells. It can describe the changes in protein abundance in a cell or tissue caused by a certain disease, thereby reflecting the biological process of the body (Aslam et al. Citation2017). Proteomics has been widely used in studies of dairy cow related diseases. Maniwa et al. (Citation2005) used 2-D PAGE and MALDI-TOF MS to detect differentially expressed proteins in bovine ovarian follicular cysts and healthy cow FF. Joy et al. (Citation2015) used proteomics to detect the protein expression of buffalo FF with follicles of different sizes. Zachut et al. (Citation2016) identified 219 proteins in cow FF and showed 8 DEPs were associated with follicular development in the FF of less fertile cows and healthy dairy cows. In summary, proteomics has been successfully applied to studies of various reproductive disorders in dairy cows. However, the changes in FF protein composition and its function in cows with follicular dysplasia remain unclear. Therefore, in the present study, TMT/LC–MS/MS (TMT liquid chromatography mass spectrometry mass spectrometry) proteomics technology was used to identify the protein changes and potential significant proteins in the FF of cows with anoestrus caused by NEB and oestrus from PEB to provide a basis for the mechanism of anoestrus in dairy cows postpartum.
Materials and methods
Experimental animals
All methods and animals care were performed according to the relevant guidelines and regulations of the Institute of Animal Science, Chinese Academy of Agricultural Sciences. All the animals were managed according to the standards approved by the Ethics Committee for Animal Welfare and Research of Heilongjiang Bayi Agricultural University China (Number: 20200329-12). These animals were fed according to the Chinese dairy cattle feeding standards, and their dietary composition during early lactation included the following: the TMR of tested dairy cows complied with the Chinese Feeding Standard of Dairy Cows and comprised 55.60% dry matter (DM), 16% crude protein, 5.60% fat, 180 g calcium (Ca), 116 g phosphorus (P), 39.10% neutral detergent fibre, 20.30% acidic detergent fibre, and 1.75 mcal/DM lactation net energy.
The experimental samples collection and experimental process are shown in Figure . The experiment was conducted at an intensive cattle farm in Heilongjiang Province, China (124° 53′–125° 55′ east longitude, 46° 01′–47° 01′ north latitude), and dairy cows were randomly tracked after delivery (n = 60). The plasma of the test cows at 14–21 days postpartum was collected to detect the concentrations of Glu and BHB. According to the levels of BHB and Glu, all the test cows were divided into the positive energy balance group (NEB, n = 30) with BHB < 1.20 mmol/L and Glu between 3.0 mmol/L and 4.0 mmol/L and the negative energy balance group (PEB, n = 30) with BHB ≥ 1.20 mmol/L and Glu < 2.8 mmol/L (Fan et al. Citation2017). The two groups of cows tracked to 50–55 days postpartum were again assigned into two subgroups of anoestrus from NEB (NEB-A, n = 6) and oestrus from PEB (PEB-E, n = 6) using B ultrasound examination of follicle development every day, combined with clinical oestrus behaviour.
Figure 1. Schematic diagram of the study and proteomic workflow.
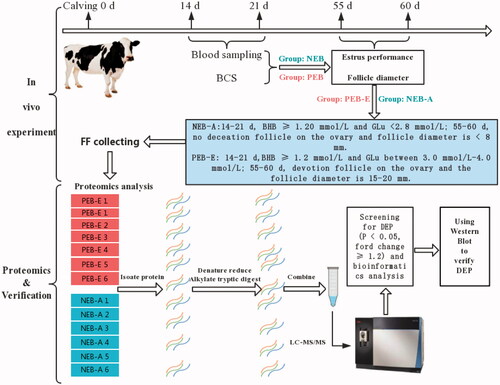
The selection criteria of the NEB-A group were as follows: Afimilk (Afimilk® 3.076, Israel, Agricultural Cooperative Ltd) software showed no significant fluctuations in cow activity from 55 to 60 days postpartum and no clinical oestrus performance. No deviation follicle was found on the ovary, and the follicle diameter was <8 mm. The selection criteria for the PEB-E group were as follows: Afimilk software showed fluctuations in cow activity from 55 to 60 days postpartum, and oestrus phenomena were observed such as crawling or wet and red swelling of the labia mucosa.
Sample collection
The serum samples of the tested cows were collected through the coccygeal vein before eating in the morning. Next, 10 mL of blood from each cow was centrifuged at 3000 × g/min for 10 min to obtain the supernatant, and again centrifuged at 12,000 × g/min for 10 min at 4 °C. The serum samples were collected and stored at −80 °C.
Follicle development of the test cows in the PEB-E and NEB-A groups was examined by B-ultrasound every day after 50 days postpartum. According to the selection criteria, the cows’ FF in the PEB-E group was collected 1 day before follicle ovulation, and the cows’ FF in the NEB-A group was collected 55–60 days after calving. According to the research method of Moallem et al. (Citation1999), the FF from the two groups was collected using a B-ultrasound instrument (SSD-500; Aloka, Japan) with a 5.0-MHz vaginal sector scanning probe and collection needle to adjust the negative pressure of the vacuum pump to 60–75 mm Hg according to the needs of the cow FF collection. The FF was centrifuged at 3000 × g for 15 min, and the supernatant was aspirated and stored at −80 °C.
Serum biochemical indicator analysis
The serum biochemical parameters NEFA (enzymatic method, mmol/L; kit number: 20192400159), BHB (enzymatic method, mmol/L; kit number: 20192400085), and Glu (glucose oxidase method, mmol/L; kit number: 20192400329) were measured using commercial kits (Nanjing Jiancheng Company, China). Statistical analysis was carried out using SPSS Statistics (SPSS, IBM, Armonk, NY, USA).
FF sample processing and quantification
A 200-µL aliquot of FF from each sample was added to 200 µL of 8 M urea (Bio-Rad, 161-0731, United States), lysate include protease inhibitor and protease inhibitor (10: 1), followed by sonication for 1 s, stopping for 2 s, and accumulation for 20 s, and centrifugation at 14,000×g for 20 min to collect the supernatant. The extracted protein concentration was determined by the Bradford (Citation1976) method. The experiment used human serum/plasma to remove high-abundance protein in FF using a commercial kit (122642-1KITCN, MERCK, USA). According to the instructions of the TMT® kit (PN: 90111; Thermo Fisher Scientific, Waltham, USA), the two groups of protein samples were hydrolysed into peptides and the samples were labelled. Briefly, 100 μg of the sample was used to remove high-abundance proteins, and then Dissolution Buffer (PN: 1861436) was used to prepare a final volume of 100 μL. Next, 5 μL of 200 mM Reducing Reagent (PN: 1861438) was added, followed by sample incubation at 55 °C for 1 h. Thereafter, 5 μL of 375 mM iodoacetamide solution (PN: 1861445) was added, followed by sample incubation at room temperature for 30 min in the dark. Furthermore, 200 μL of 100 mM Dissolution Buffer was added, followed by centrifugation at 12,000 g for 20 min, discarding of the bottom solution, and repetition 4 times. The sample volume was prepared to 100 μL with 100 mM Dissolution Buffer. Next, 2.5 μL of pancreatin was added per sample, followed by incubation at 37° C for 14 h. Thereafter, the sample was washed 3 times with ultrapure water, and the bottom of the tube was lyophilised and dissolved with 100 mM Dissolution Buffer. To the sample tube was added 0.8 mg/tube of TMT reagent + 41 μL of absolute ethanol, followed by shaking for 5 min. Next, 41 μL of TMT reagent was added to 100 μg (100 μL/sample) of the digested sample, followed by incubation at room temperature for 1 h. Finally, 8 μL of 5% Quenching Reagent (PN: 1861439) was added, followed by incubation for 15 min, vortexing and centrifugation.
LC-MS/MS mass spectrometry
Separation by reversed-phase chromatography at high pH
Mobile phase A (98% dd H2O + 2% acetonitrile solution) (Merck, article number: 100030, Germany, pH = 10) and mobile phase B (98% acetonitrile + 2% dd H2O solution; pH = 10) were prepared. The Durashell-C18, 4.6 mm × 250 mm, 5 μm, 100 A column (Agela, DC952505-0, USA) was used for the experiment. The sample was dissolved in 100 µl of mobile phase A and was centrifuged at 14,000 g for 20 min, and then the supernatant was collected for use. Next, 400 μg of enzymatically digested foetal bovine serum (BSA) was used for separation (column temperature, 45 °C; detection wavelength, 214 nm), and 100 μL was removed for loading. The flow rate was 0.7 mL/min, and the separation gradient was as follows: 0 min, 5% mobile phase B; 5 min, 8% mobile phase B; 35 min, 18% mobile phase B; 62 min, 32% mobile phase B; 64 min, 95% mobile phase B; 68 min 95% mobile phase B; 72 min, 5% mobile phase B.
Nanoscale reversed-phase chromatography Q exactive HF-X for protein analysis
Mobile phase A (100% ultrapure water + 0.1% formic acid solution; Sigma-Aldrich, article number: 56302, United States) and mobile phase B (100% acetonitrile + 0.1% formic acid solution) were prepared. The test uses the Acclaim PepMap100 column (2 cm × 100 µm), C18 precolumn (5 µm), EASY-Spray column (12 cm × 75 µm), and C18 (3 µm) chromatographic column. The sample obtained by reversed-phase separation at high pH was reconstituted with 20 µL of 2% methanol (Sigma-Aldrich, Catalog No. 14262, USA) + 0.1% formic acid solution. The sample was centrifuged at 12,000 g for 10 min, and the supernatant was aspirated. The loading volume was 10 µL, and the sandwich method was used for loading. The loading pump flow rate was 350 nL/min for 15 min. The separation flow rate was 600 nL/min, and the separation gradient was as follows: 0 min, 0% mobile phase B; 10 min, 6% mobile phase B; 15 min, 10% mobile phase B; 20 min, 0% mobile phase B; 70 min, 30% mobile phase B; 80 min, 40% mobile phase B; 80.1–85 min, 95% mobile phase B; 85.1–88 min, 6% mobile phase B.
Bioinformatics analysis
According to the literature (Santos et al. Citation2016), the quantitative value of each sample in the results of Maxquant search is directly extracted. After the median value is normalised, it is further normalised by perseus. The paired t-test was used for differential analysis, and the differential proteins (DEPs) were selected with a p value <.05 and fold change ≥1.2. In the experiment, COG (Clusters of Orthologous Groups) analysis was realised by Blast to the kyva sequence. The annotations of GO (Gene Ontology) and KEGG (Kyoto Encyclopaedia of Genes and Genomes, http://www.genome.jp/kegg) are performed using BOPRO annotation data of Uniprot. In the experiment, PPI (protein–protein interaction network) was analysed using BOVIN data in the String database. The functional enrichment analysis uses the overrepresentation analysis method based on the functional category annotations of GO and GO Slim and calculates the p value of the DEP’s significant enrichment degree on the GO functional category or KEGG pathway, and based on multiple hypotheses. The corrected FDR correction value and enrichment value is calculated by − log (p value). The smaller is the p value or FDR value, the higher is the enrichment value.
DEP verification
The two groups of extracted FF proteins were mixed into one sample for every two samples and were subjected to SDS-PAGE, add 25 uL FF protein to each well. Next, the proteins were transferred to nitrocellulose membranes according to conventional western blotting procedures. Block and incubate different antibodies using conventional Western Blot methods (Bradford Citation1976). All antibodies were diluted with 1:200 times. The primary antibodies were as follows: GAPDH (glyceraldehyde-3-phosphate dehydrogenase; AP0066, Bioworld), RBP4 (retinol-binding protein 4; ab233138, Abcam), adiponectin B (Adipo B; ab231088, Abcam), SOD (superoxide dismutase; ab13498, Abcam), IGF2 (insulin-like growth factor 2; ab9574, Abcam), and CRP (C-reactive protein; ab231022, Abcam). The secondary antibody was Anti-Rabbit, HRP (Abcam). The results were analysed using ImageJ software (NIH, Bethesda, MD). Additionally, SPSS Statistics (SPSS, IBM, Armonk, NY, USA) was used for independent sample t test analysis.
Results
Background information and serum biochemical indicators
Table shows the background information (parity, age, milk production, dry matter intake and DMI) and serum energy index (BHB, Glu, and NEFA) in the two groups of dairy cows at 14–21 days and 55–60 days postpartum. In the NEB-A, the BCS, body condition loss, serum BHB and NEFA levels were significantly higher than those in the PEB-E group (p < .01), and average daily milk production and serum Glu levels were significantly lower than those in PEB-E cows (p < .01). No significant difference was found in age, parity, and 50–55 days BCS between the two groups of cows (p > .05).
Table 1. Dairy cow background information and serum biochemical indicators.
Screening and identification of differential proteins
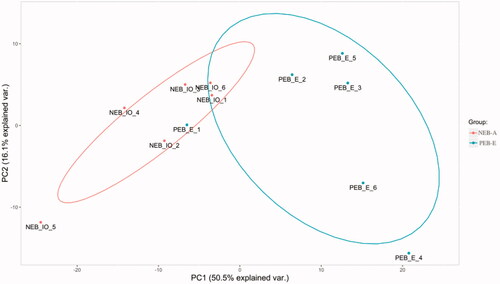
PCA (principal component analysis) shows the size of the difference between two similar sets of data through differences in their spatial distribution (Figure ). A difference was found between the FF samples of NEB-A and PEB-E (Figure ).
Figure 2. Principal component analysis. The abscissa is the PC1 (Principal Component Analysis 1) result, and the ordinate is the 553 PC2 (Principal Component Analysis 2) result. Red represents the NEB-A group, and blue represents the PEB-E group. A difference was found between the FF (Follicular fluid) samples of NEB-A and PEB-E.
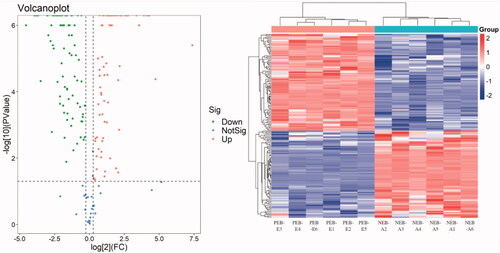
According to the Uniprot BOVIN database, 3,414 peptides and 679 proteins were identified in the protein qualitative results, which revealed 172 DEPs. Compared with the PEB-E group, the DEPs in the FF of NEB-A comprised 135 downregulated proteins and 37 upregulated proteins. The specific information concerning DEPs are shown in Supplementary Schedule S1. In general, the downregulated DEPs in lipid and cholesterol metabolism included RBP4, apolipoprotein F (APOF), apolipoprotein M (APOM), phospholipid transfer protein (PLTP), adipocyte plasma membrane-associated protein (APMAP) and AdipoB, and the upregulated DEPs comprised serglycin and 17β-HSD (17β-hydroxysteroid dehydrogenase). The downregulated DEPs in insulin regulation were IGFBP3 (insulin-like factor binding protein 3), IGFALS (insulin-like factor binding protein), IGF2, IGFBP2, IGFBP4 and IGFBP7, and the downregulated DEPs in oxidative stress were copper zinc (SOD3), heat shock protein β-1 (HSPB1), and paraoxonase 1 (PON1). The DEP volcano map and cluster map between the two groups are shown in Figure .
Figure 3. Differentially expressed protein (DEP) volcano map and cluster map. The abscissa is the fold change of the DEP difference between the two groups, and the ordinate is the p value in protein expression. Green represents a downregulated protein, red represents an upregulated protein, and blue represents a protein with no difference.
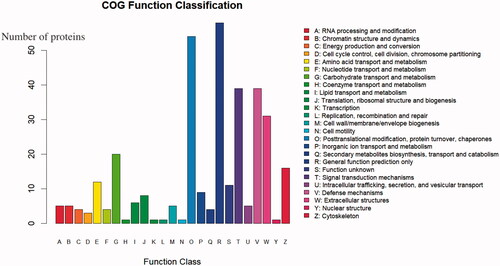
COG (Clusters of Orthologous Groups) analysis is based on the homologous classification of gene products based on the COG database. Figure shows the COG analysis results of all the identified proteins. The highest protein functional classifications were R (general function prediction only) with 58 proteins, O (posttranslational modification, protein turnover, chaperones) with 54 proteins, and T (signal transduction mechanisms) and V (defense mechanisms) each with 39 proteins.
Figure 4. Statistics of Clusters of Orthologous Groups (COG) function classification. The abscissa shows the COG function classification, and the ordinate shows the number of proteins by functional classification.
Functional classifications of DEP
GO analysis includes CC (cellular component)—referring to each part of the cell and the extracellular environment; MF (molecular function)—referring to molecular-level activity, such as catalytic or binding activity; and BP (biological process)—referring to a series of events generated by the orderly combination of one or more molecular functions. The GO analysis results of DEPs in the test FF are shown in Figure . The highest MF enrichment of DEPs was metal ion binding and ATP binding, the highest enrichment of CC was the extracellular region, and the functions of higher BP enrichment were cell adhesion, positive regulation of ERK1 and ERK2 cascade, and positive regulation of apoptotic process.
Figure 5. GO (Gene Ontology) analysis of DEPs (differentially expressed proteins) . Green represents biological process, red represents cellular process, and blue represents molecular process. The highest MF enrichment of DEPs is metal ion binding and ATP binding, the highest enrichment of CC (cellular component) is the extracellular region, and the functions of higher BP (biological process) enrichment are cell adhesion, positive regulation of ERK1 and ERK2 cascade, and positive regulation of apoptotic process.
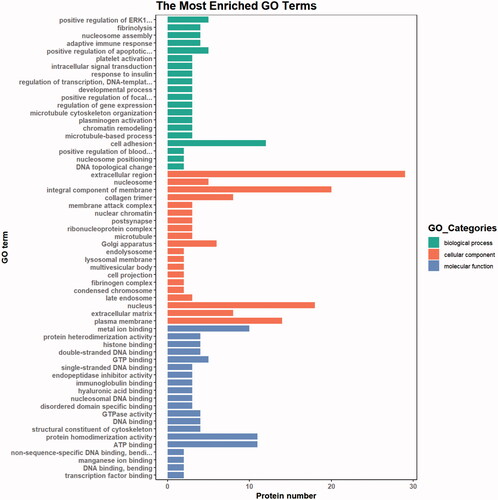
Figure shows the DEP enrichment pathways. The pathways with higher enrichment were systemic lupus erythematosus, complement and coagulation cascades, MAPK signalling pathway, inflammatory response pathway including systemic lupus erythematosus, phagosome, Th17 cell differentiation, P13K-AKT pathway, and cell cycle pathway.
Figure 6. KEGG pathway enrichment. The ordinate represents the name of the enrichment pathway, and the abscissa is the ratio. The larger is the circle, the more the protein is enriched, and different colours represent different p values.
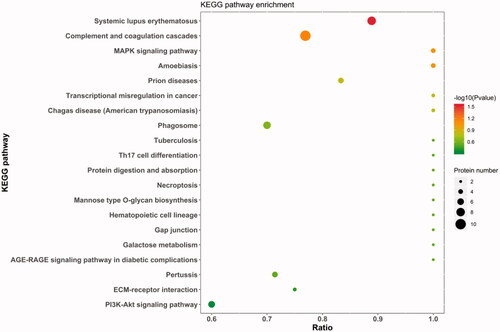
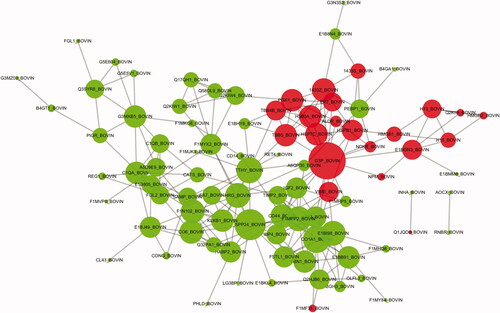
Figure shows the differential protein network interactions (PPI). In total, 101 DEPs were correlated with each other. Among them, the secreted phosphoprotein 24 was associated with 13 DEPs, accounting for 5.9%, and histidine-rich glycoprotein was associated with 10 DEPs, accounting for 4.5%.
Figure 7. PPI (protein-protein interaction network) network interaction map of DEPs(differentially expressed proteins). Red represents upregulated proteins, and green represents downregulated proteins. Each dot represents a DEP. The figure shows the IDs of the DEPs. Details are available in Schedule 1, and the protein details are found in Supplementary Schedule 1 according to the ID.
DEP verification
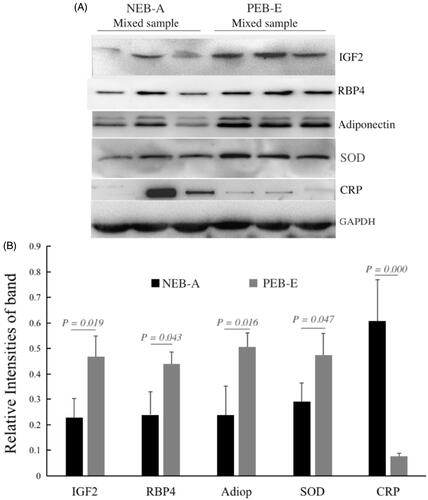
Figure shows that five DEPs in the two groups of cows were verified by WB, followed by greyscale analysis and independent sample t test. Significant differences were found in the five DEPs between NEB-A and PEB-E (p < .05), a finding that is consistent with the proteomics results. Compared with the PEB-E group, IGF2 (p = .019), RBP4 (p = .043), Adipo (p = .016), and SOD (p = .047) expression was significantly downregulated, and CRP (p = .000) expression was significantly increased.
Figure 8. DEP western blotting verification results. Internal reference protein: GAPDH (glyceraldehyde-3-phosphate dehydrogenase); verification proteins: RBP4 (retinol-binding protein 4), adiponectin B (Adipo B), SOD (superoxide dismutase), IGF2 (insulin-like growth factor 2), CRP (C-reactive protein). A is the WB result: NEB-A Mixed sample represents the protein mixed sample of the NEB-A group FF in the proteomics test (n = 3), and PEB-E Mixed sample represents the FF of the PEB-E group in the proteomics test of protein mixed samples (n = 3); each group is loaded with 20 µg of protein. B shows the results of greyscale analysis: the Western Blot results of the five validated proteins were consistent with the proteomics results.
Discussion
The postpartum lactation peak in high-yielding dairy cows is earlier than that of feed intake, generally making cows undergo NEB 2–3 weeks postpartum (Mulligan and O'Grady Citation2006). The main serum pathological changes of postpartum cows with NEB are a lower concentration of Glu and higher concentrations of NEFA and BHB (Coppock Citation1985). NEB affects the reproductive performance of cows during early lactation (Wathes et al. Citation2007). Dairy cows undergoing NEB postpartum do not show natural oestrus behaviours 50–60 days postpartum, and no deviation follicle is chosen for ovulation, the underlying reason is complex, and the impact is unclear. One investigation found that 94.4% of high-yielding dairy cows with NEB manifested anoestrus at 60–90 days postpartum. Therefore, in our experiment, high-yielding dairy cows with a daily milk production of 35–41 kg/day were selected as experimental animals, and serum was collected to detect energy metabolism indexes (BHB, NEFA, Glu) at 14–21 days and 55–60 days postpartum. The oestrous performance and follicle diameter were observed at 50–60 days postpartum. The anoestrus cows with NEB were selected on 14–21 days and 55–60 days as the experimental group and oestrus cows without NEB postpartum were selected as the control group. Furthermore, TMT/LC–MS/MS was used to identify 367 proteins in the FF between the two groups of dairy cows with NEB-A and PEB-E at 55–60 days postpartum. Maya Zachut identified 219 proteins in the preovulatory FF and needed to further explore the specific protein components in the FF of dairy cows. In our experiment, 172 DEPs in the FF of dairy cows in NEB-A were screened to obtain 135 downregulated proteins and 37 upregulated proteins according to the differential protein screening criteria (p < .05, fold change (FC) ≥ 1.2).
After NEB occurs in dairy cows, lipid mobilisation increases to release fatty acids to meet the energy demand of lactation, and the ketone body also increases (Weber et al. Citation2013). In addition to the lipid metabolism in NEB cows postpartum affecting the protein composition in FF5, our proteomics research found that NEB may change the protein composition in the FF of dairy cows at 55–60 days postpartum. The energy sources of cells in follicles are mainly glucose metabolism and fatty acid oxidation. A large amount of fatty acids caused by NEB enter the FF through the blood circulation. The fatty acids in the FF are generally stored in the form of triacylglycerol in lipid droplets. However, a large amount of fatty acids entering the FF may affect oocyte development due to lipotoxicity and inhibit the maturation of oocytes in the follicle[5]. In our study, the serglycin content was increased (FC = 2.626) in the FF of the cows in the NEB-A group, an activity that is closely related to the disorder of fatty acid metabolism. At the same time, the expression of 17β-HSD was upregulated (FC = 2.259); 17β-HSD is a type of NAD(P)H/NAD(P)+-dependent oxidoreductase (Puranen et al. Citation1999), whose regulation of steroid hormones in cells plays an important role in the reproductive system. However, recent studies have found that 17β-HSD can participate in cell fatty acid (Audet-Walsh et al. Citation2012) and cholesterol metabolism (Rantakari et al. Citation2010), and fatty acid metabolism in FF affects the secretion of steroid hormones in cumulus cells. Therefore, we speculate that the disorder of fatty acid metabolism in the follicles of NEB-A cows affects the synthesis of sex hormones, however, further research is needed to confirm this finding.
In this study, other DEPs in lipid metabolism were downregulated, such as RBP4, apolipoprotein F (APOF), apolipoprotein M (APOM), phospholipid transfer protein (PLTP), adipocyte plasma membrane-associated protein (APMAP) and apolipoprotein (Apo). First, RBP4 is an apolipoprotein that is synthesised and transported by the liver (Tamor et al. Citation2006). Yang et al. (Citation2005) first reported that RBP4 is an adipokine that plays a role in the pathogenesis of human insulin resistance, type 2 diabetes and polycystic ovary syndrome (PCOS). Women with PCOS have significantly higher levels of RBP4 in the serum that is related to increased follicle-stimulating hormone (FSH) and luteinizing hormone (LH) or sex hormones (Weiping et al. Citation2006). For the first time, our study confirmed that RBP4 was decreased in the FF of NEB-A cows. Further study is warrant regarding how RBP4 plays a role in follicular development and the anoestrus of dairy cows with insulin resistance and lipid disorder postpartum. Second, in humans, apolipoprotein in FF is associated with the maturation of oocytes in follicles and luteinization of granulosa cells. Apo B is associated with oocyte maturation, and a positive correlation exists between oocyte fertilisation and embryo quality (Scalici et al. Citation2016). Apolipoprotein CII (Apo CII) declines, while Apo E (Apo E) increases, with age (Von Wald et al. Citation2010). In our study, APOF and APOM were downregulated in the FF of NEB-A cows. Apolipoprotein M (Apo M) is involved in glucose metabolism and enhances insulin sensitivity (Yao et al. Citation2020). Thus, insulin should play an important role in the Apo components of FF from cows with anoestrus. Third, another fat-regulating protein, adiponectin, is closely related to the follicular development in dairy cows (Tabandeh et al. Citation2010). The increase in adiponectin is positively correlated with the regression of the ovarian corpus luteum and E2 level in the FF of cows (Tan et al. Citation2006). In proteomics studies, adiponectin was significantly downregulated in the FF of NEB-A cows, a finding that was also verified by western blotting. Therefore, lipid-related proteins in the FF of cows can play an important role in the late follicular development of anoestrus cows caused by NEB postpartum.
Additionally, insulin-like growth factor (IGF) system is one of the main enrichment pathways of DEPs in the FF of NEB-A cows. The IGF system is an important regulator of follicular development (Spicer and Echternkamp Citation1995), cell differentiation (Brogan et al. Citation2010), steroid production, and oocyte maturation (Sanchez et al. Citation2014) and comprises two ligands (IGF1 and IGF2) (Giudice Citation1993), specific receptors (IGFR1 and IGFR2), and seven IGF-binding proteins (IGFBP1 to 7). IGF is involved in proliferation and follicular development, while IGFBP is responsible for the average lifespan of these ligands and their transport. Rebouças et al. (Citation2014) detected IGF in bovine follicles with diameters of 0.2, 0.5 and 1.0 mm and found that the expression levels of IGF1R and IGF2R in 0.5 mm follicles were higher than those in 1.0 or 0.2 mm follicles. Furthermore, the mRNA expression levels of IGF were different in follicles of different sizes. In our proteomics research, IGFBP3, IGFALS, IGF2, IGFBP2, IGFBP4, and IGFBP7 showed a downward trend in NEB-A cows. The expression of IGF receptors in bovine follicle granulosa cells and follicular membrane cells increases at the final stage of follicular development and decreases when atresia occurs (Armstrong et al. Citation2000).
Our study found that immune-related factors may participate in cows’ anoestrus postpartum because polymerised immunoglobulin receptor (PIGR), interleukin 1 receptor (IL1RAP), and lymphocyte cytoplasmic protein 1 (LCP1) were significantly decreased and C-reactive protein (CRP) was increased. NEB occurs in cows after delivery and may inhibit the immune function (Ingvartsen and Moyes Citation2013). Therefore, the follicle development of anoestrus cows postpartum is closely related to the decline in immune function and increase in inflammation reactions due to NEB postpartum.
The oxidative stress caused by postpartum NEB affects the follicular development of dairy cows (Pedernera et al. Citation2010). Proteomics results showed that oxidative stress-related proteins such as SOD3, HSPB1, and PON1 in the FF of cows were downregulated in the NEB-A group. PON1 is not only an indicator of oxidative stress but also an acute inflammatory response protein. However, a negative correlation exists between serum E2 and PON1 activity. The PON1 activity in the FF of healthy large follicles is higher than that of atresia follicles (Schneider et al. Citation2013). Therefore, the relationship between PON1 activity in FF and follicular development warrants further study.
Ferrazza et al. (Citation2017) used proteomics to study the predeviation, deviation, and postdeviation stages of follicular development in dairy cows, and found that the coagulation system and complement system participate in the follicular development process, which is consistent with the results of this study, through KEGG analysis, DEP enrichment was found to be higher in the complement and coagulation cascades (FDR = 3.727). Previous reports have indicated that the complement system is a complex enzyme cascade reaction system with more than 30 proteins (Lubbers et al. Citation2017) that inhibits lipolysis and promotes the absorption of glucose and free fatty acids (Phieler et al. Citation2013). In the NEB-A group, the abundance of complement-related proteins was decreased, presumably inseparable from the metabolism of fatty acids and glucose in FF. The second DEP enrichment was PI3K-AKT (FDR = 2.610) in addition to complement and coagulation cascades. The PI3K-AKT signalling pathway is an important signalling pathway involved in follicular development (Gonzalez-Robayna et al. Citation2000) and ovulation (Chen et al. Citation2007), playing a vital role in regulating steroid hormone synthesis, oocyte growth, follicular cell apoptosis and survival. Moreover, a high fatty acid content can regulate islet β cells through the PI3K-Akt pathway (Krusaynska et al.2002). Our study confirmed that changes in the fat metabolism of the cows with NEB at 14–21 days postpartum affected the follicular development at 50–60 days postpartum by FF, providing related proteins and enrichment pathways to explore the impact of NEB on the follicular development of dairy cows in the future.
Conclusions
Our study identified 367 proteins in the FF of dairy cows 55–60 days postpartum, enriching the understanding of the protein profiles in the FF of dairy cows. In the NEB-A group, 172 DEPs were identified 135 upregulated DEPs and 37 downregulated DEPs. Furthermore, IGF2, RBP4, Adipo, SOD, and CRP were verified by western blotting, consistent with the proteomics results, confirming that postpartum NEB may affect cows’ oestrus behaviour or performance during early lactation by lipid metabolism, the IGF regulation system, and immune and complement systems.
We conducted a proteomic study on the follicular fluid of two groups of cows, NEB-A and PEB-E, to clarify the effect of NEB on cows’ postpartum oestrus. Next, we will refine and increase the grouping of experimental cows for more in-depth research.
Supplemental Material
Download MS Word (163 KB)Acknowledgments
The authors thank ACS Authoring Services for editing this manuscript.
Disclosure statement
All authors declare that No conflict of interest exists.
Additional information
Funding
References
- Aardema H, Gadella BM, van de Lest CHA, Brouwers JFHM, Stout TAE, Roelen BAJ, Vos PLAM. 2015. Free fatty acid levels in fluid of dominant follicles at the preferred insemination time in dairy cows are not affected by early postpartum fatty acid stress. J Dairy Sci. 98:2322–2336.
- Armstrong DG, Gutierrez CG, Baxter G, Glazyrin AL, Mann GE, Woad KJ, Hogg CO, Webb R. 2000. Expression of mRNA encoding IGF-I, IGF-II and type 1 IGF receptor in bovine ovarian follicles. J Endocrinol. 165:101–113.
- Aslam B, Basit M, Nisar MA, Khurshid M, Rasool MH. 2017. Proteomics: technologies and their applications. J Chromatogr Sci. 55:182–196.
- Audet-Walsh É, Bellemare J, Lacombe L, Fradet Y, Fradet V, Douville P, Guillemette C, Lévesque É. 2012. The impact of germline genetic variations in hydroxysteroid (17-beta) dehydrogenases on prostate cancer outcomes. Eur Urol. 62:88–96.
- Beam SW, Butler WR. 1998. Energy balance, metabolic hormones, and early postpartum follicular development in dairy cows fed prilled lipid. J Dairy Sci. 81:121–131.
- Bradford MM. 1976. A rapid and sensitive method for the quantitation of microgram quantities of protein utilizing the principle of protein-dye binding. Anal Biochem. 72:248–254.
- Brogan RS, Mix S, Puttabyatappa M, VandeVoort CA, Chaffin CL. 2010. Expression of the insulin-like growth factor and insulin systems in the luteinizing macaque ovarian follicle. Fertil Steril. 93:1421–1429.
- Butler WR. 2003. Energy balance relationships with follicular development, ovulation and fertility in postpartum dairy cows. Livest Prod Sci. 83:211–218.
- Butler WR, Smith RD. 1989. Interrelationships between energy balance and postpartum reproductive function in dairy cattle. J Dairy Sci. 72:767–783.
- Carmen M, Estrella RR, Esperanza O, Ermanno G, Jan T. 2002. Follicular fluid markers of oocyte developmental potential. Hum Reprod. 17:1017–1022.
- Chen YJ, Hsiao PW, Lee MT, Mason JI, Ke FC, Hwang JJ. 2007. Interplay of PI3K and cAMP/PKA signaling, and rapamycin-hypersensitivity in TGFbeta1 enhancement of FSH-stimulated steroidogenesis in rat ovarian granulosa cells. J Endocrinol. 192:405–419.
- Coppock CE. 1985. Energy nutrition and metabolism of the lactating dairy cow. J Dairy Sci. 68:3403–3410.
- Fan Z, Shu S, Xu C, Li C, Xiao X, Xia C, Wang G, Zhang H, Xu C, Yang W, et al. 2017. Investigation of negative energy balance and postpartum anoestrus in an intensive dairy farm from the Chinese province of Heilongjiang. Acta Vet Brno. 86:59–65.
- Ferrazza R. d A, Garcia HDM, Schmidt E. M d S, Mihm Carmichael M, Souza F. F d, Burchmore R, Sartori R, Eckersall PD, Ferreira JCP. 2017. Quantitative proteomic profiling of bovine follicular fluid during follicle development. Biol Reprod. 97:835–849.
- Fortune JE. 1994. Ovarian follicular growth and development in mammals. Biol Reprod. 50:225–232.
- Giudice CL. 1993. Insulin-like growth factors and ovarian follicular development. Endocr Rev. 13:641–669.
- Gonzalez-Robayna IJ, Falender AE, Ochsner S, Firestone GL, Richards JS. 2000. Follicle-stimulating hormone (FSH) stimulates phosphorylation and activation of protein kinase B (PKB/Akt) and serum and glucocorticoid-lnduced kinase (Sgk): evidence for A kinase-independent signaling by FSH in granulosa cells. Mol Endocrinol. 14:1283–1300.
- Ingvartsen KL, Moyes K. 2013. Nutrition immune function and health of dairy cattle. Animal. 7:112–122.
- Joy S, Deshmukh BT, Dhaware SD, Borkar SD. 2015. Follicular fluid protein profile in buffalo. VSRJ. 6:71–79.
- Kawashima C, Matsui M, Shimizu T, Kida K, Miyamoto A. 2012. Miyamoto: nutritional factors that regulate ovulation of the dominant follicle during the first follicular wave postpartum in high-producing dairy cows. J Reprod Dev. 58:10–16.
- Lubbers R, van Essen MF, van Kooten C, Trouw LA. 2017. Production of complement components by cells of the immune system. Clin Exp Immunol. 188:183–194.
- Macmillan K, Gobikrushanth M, Helguera IL, Behrouzi A, Colazo MG. 2020. Relationships between early postpartum nutritional and metabolic profiles and subsequent reproductive performance of lactating dairy cows. Theriogenology. 151:52–57.
- Maniwa J, Izumi S, Isobe N, Terada T. 2005. Studies on substantially increased proteins in follicular fluid of bovine ovarian follicular cysts using 2-D PAGE and MALDI-TOF MS. Reprod Biol Endocrinol. 3:23.
- Moallem U, Folman Y, Bor A, Ara A, Sklan D. 1999. Effect of calcium soaps of fatty acids and administration of somatotropin on milk production, prevulatory follicular development, and plasma and follicular fluid lipid composition in high yielding dairy cow. J Dairy Sci. 82(11):2358–2368.
- Mulligan F, O'Grady LR. 2006. Production diseases of the transition cow: body condition score and energy balance. Irish Vet J. 59:505.
- O'Doherty AM, O'Gorman A, Al Naib A, Brennan L, Daly E, Duffy P, Fair T. 2014. Fair: negative energy balance affects imprint stability in oocytes recovered from postpartum dairy cows. Genomics. 104:177–185.
- Pedernera M, Celi P, García SC, Salvin HE, Barchia I, Fulkerson WJ. 2010. Effect of diet, energy balance and milk production on oxidative stress in early-lactating dairy cows grazing pasture. Vet J. 186:352–357.
- Phieler J, Garcia-Martin R, Lambris JD, Chavakis T. 2013. The role of the complement system in metabolic organs and metabolic diseases. Semin Immunol. 25:47–53.
- Puranen TJ, Kurkela RM, Lakkakorpi JT, Poutanen MH, Itäranta PV, Melis JP, Ghosh D, Vihko RK, Vihko PT. 1999. Characterization of molecular and catalytic properties of intact and truncated human 17beta-hydroxysteroid dehydrogenase type 2 enzymes: intracellular localization of the wild-type enzyme in the endoplasmic reticulum. Endocrinology. 140:3334–3341.
- Rantakari P, Lagerbohm H, Kaimainen M, Suomela JP, Strauss L, Sainio K, Pakarinen P, Poutanen M. 2010. Hydroxysteroid (17{beta}) dehydrogenase 12 is essential for mouse organogenesis and embryonic survival. Endocrinology. 151:1893–1901.
- Rebouças EL, Costa JJN, Passos MJ, Silva AWB, Rossi RODS, van den Hurk R, Silva JRV. 2014. Expression levels of mRNA for insulin-like growth factors 1 and 2, IGF receptors and IGF binding proteins in in vivo and in vitro grown bovine follicles. Zygote. 22:521–532.
- Sanchez R, Schuermann Y, Gagnon-Duval L, Baldassarre H, Murphy BD, Gevry N, Agellon LB, Bordignon V, Duggavathi R. 2014. Differential abundance of IGF1, bile acids, and the genes involved in their signaling in the dominant follicle microenvironment of lactating cows and nulliparous heifers. Theriogenology. 81:771–779.
- Santos JEP, Bisinotto RS, Ribeiro ES. 2016. Mechanisms underlying reduced fertility in anovular dairy cows. Theriogenology. 86:254–262.
- Satitmanwiwat S, Changsangfah C, Faisaikarm T, Promthep K, Thammawung S, Saikhun K, Kaeoket K. 2017. Proteome profiling of bovine follicular fluid-specific proteins and their effect on in vitro embryo development. J Vet Med Sci. 79:842–847.
- Scalici E, Bechoua S, Astruc K, Duvillard L, Gautier T, Drouineaud V, Jimenez C, Hamamah S. 2016. Apolipoprotein B is regulated by gonadotropins and constitutes a predictive biomarker of IVF outcomes. Reprod Biol Endocrinol. 14:28.
- Schneider A, Absalon-Medina VA, Esposito G, Corrêa MN, Butler WR. 2013. Paraoxonase (PON) 1, 2 and 3 expression in granulosa cells and PON1 activity in follicular fluid of dairy cows. Reprod Dom Anim. 48:989–994.
- Spicer LJ, Echternkamp SE. 1995. The ovarian insulin and insulin-like growth factor system with an emphasis on domestic animals. Domest Anim Endocrinol. 12:223–245.
- Tabandeh MR, Hosseini A, Saeb M, Kafi M, Saeb S. 2010. Changes in the gene expression of adiponectin and adiponectin receptors (AdipoR1 and AdipoR2) in ovarian follicular cells of dairy cow at different stages of development. Theriogenology. 73:659–669.
- Tamor Y, Sakaue H, Kasuga M. 2006. RBP4, an unexpected adipokine. Nat Med. 12:30–31.
- Tan BK, Chen J, Digby JE, Keay SD, Kennedy CR, Randeva HS. 2006. Upregulation of adiponectin receptor 1 and 2 mRNA and protein in adipose tissue and adipocytes in insulin-resistant women with polycystic ovary syndrome. Diabetologia. 49:2723–2728.
- van Knegsel ATM, van den Brand H, Dijkstra J, Tamminga S, Kemp B. 2005. Effect of dietary energy source on energy balance, production, metabolic disorders and reproduction in lactating dairy cattle. Reprod Nutr Dev. 45:665–688.
- Von Wald T, Monisova Y, Hacker MR, Yoo SW, Penzias AS, Reindollar RR, Usheva A. 2010. Age-related variations in follicular apolipoproteins may influence human oocyte maturation and fertility potential. Fertil Steril. 93:2354–2361.
- Walsh SW, Williams EJ, Evans ACO. 2011. A review of the causes of poor fertility in high milk producing dairy cows. Anim Reprod Sci. 123:127–138.
- Warzych E, Lipinska P. 2020. Energy metabolism of follicular environment during oocyte growth and maturation. J Reprod Dev. 66:1–7.
- Wathes DC, Fenwick M, Cheng Z, Bourne N, Llewellyn S, Morris DG, Kenny D, Murphy J, Fitzpatrick R. 2007. Influence of negative energy balance on cyclicity and fertility in the high producing dairy cow. Theriogenology. 68:S232–S241.
- Weber C, Hametner C, Tuchscherer A, Losand B, Kanitz E, Otten W, Singh SP, Bruckmaier RM, Becker F, Kanitz W, et al. 2013. Variation in fat mobilization during early lactation differently affects feed intake, body condition, and lipid and glucose metabolism in high-yielding dairy cows. J Dairy Sci. 96:165–180.
- Weiping L, Qingfeng C, Shikun M, Xiurong L, Hua Q, Xiaoshu B, Suhua Z, Qifu L. 2006. Elevated serum RBP4 is associated with insulin resistance in women with polycystic ovary syndrome. Endocrine. 30:283–287.
- Xu C, Xia C, Sun Y, Xiao X, Wang G, Fan Z, Shu S, Zhang H, Xu C, Yang W, et al. 2016. Metabolic profiles using (1)H-nuclear magnetic resonance spectroscopy in postpartum dairy cows with ovarian inactivity. Teriogenology. 86:1475–1481.
- Yang Q, Graham TE, Mody N, Preitner F, Peroni OD, Zabolotny JM, Kotani K, Quadro L, Kahn BB. 2005. Serum retinol binding protein 4 contributes to insulin resistance in obesity and type 2 diabetes. Nature. 436:356–362.
- Yao S, Zhang J, Zhan Y, Shi Y, Yu Y, Zheng L, Xu N, Luo G. 2020. Insulin resistance in apolipoprotein M knockout mice is mediated by the protein kinase Akt signaling pathway. Endocr Metab Immune. 20:771–780.
- Zachut M, Sood P, Levin Y, Moallem U. 2016. Proteomic analysis of preovulatory follicular fluid reveals differentially abundant proteins in less fertile dairy cows. J Proteomics. 139:122–129.
- Zhao C, Shu S, Bai Y, Wang D, Xia C, Xu C. 2019. Plasma protein comparison between dairy cows with inactive ovaries and estrus. Sci Rep. 9:13709.