
 ?Mathematical formulae have been encoded as MathML and are displayed in this HTML version using MathJax in order to improve their display. Uncheck the box to turn MathJax off. This feature requires Javascript. Click on a formula to zoom.
Abstract
Milk somatic cell count (SCC), an indicator of udder health and milk hygiene, has not been implemented either in milk payment systems or in the current selection index of Italian buffalo so far. As a matter of fact, there is room to improve udder health through genetic and management strategies in this species. Repeated milk SCC test-day (TD) records on the same animal are useful to derive novel phenotypes on lactation basis by using somatic cell score (SCS) and thus to disclose buffaloes with udder issues to be monitored. In this study, sources of variation of SCC-derived traits in buffalo milk were investigated and their effect on milk yield and composition traits was estimated. Mean SCS (SCS150), standard deviation of SCS (SCS_SD150) and severity (SEV150, ratio between the number of TD SCC >200,000 cells/mL and total number of TD available in the first 150 DIM) in the first 150 days in milk were calculated using TD data of 45,312 lactations from 35,623 buffaloes. Sources of variation of such traits were investigated through a linear model. Both SCS150 and SEV150 increased with parity, whereas SCS_SD150 decreased (p < .001). Subsequently, the three traits were separately included in the model as explanatory variables to estimate their effect on milk yield and composition traits. Results showed that milk yield and lactose content were lower in animals with high and variable SCS in the first 150 days of lactation (p < .001). This study opens the debate on the development of an udder health index for the Italian buffalo.
So far, somatic cell count has not been considered in payment systems of buffalo milk in Italy.
There is need to improve mastitis resistance and udder health in dairy buffaloes.
Traits derived from test-day records can be used for management and breeding purposes in buffaloes.
HIGHLIGHTS
Introduction
Both milk somatic cell count (SCC) and somatic cell score (SCS) are used worldwide in milk-recording systems as quality and udder health indicators in livestock (Finocchiaro Citation2018; Franzoi et al. 2020; Costa, Negrini, Campanile et al. Citation2020). In many countries, regulations on the hygienic and sanitary characteristics of milk apply an SCC threshold to bovine milk intended to direct human consumption. For instance, in Europe, New Zealand, Canada, and Australia the limit is 400,000 cells/mL, and in the USA it reaches 750,000 cells/mL (Norman et al. Citation2011; Sharma et al. Citation2011). As regards buffalo milk, the European law only regulates bacterial count, which should not exceed 500,000 colony-forming unit/mL at 30 °C when milk is intended to raw-milk cheese manufacture (EU Regulation no. 853/2004 Citation2004). Italy is one of the major Mediterranean countries rearing buffaloes, together with Turkey and Egypt (Borghese and Moioli Citation2002). In these countries, buffalo milk is predominantly used to manufacture cheeses and other dairy products, like mozzarella, ghee, and domiati.
In buffaloes under the official milk recording program, SCC is routinely assessed in individual milk. Despite high SCC is associated with impaired coagulation ability of milk in buffalo (Guccione Citation2013) like in cattle (Franzoi et al., Citation2020), still, most of the payment systems of cheese industries do not account for this trait. Test-day (TD) data allow the monitoring of udder health at both individual and farm level across days in milk (DIM); however, the current selection index of Italian Mediterranean buffalo accounts for udder morphology (24%), feet and legs (20%), 270-days milk yield (21%), 270-days fat percentage (15%) and 270-days protein percentage (20%), but not for SCC (Associazione Nazionale Allevatori Specie Bufalina Citation2019).
It is well established that mastitis is often subclinical in buffalo, that is, latent inflammation with no signs, and frequently may become chronic (Sharma and Sindhu Citation2007; Guccione Citation2013). As regards causative pathogens, it has been observed that in half of the total mastitis cases there are usually more than one pathogen isolated and involved in the infection and inflammation (International Dairy Federation Citation2008). Some studies have investigated sources of variation of milk SCC in Anatolian (Şahin et al. Citation2017, Citation2019) and Marrah buffalo (Singh and Ludri Citation2001). Despite his, there is still uncertainty on the level of SCC that may be used to identify mastitis in buffalo and there is a lack of knowledge on udder health monitoring among farmers and milking personnel (International Dairy Federation Citation2008). In this context, repeated and objective measurements of milk performances, including SCC, may disclose buffaloes with udder issues to be monitored, managed with specific cares (i.e. milked separately) and possibly treated. Recently, Costa, Neglia, Campanile et al. (Citation2020) investigated milk SCC in the Italian buffalo population and reported that 28.4% of first-parity buffaloes had lactation average SCC ≥200,000 cells/mL, and in sixth-parity buffaloes, this percentage was even greater (39%). Thus, it is clear that the use of a single cut-off for SCC could have some limitations, but for routine practice, a single threshold would be much easier to be adopted (Guccione Citation2013). Some studies on bovine milk have proposed different phenotypes based on TD SCC or SCS to catch more variation of the trait and identify patterns and trends within lactation. For example, Green et al. (Citation2004) reported that the maximum level of SCC observed during lactation and variation of TD SCC were more efficient in predicting clinical mastitis than lactation means SCC. Koeck et al. (Citation2012) suggested that the percentage of TD SCC >200,000 and >500,000 cells/mL were informative in Canadian Holsteins. All the aforementioned studies have demonstrated that patterns and variability of SCS rather than the single TD or the lactation average are generally very informative on cow udder health and also on the type and severity of mastitis, particularly in the first half of lactation. Furthermore, it is important to recall that indicator traits like SCC must show genetic and phenotypic variation to be included in breeding programs and to identify the ‘best’ individuals in the population to be mated. Given this background, a similar approach is potentially exploitable in buffalo to investigate novel phenotypes for both managerial and breeding purposes to be used worldwide. Therefore, the present study aimed to investigate phenotypic variation of SCC-derived traits in buffalo milk and estimate their effects on milk production and composition in the first 150 DIM.
Materials and methods
Data
A total of 1,414,449 TD records of 106,388 Italian water buffaloes (Bubalus bubalis) were provided by the Italian Breeders Association (Rome, Italy) for the period January 2013 to December 2017. All herds underwent official milk recording procedures according to International Committee for Animal Recording (Citation2017). For each TD, information on buffalo ID, farm, birth date, date of calving, parity, DIM, milk yield (MY, kg/day), fat (FP, %), protein (PP, %), lactose (LP, %) and SCC (cells/mL) was available. Composition traits (FP, PP and LP) were determined by mid-infrared spectroscopy using MilkoScan™ FT6000 (Foss Electric A/S, Hillerød, Denmark) according to ISO 21543 (Citation2006) and SCC was assessed using Fossomatic™ FC (Foss Electric A/S, Hillerød, Denmark) according to ISO 13366 (Citation2006). All the analyses were performed in the milk laboratory of the Breeders Association of Campania region (Benevento, Italy). According to Associazione Italiana Allevatori (Citation2020) and International Committee for Animal Recording (Citation2017), lactating buffaloes were sampled every 4 or 6 weeks during the lactation.
All the farms were located in the area of production of the Protected Designation of Origin mozzarella cheese, where lactating buffaloes are usually housed in free stalls with access to the paddock, are fed with total mixed ration, and are typically divided into different groups according to the stage of lactation.
Editing
Buffaloes were required to be in parity 1 to 6 and to have the first calving between 24 and 55 months of age. Animals calved between 2013 and 2017. Only TD with SCC from 1000 to 10,000,000 cells/mL were retained. As regards MY, FP, PP and LP, values outside the range mean ± 3 standard deviations (SD) were treated as missing. In the window from 5 to 400 DIM, the median of SCC was 70,000, 88,000, 94,000, 97,000, 99,000 and 96,500 cells/mL for parity 1, 2, 3, 4, 5 and 6, respectively, and to achieve normality, SCC was converted to SCS using the formula of Ali and Shook (Citation1980): SCS = 3 + log2(SCC/100,000).
Subsequently, the focus was put on the first 150 DIM and thus TD above this limit were discarded and not considered for further investigation. Each lactation was required to have ≥5 TD SCC from 5 to 150 DIM, with the first available TD SCC within the first 35 DIM. The interval between two consecutive TD SCC was around 30 days. Finally, 232,669 TD from 45,312 lactations (5–150 DIM) of 35,623 buffaloes in 324 herds remained for subsequent statistical analysis.
Definition of SCC-derived traits
A description of the SCC-derived traits is provided in Table . In particular, mean (SCS150) and SD (SCS_SD150) of SCS in the first 150 DIM were calculated for each lactation as follows:
where
is the TD SCS,
is the lactation mean of all TD SCS within the lactation and
is the total number of TD SCS within the lactation. The severity (SEV150) was calculated as follows:
where
is the number of TD SCC >200,000 cells/mL in the first 150 DIM and
is the total number of TD SCC available in the first 150 DIM for each lactation. The threshold of 200,000 cells/mL was identified based on the existing literature (Dhakal Citation2006; Moroni et al. Citation2006; Tripaldi et al. Citation2010; Guccione Citation2013; Costa, Neglia, Campanile et al. Citation2020).
Table 1. Somatic cell count-derived traits in buffalo milk.
For each lactation, both mean and SD of MY, FP, PP and LP were calculated in a similar manner using the available TD (n ≥ 3) in the first 150 DIM.
Pearson correlations of SCS150 and SCS_SD150 with other traits were estimated, as well as Spearman correlations of SEV150 with other traits. In fact, considering the way SEV150 was calculated, ranking correlations were more appropriate. All statistical analyses were performed using the SAS software v.9.4 (SAS Institute Inc., Cary, NC).
Sources of variation of SCC-derived traits
The SCS150, SCS_SD150 and SEV150 were analysed according to the following random intercept multilevel linear model:
where Yijklmn is SCS150, SCS_SD150 or SEV150; μ is the population mean; Pi is the fixed effect of the ith parity (i = 1 to 6); Sj is the fixed effect of the jth season of calving (j = winter – December to February, spring – March to May, summer – June to August, autumn – September to November); Yk is the fixed effect of the kth year of birth (k = 2003 to 2015); (P × S)ij is the fixed interaction effect between parity and season of calving; Hl is the random intercept effect of the lth herd (l = 1 to 324); Bm(Hl) is the random intercept effect of the mth buffalo (m = 1 to 35,623) nested within the lth herd; and eijklmn is the random residual. The HPMIXED procedure of SAS software v.9.4 (SAS Institute Inc., Cary, NC) was used for the analysis of variance and the Bonferroni multiple comparisons post-hoc test was used to test if least squares means (LSM) of fixed effects differed significantly (p ≤ .05).
Effects of SCC-derived traits on milk yield and composition
In order to investigate the impact of SCS150, SCS_SD150 and SEV150 on the variability of mean and SD of MY and composition traits, SCC-derived traits were categorised and separately included as explanatory variables in a mixed linear model along with the same effects described in previous model. In particular, 5 classes of SCS150, 5 classes of SCS_SD150 and 4 classes of SEV150 were defined (Table ). The HPMIXED procedure of SAS software v.9.4 (SAS Institute Inc., Cary, NC) was used and the Bonferroni multiple comparison post-hoc test was used to test if LSM of the levels of SCS150, SCS_SD150 or SEV150 differed significantly (p ≤ .05).
Table 2. Definition of the classes of the somatic cell count-derived traitsa included as explanatory variables in the analysis of variance of yield and composition traits of buffalo milk, and number of lactations (n) for each class.
Results and discussion
Data overview
The first TD SCC (<35 DIM) was >200,000 cells/mL in 15.3% of lactations, likely due to the high SCC which normally occurs immediately after calving. Costa, Neglia, Campanile et al. (Citation2020) observed that 65.98% of first-parity buffaloes had at least one TD SCC ≥200,000 cells/mL in the lactation, and this percentage increased up to 72.12% in fifth-parity animals. In the same study, authors reported that a relevant proportion of animals had high levels of SCC for almost the entire lactation; in particular, 28.36% first-parity and 39.05% sixth-parity buffaloes had average SCC ≥200,000 cells/mL in the lactation. As in other dairy species, authors are aware that the physiological baseline of SCC could change across lactating animals and also across herds. Therefore, the use of a fixed threshold (e.g. 200,000 cells/mL) may be questionable; nevertheless, it is important to highlight that the overall aim of farmers and the dairy industry is to reduce SCC or SCS to optimise milk technological traits and improve health status. Therefore, a potential selection index to improve udder health in buffalo should define new indicators able to account for both the average and the variability of SCC.
Descriptive statistics of SCC-derived traits, MY and composition traits are presented in Table . Average SCS150 (2.80) corresponded to a SCC of 87,055 cells/mL and, together with average SCS_SD150 (1.25), mirrored findings reported by Bobbo et al. (Citation2018) in first-calving Holstein cows. In fact, those authors reported average SCS150 and SCS_SD (5–305 DIM) of 2.66 and 1.29, respectively. The SD of SCS in the first 150 DIM may be an efficient indicator of anomalous values and peak occurrence, and thus can be useful to identify buffaloes with unstable (undesired) SCS, regardless of the SCC level. Among the SCC-derived traits, SEV150 exhibited the greatest coefficient of variation (CV; Table ). Again, these results agreed with the findings of Bobbo et al. (Citation2018) in dairy cattle, where severity averaged 0.14 and had the greatest CV. About 47% of lactations did not show TD SCC >200,000 cells/mL in the first 150 DIM (class ‘zero’ of SEV150; Table ), meaning that the remaining 53% had at least 1 TD SCC >200,000 cells/mL. According to the threshold of 200,000 cells/mL proposed by Tripaldi et al. (Citation2010), this means that there was at least one udder inflammation event in 53% of lactations. Milk yield averaged 10.75 kg/day and showed a CV of 23.14%, and means of FP, PP and LP were 7.67, 4.60 and 4.82%, respectively (Table ). Mean FP and LP had the highest (11.77%) and the lowest CV (3.61%), in agreement with findings on buffalo and bovine milk-based on whole lactation (Tripaldi et al. Citation2010; Costa, Lopez-Villalobos, Visentin, et al. Citation2019; Costa, Negrini, De Marchi et al. Citation2020). Comparison with the literature is difficult for the SD of MY, FP, PP and LP, due to the lack of large-scale studies that have investigated such traits in dairy species. The average SD of MY was 1.96 kg/day, with quite a high CV (47.91%). Concerning milk components, the lowest average SD was observed for LP (0.25%) and the greatest for FP (1.25%). Also, the greatest CV was calculated for LP (57.72%; Table ). Parity-specific descriptive statistics are provided in Supplemental Table S1.
Table 3. Descriptive statistics of somatic cell count-derived traitsa, and of mean and SD of yield and composition traits of buffalo milk (45,312 lactations).
Correlations
The strongest correlation (0.85; p < .05) was estimated between SCS150 and SEV150, whereas weak associations were assessed between SCS150 and SCS_SD150 (0.15; p < .05), and SCS_SD150 and SEV150 (0.28; p < .05, Table ). In Holstein cows, Bobbo et al. (Citation2018) estimated a slightly lower correlation of 0.70 between SCS150 and severity, and slightly stronger associations of 0.20 between SCS150 and SCS_SD, and 0.42 between severity and SCS_SD compared with our findings, likely due to differences in the temporal window (DIM) and species. Correlations suggest that each SCC-derived trait can provide additional information on the udder health status of animals. Correlations of SCC-derived traits with mean and SD of MY, FP, PP and LP were generally very weak (<0.10; Table ); indeed, the strongest correlation (−0.22; p < .05) was observed between SCS150 and LP. The inverse relationship between LP and SCS has been widely described in the literature for dairy species (Fox et al. Citation2015; Costa, Lopez-Villalobos, Sneddon, et al. Citation2019) and indicates that LP tends to drop in presence of high SCC (udder inflammation). Barbosa et al. (Citation2019) estimated a similar correlation (−0.23) in Brazilian Murrah buffalo. In the study of Costa, Neglia, Campanile et al. (Citation2020) correlations were calculated within subsets created on the basis of average lactation SCC. In buffaloes with average lactation SCC <200,000 cells/mL the correlation between SCS and LP was −0.27 and the magnitude increased up to −0.35 in buffaloes with average SCC ≥500,000 cells/mL. Overall, both SCS150 and SEV150 were weakly negatively associated with means of MY, FP and PP, whereas SCS_SD150 was weakly positively associated with FP and PP (Table ). Such findings agreed with Costa, Neglia, Campanile et al. (Citation2020), except for the correlation between SCS150 and MY which was slightly weaker in our study compared with Costa, Neglia, Campanile et al. (Citation2020) who used TD data rather than mean MY and SCS. Supporting this, Moroni et al. (Citation2006) reported a weak correlation between SCS and MY in Italian water buffaloes. Furthermore, the same authors observed a slightly increasing trend of the magnitude of the correlation between MY and SCS at different levels of SCC, that is, buffaloes with average lactation SCC <200,000 (−0.10), ≥200,000 (−0.15), ≥300,000 (−0.17), ≥400,000 (−0.18) and ≥500,000 (−0.19).
Table 4. Correlationsa (p ≤ .05) between somatic cell count-derived traitsb and mean and SD of milk yield and composition traits.
Factors affecting SCC-derived traits
All fixed effects included in the statistical model significantly explained the variation of the SCC-derived traits, with the only exception of the interaction between parity and season of calving for SCS_SD150. In particular, p-values of fixed effects were <.001 for SCS150 and SCS_SD150 and <.01 for SEV150. The proportion of variance explained by the random effects indicated that the variation of the traits was more attributable to the herd effect rather than to the buffalo within-herd effect (Table ); this could suggest that preventive rather than curative efforts should be allocated at the farm level and thus the key factor for a short-term efficient reduction of SCC is the management.
Table 5. Least squares means ± standard error of somatic cell count-derived traitsa of buffalo milk for the fixed effects of parity and calving season.
The LSM of SCS150, SCS_SD150 and SEV150 for the fixed effects of parity and season of calving are shown in Table . While SCS150 and SEV150 were the greatest in parity 5 and 6, and the lowest in parity 1, the maximum value of SCS_SD150 (1.44 ± 0.02) was estimated for parity 1. This suggested that variability of SCS in buffalo decreases with parity, that is when the average SCS increases. As regards the season of calving, results highlighted that buffaloes calving in spring and summer had significantly lower SCS150 (2.73 ± 0.05 and 2.76 ± 0.05, respectively) than buffaloes calving in autumn and winter (Table ). The opposite was observed for SCS_SD150, with the greatest values in spring and summer and the lowest in autumn and winter (Table ). Finally, despite significance, the variation of SEV150 across the four seasons was negligible (Table ).
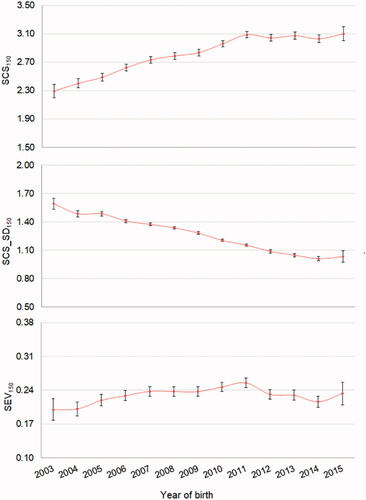
The trend of the SCC-derived traits across the year of birth of buffaloes is depicted in Figure . Overall, the results suggested that the average level of SCS is increasing in the population while the variability of SCS is slightly decreasing (Figure ).
Figure 1. Least squares means (±standard error) of the investigated traits across years of birth of buffalo cows. SCS150 = mean of test-day somatic cell score of the first 150 days in milk; SCS_SD150 = SD of test-day somatic cell score of the first 150 days in milk; SEV150 = severity, calculated as ratio between the number of test-day somatic cell count >200,000 cells/mL and the total number of test-day somatic cell count in the first 150 days in milk.
Impact of SCC-derived traits on milk yield and composition
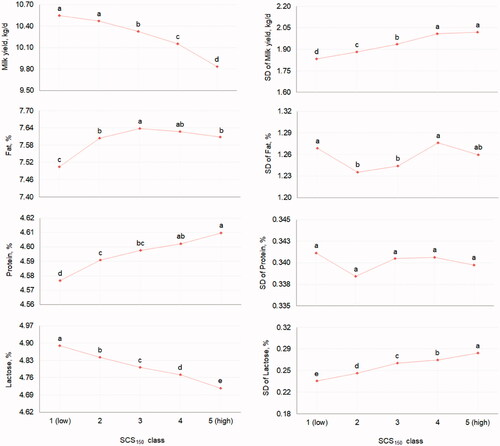
Overall, MY and all composition traits were significantly affected by SCC-derived traits (p < .05), with only a few exceptions. The LSM of milk traits for the fixed effect of SCS150 (5 classes) are depicted in Figure . Mean MY gradually decreased from class 1 (10.54 ± 0.09) to class 5 (9.83 ± 0.09), oppositely to MY SD, which exhibited the greatest estimates in classes 4 and 5 and the lowest in class 1 (Figure ). The increase of SCS150 resulted in a progressive reduction of mean LP from 4.89 ± 0.01 (class 1) to 4.72 ± 0.01 (class 5) and to a linear increase of PP. On the other hand, mean FP increased from class 1 to 3 of SCS150 (Figure ). These results generally agreed with previous findings of Cerón-Muñoz et al. (Citation2002) and Tripaldi et al. (Citation2010) in buffalo, and Costa, Egger-Danner, et al. (Citation2019) in dairy cattle. In fact, Cerón-Muñoz et al. (Citation2002) observed lower MY and LP, and greater FP and PP in correspondence of high SCC in 222 Murrah buffaloes. Similarly, El-Awady et al. (Citation2016) reported that high milk SCC was associated with greater FP and MY losses in Egyptian buffaloes. Moreover, Bansal et al. (Citation2007) found LP to have the best discrimination ability for udder inflammation in 101 Murrah buffaloes. In cattle, Ebrahimie et al. (Citation2018) observed similar findings using machine learning algorithms; in particular, lower LP in combination with lower MY was a pattern discovered by one of the decision trees built by the model. In this study, results suggest also that synthesis of fat and protein and thus FP and PP were not impaired by high SCC and/or udder inflammation. In other words, considering the concentration effect, the reduction of MY seems to be responsible for the (apparent) increase of FP and PP in milk, as previously observed by Tripaldi et al. (Citation2010) in buffalo. In support of this, SD of both FP and PP did not show a specific trend across classes of SCS150, whereas LP SD progressively increased.
Figure 2. Least squares means of mean and SD of yield and composition traits of buffalo milk for the fixed effect of the mean somatic cell score in the first 150 days in milk (SCS150, 5 classes: from 1 = low to 5 = high). Different letters indicate significantly different means (p ≤ .05).
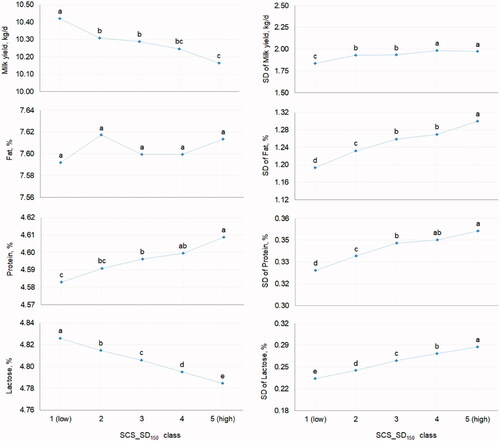
The LSM of mean MY and LP were the greatest in class 1 of SCS_SD150 (10.42 ± 0.09 and 4.83 ± 0.01, respectively) and the lowest in class 5 (10.16 ± 0.09 and 4.78 ± 0.01, respectively; Figure ). Mean PP slightly increased in a linear manner moving from class 1 (4.58 ± 0.01) to class 5 (4.61 ± 0.01). In general, it is important to highlight that a large variability of SCS is undesired in dairy species and thus animals with low SCS150 and low SCS_SD150 should be preferred as they exhibit optimal resistance to udder infections and prompt immune response. This is supported by findings of the present study; in fact, mean MY and LP were the greatest in class 1 of SCS_SD150, where their SD was minimum (Figure ). In general, the SD of all milk traits was affected by SCS_SD150. Anyway, it is worth stressing that mastitis in buffaloes is often chronic or subclinical and thus mean and/or SD of SCS may not be exhaustively informative.
Figure 3. Least squares means of mean and SD of yield and composition traits of buffalo milk for the fixed effect of the SD of somatic cell score in the first 150 days in milk (SCS_SD150, 5 classes: from 1 = low to 5 = high). Different letters indicate significantly different means (p ≤ .05).
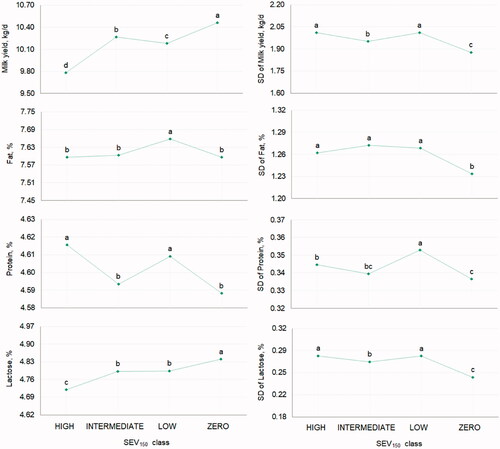
The LSM of mean MY and LP showed that these traits were affected similarly by SEV150, with the greatest means estimated for the ‘zero’ class and the lowest for the ‘high’ class (Figure ). In other words, the greatest MY was estimated for buffaloes with all TD SCC <200,000 cells/mL during the first 150 DIM. On the contrary, buffaloes with more than half of TD SCC >200,000 cells/mL were the less productive and were characterised by the lowest milk LP. Mean FP and PP were less easy to be interpreted; for instance, mean PP in ‘low’ and ‘high’ classes were not significantly different, as well as mean PP in ‘zero’ and in ‘intermediate’ classes. Overall, for all traits, the SD was the lowest in class ‘zero’ but did not follow the expected linear pattern in ‘low’, ‘intermediate’ and ‘high’ classes (Figure ).
Figure 4. Least squares means of mean and SD of yield and composition traits of buffalo milk for the fixed effect of severity (SEV150, 4 classes: zero, low, intermediate, high), defined as the ratio between the number of test-day somatic cell count >200,000 cells/mL and the total number of test-day somatic cell count in the first 150 days in milk. Different letters indicate significantly different means (p ≤ .05).
Conclusions
In the present study, milk SCC-derived traits were investigated in a large dataset of Italian water buffaloes to promote informative novel phenotypes for breeding and management purposes, and to quantify the impact of different levels of SCS on milk production and quality. Results showed that milk traits were impaired by high and variable SCS in the first 150 DIM. A negative association was observed between SCS150 and LP, opening the debate on the validation of such trait for monitoring buffalo udder health in combination with other features. Finally, we demonstrated that high SCS150 are translated into less MY. In perspective, further studies will validate these udder health indicators with clinical mastitis data and milk spectra to exploit routinely available information for genetic purposes and develop an udder health index for the dairy buffalo. Moreover, the effect of high SCS on the sensory characteristics of cheeses may also be investigated. Such findings on Italian buffalo may be extended to other populations worldwide and may open the debate on the need of implementing a specific recording scheme for udder diseases in the near future. In fact, the improvement of udder health/mastitis resistance at the population level usually takes a long time to be observed, particularly if artificial insemination is scarcely adopted and if productive life of lactating animals is long like in dairy buffalo.
Ethical approval
Data and milk spectra used in this study were collected during the routine milk recording, therefore the authorisation of the animal welfare and ethics committee was not required.
Supplemental Material
Download MS Word (21.7 KB)Acknowledgements
The Italian Breeders Association (Rome, Italy) and the Breeders Association of Campania region (Benevento, Italy) are gratefully acknowledged for providing data used in this study.
Disclosure statement
No potential conflict of interest was reported by the author(s).
Additional information
Funding
References
- Ali AKA, Shook GE. 1980. An optimum transformation for somatic cell concentration in milk. J Dairy Sci. 63(3):487–490.
- Associazione Italiana Allevatori. 2020. Disciplinaire dei controlli dell’atitudine produttiva per la produzione del latte [Internet]. Rome (Italy): AIA; [accessed 2020 January 30]. http://www.aia.it/CMSContent/DisciplinareLATTE.pdf
- Associazione Nazionale Allevatori Specie Bufalina. 2019. Nuovi indici genetici [Internet]. Centurano (Italy): ANASB; [accessed 2019 December 23]. http://www.anasb.it/nuovi-indici-genetici-2018/
- Bansal BK, Hamann J, Lind O, Singh ST, Dhaliwal PS. 2007. Somatic cell count and biochemical components of milk related to udder health in buffaloes. Ital J Anim Sci. 6(2):1035–1038.
- Barbosa SBP, Modesto EC, Lopes FdA, Silva ECd, Abad ACA. 2019. Relationship between milk production system and milk traits and somatic cell counts in Brazilian Murrah buffaloes: a multivariate analysis. Acta Sci Anim Sci. 42:e46522.
- Bobbo T, Penasa M, Finocchiaro R, Visentin G, Cassandro M. 2018. Alternative somatic cell count traits exploitable in genetic selection for mastitis resistance in Italian Holsteins. J Dairy Sci. 101(11):10001–10010.
- Borghese A, Moioli B. 2002. Buffalo husbandry. Mediterranean Region. In: Roginski H, editor. Encyclopedia of dairy sciences. Amsterdam (The Netherlands): Elsevier; p. 193–197.
- Cerón-Muñoz M, Tonhati H, Duarte J, Oliveira J, Muñoz-Berrocal M, Jurado-Gámez H. 2002. Factors affecting somatic cell counts and their relations with milk and milk constituent yield in buffaloes. J Dairy Sci. 85(11):2885–2889.
- Costa A, Negrini R, De Marchi M, Campanile G, Neglia G. 2020. Phenotypic Characterization of Milk Yield and Quality Traits in a Large Population of Water Buffaloes. Animals. 10(2):327 doi:https://doi.org/10.3390/ani10020327.
- Costa A, Egger-Danner C, Mészáros G, Fuerst C, Penasa M, Sölkner J, Fuerst-Waltl B. 2019. Genetic associations of lactose and its ratios to other milk solids with health traits in Austrian Fleckvieh cows. J Dairy Sci. 102(5):4238–4248.
- Costa A, Lopez-Villalobos N, Sneddon NW, Shalloo L, Franzoi M, De Marchi M, Penasa M. 2019. Invited review: milk lactose-current status and future challenges in dairy cattle. J Dairy Sci. 102(7):5883–5898.
- Costa A, Lopez-Villalobos N, Visentin G, De Marchi M, Cassandro M, Penasa M. 2019. Heritability and repeatability of milk lactose and its relationships with traditional milk traits, somatic cell score and freezing point in Holstein cows. Animal. 13(5):909–916.
- Costa A, Neglia G, Campanile G, De Marchi M. 2020. Milk somatic cell count and its relationship with milk yield and quality traits in Italian water buffaloes. J Dairy Sci. 103(6):5485–5494.
- Dhakal IP. 2006. Normal somatic cell count and subclinical mastitis in Murrah buffaloes. J Vet Med Series B. 53(2):81–86.
- Ebrahimie E, Ebrahimi F, Ebrahimi M, Tomlinson S, Petrovski KR. 2018. Hierarchical pattern recognition in milking parameters predicts mastitis prevalence. Comput Electron Agr. 147:6–11.
- El-Awady HG, Ashour AF, Shamia SM. 2016. Genetic and economic evaluation for the relationship between somatic cell counts, milk yield and milk constituents in Egyptian buffaloes. Buffalo Bull. 35:607–618.
- EU Regulation no. 853/2004. 2004. [accessed 2019 December 22]. https://eur-ex.europa.eu/LexUriServ/LexUriServ.do?uri=OJ:L:2004:139:0055:0205:EN:PDF.
- Finocchiaro R. 2018. Alternative use of somatic cells counts in genetic selection for mastitis resistance: a new estimated breeding value for Italian Holstein breed. Interbull Bulletin. 53:31–33.
- Fox PF, Uniacke-Lowe T, McSweeney PLH, O’Mahony JA. 2015. Dairy chemistry and biochemistry. Cham (Switzerland): Springer International Publishing.
- Franzoi M, Manuelian CL, Penasa M, De Marchi M. 2020. Effects of somatic cell score on milk yield and mid-infrared predicted composition and technological traits of Brown Swiss, Holstein Friesian, and Simmental cattle breeds. J Dairy Sci. 103(1):791–804.
- Green MJ, Green LE, Schukken YH, Bradley AJ, Peeler EJ, Barkema HW, de Haas Y, Collis VJ, Medley GF. 2004. Somatic cell count distributions during lactation predict clinical mastitis. J Dairy Sci. 87(5):1256–1264.
- Guccione J. 2013. Clinical and diagnostical aspects in dairy Mediterranean buffalo mastitis [PhD thesis]. Naples (Italy): Università degli Studi di Napoli Federico II.
- International Committee for Animal Recording. 2017. Guidelines for buffalo milk recording [Internet]. Rome (Italy): ICAR; [accessed 2020 February 17]. https://www.icar.org/Guidelines/17-Buffalo-Milk-Recording.pdf
- International Dairy Federation. 2008. Milking management of dairy buffaloes. Brussels (Belgium): IDF. IDF Bulletin 426/2008.
- ISO 13366. 2006. Milk – enumeration of somatic cells – Part 2: guidance on the operation of fluoro-opto-electronic counters. Geneva (Switzerland): International Organization for Standardization.
- ISO 21543. 2006. Milk and milk products – guidelines for the application of near infrared spectrometry. Geneva (Switzerland): International Organization for Standardization.
- Koeck A, Miglior F, Kelton DF, Schenkel FS. 2012. Alternative somatic cell count traits to improve mastitis resistance in Canadian Holsteins. J Dairy Sci. 95(1):432–439.
- Moroni P, Sgoifo Rossi C, Pisoni G, Bronzo V, Castiglioni B, Boettcher PJ. 2006. Relationships between somatic cell count and intramammary infection in buffaloes. J Dairy Sci. 89(3):998–1003.
- Norman HD, Lombard JE, Wright JR, Kopral CA, Rodriguez JM, Miller RH. 2011. Consequence of alternative standards for bulk tank somatic cell count of dairy herds in the United States. J Dairy Sci. 94(12):6243–6256.
- Regulation (EC) no. 853/2004 of the European Parliament and of the Council of 29 April 2004 laying down specific hygiene rules for food of animal origin. [accessed 2019 December 22]. https://eur-ex.europa.eu/LexUriServ/LexUriServ.do?uri=OJ:L:2004:139:0055:0205:EN:PDF.
- Şahin A, Yildirim A, Ulutaş Z, Ugurlutepe E. 2017. The effects of stage of lactation, parity and calving season on somatic cell counts in Anatolian Water Buffaloes. Indian J Anim Res. 51(1): 35–39.
- Şahin A, Yildirim A, Ulutaş Z. 2019. The effects of storage temperature and storage time on the somatic cell count of Anatolian buffaloes. Buffalo Bulletin. 38:299–309. Available at: Accessed on: 11 mar. 2021.
- Sharma A, Sindhu N. 2007. Occurrence of clinical and subclinical mastitis in buffaloes in the State of Haryana (India). Ital J Anim Sci. 6(2):965–967.
- Sharma N, Singh NK, Bhadwal MS. 2011. Relationship of somatic cell count and mastitis: an overview. Asian Australas J Anim Sci. 24(3):429–438.
- Singh M, Ludri RS. 2001. Somatic Cell Counts in Marrah Buffaloes (Bubalus bubalis) During Different Stages of Lactation, Parity and Season. Asian Australas J Anim Sci. 14(2):189–192. https://doi.org/https://doi.org/10.5713/ajas.2001.189
- Tripaldi C, Palocci G, Miarelli M, Catta M, Orlandini S, Amatiste S, Di Bernardini R, Catillo G. 2010. Effects of mastitis on buffalo milk quality. Asian Australas J Anim Sci. 23(10):1319–1324.