
 ?Mathematical formulae have been encoded as MathML and are displayed in this HTML version using MathJax in order to improve their display. Uncheck the box to turn MathJax off. This feature requires Javascript. Click on a formula to zoom.
Abstract
The livestock sector constitutes 14.5% of global green-house gas (GHG) emissions and soil and water pollution due to nitrogen excretion. Methane and nitrogen excretions in ruminants can be mitigated by specific feeding strategies, and tannins reduce methanogenesis and ammonia syntheses. In our study, two kinds of condensed tannins (Mimosa and Gambier) and two kinds of hydrolysable tannins (Chestnut and Tara) were added (4 g/100 g DM) to a basal feed (barley: 48 g/100 g DM, wheat bran: 23 g/100 g DM, dehydrated alfalfa hay:15 g/100 g DM, soybean meal: 10 g/100 g DM and molasses: 2 g/100 g DM), inoculated with rumen fluid and fermented for 24 h. The methane, ammonia, fatty acid and plasmalogen lipid profile were determined. The results confirmed that tannins are an important family of heterogeneous compounds whose effect on rumen metabolism is strongly linked to their different characteristics. Chestnut tannin extract was shown to be a good compromise. It improved the sustainability of ruminant rearing by decreasing methanogenesis (control feed 0.159 vs chestnut feed 0.137 mmol/L rumen fluid; p = .0326), ammonia production (control feed 248 vs chestnut feed 179 mg/L rumen fluid; p < .0001) and enhancing acetate synthesis (production rate: chestnut 68.68% vs 49.64% of control).
Tannin extracts from trees and shrubs can be used to modulate rumen fermentation.
The positive effect of chestnut tannin extract was demonstrated on methane and ammonia production.
Tannins showed no protective action on C18:2 trans 11.
HIGHLIGHTS
Keywords:
Introduction
Livestock systems contribute approximately 40% of agricultural output and support the livelihoods of almost 1.3 billion people (FAO Citation2009). However, the livestock sector is growing rapidly and accounts for 14.5% of the global green-house gas (GHG) emissions and soil and water pollution due to nitrogen excretions. Sustainable strategies for livestock farming and animal nutrition are thus essential (Dehority Citation2004; Buccioni et al. Citation2014).
Methane and nitrogen excretions in ruminants can be mitigated by several approaches, including specific feeding strategies. Tannins reduce methane and ammonia emission by interfering with rumen microbial activities. Tannins belong to the family of phenolic compounds which is a large class of plant secondary metabolites. In the plant kingdom, they are particularly found in trees, shrubs and in some spontaneous herbaceous plants.
Depending on their molecular structure, tannins are classified as condensed or hydrolysable. These two groups are characterised by very different chemical and bioactive properties. Protein microbial degradation is usually reduced by dietary tannins, leading to a lower accumulation of ammonia in the rumen liquor (Vasta et al. Citation2010; Patra and Saxena Citation2011; Buccioni et al. Citation2015a, Citation2015b; Vasta et al. Citation2019). At the same time, both hydrolysable and condensed tannins have been associated with a reduction in methane emissions, although different mechanisms have been proposed to explain this effect (Vasta et al. Citation2019).
Several kinds of condensed or hydrolysable tannins have been tested in animal nutrition and in many cases, changes in the microbial community profile of rumen have been reported (Vasta et al. Citation2010; Buccioni et al. Citation2011, Citation2015a, Citation2015b, Citation2017). Some types of tannins show also specific antimicrobial properties, such as ‘gambier’ or ‘catechu’ which are extracted from the leaf and twigs of the Uncaria gambir shrub (Achmadi Citation2019). Similarly, tannin extracts from leaves of Tara (Caesalpinia spinosa Molina Kuntze) have antimicrobial properties against coliform bacteria in monogastric animals (Huang et al. Citation2018).
The aim of this in vitro study was to evaluate the effects of the dietary addition of two kinds of condensed tannins (Mimosa and Gambier) and two kinds of hydrolysable tannins (Chestnut and Tara) on ammonia and methane production, fatty acids and plasmalogen lipid profile, and biohydrogenation process in rumen liquor fermented for 24 h.
Materials and methods
Experimental design
Feed
A basal feed of barley (48 g/100 g dry matter – DM), wheat bran (23 g/100 g DM), dehydrated alfalfa hay (15 g/100 g DM), soybean meal (10 g/100 g DM) and molasses (2 g/100 g DM) was used as the control feed (CON). This basal feed was supplemented with 4 g/100 g DM of mimosa tannin extract (from A. dealbata Link) composed of 65% tannin (Silva Chimica srl, San Michele Mondovì, Cuneo, Italy), mimosa feed (MF); 4 g/100 g DM of gambier tannin extract (from U. gambir W. Hunter) composed of 48% tannin (Figli di Guido Lapi spa, Santa Croce sull’Arno, Pisa, Italy), gambier feed (GF); 4 g/100 g DM of Tara tannin extract (from C. spinosa Molina Kuntze) composed of 95% tannin (Silva Chimica srl, San Michele Mondovì, Cuneo, Italy), Tara feed (TF); 4 g/100 g DM of chestnut tannin extract (from C. sativa Mill.) composed of 75% tannin (Silva Chimica srl, San Michele Mondovì, Cuneo, Italy), chestnut feed (CF). The tannin content was determined according to Burns (Citation1963).
The dose of tannins adopted was similar to that previously used in in vivo trials (Salami et al. Citation2018; Valenti et al. Citation2019). Experimental feed ingredients and their chemical composition are reported in Tables and , respectively.
Table 1. Composition of the feeds studied in this in vitro trial (g/100 g DM-1).
Table 2. Chemical composition of the diets studied in this in vitro trial (g/100 g DM-1).
Feed sampling and analysis
Feeds were sampled before fermentation, dried at 40 °C, ground using a Cyclotec 1093 mill (PBI International, Milan, Italy) with a mesh size of 1 mm and stored at −80 °C until the analysis. Crude protein (CP) and ether extract (EE) were determined according to AOAC methods 976.06 and 920.39, respectively (AOAC International Citation1995). The contents of neutral detergent fibre (NDF), acid detergent fibre (ADF) and lignin (ADL) were determined using heat-stable amylase and sodium sulphite, according to Van Soest et al. (Citation1991). The results were expressed as inclusive of residual ash. Neutral detergent insoluble protein was estimated according to the Cornell Net Carbohydrate and Protein System (CNCPS) (Licitra et al. Citation1996). Fatty acids were extracted according to Folch et al. (Citation1957), and methylated by sodium methylate in methanol (MeO− Na+/MeOH, 0.5 M) according to Christie (Citation1982). The fatty acid profile was then determined by gas chromatography.
Animals
The experiment was conducted at the Centro di Ricerche Agro-Ambientali “Enrico Avanzi” of the University of Pisa, Italy. Animals were handled according to the guidelines of Italian law on animal welfare for experimental animals (Italian Ministry of Health Citation2014).
Five Massese ewes were conditioned with the basal diet used as the control feed in the in vitro trial. The animals had continuous access to water. On day 21, rumen liquor samples were collected from each ewe (about 0.5 L per animal) using a stomach tube connected to a manual pump according to Ramos-Morales et al. (Citation2014). Rumen liquor samples were collected 3 h after the morning feed. Immediately after collection, rumen liquor samples were transferred by a temperature-controlled box (39 °C) to the laboratory and prepared for the in vitro trial.
In vitro batch fermentation
Rumen liquor was filtered through four layers of cheese-cloth into a flask under a continuous flow of CO2, the volatile fatty acid profile was analysed (as described below) and buffered (1:3, v/v) with McDougal solution (McDougall Citation1948) under anaerobic conditions.
Feeds (2 g of DM) were incubated with 200 mL of inoculum in a 250 mL fermenter under a continuous flow of CO2. Three fermentation runs were carried out, and each treatment was fermented in triplicate per run. The apparatus consisted of a thermostatic chamber (39–40 °C) equipped with eighteen 250 mL fermenters, continuously stirred, and provided with one inlet to release gas through a valve and connected to an electronic pressure transducer. The valve was connected to a gas chromatograph (micro-GC Agilent 3000) in order to measure and characterise the total gas production during the fermentation from each fermenter. The fermentation pressure was continuously measured by pressure piezo-resistive transducers, registered every 30 s over 24 h using a dedicated programmable logic controller connected to a PC.
Gas sampling and analysis
The cumulative volume of gas produced in each glass fermentation vessel was calculated according to Ragaglini et al. (Citation2014) using the ideal gas law and the molar volume of ideal gases at standard temperature and pressure conditions (1 bar, 273.15 K). These data were used to calculate the percentage of methane produced. The headspace gas in the fermenters was collected at 6, 12 and 24 h and immediately analysed by a gas chromatograph (micro-GC Agilent 3000), to determine methane according to Angelidaki et al. (Citation2009). Data were expressed as mmol/L of total gas.
Rumen liquor sampling and analysis
At the end of each fermentation time, the pH of the rumen liquor samples was measured (pH metre XS PH7) and the samples were quickly filtered through four layers of cheese-cloth into a flask and split into four aliquots for the analysis described below.
Ammonia determination
Five mL of rumen liquor were acidified with 5 mL of 0.2 M HCl solution. Samples were then centrifuged at 5000×g for 30 min at room temperature. The concentration of ammonia was determined according to Weatherburn (Citation1967) using a UV spectrophotometer (Varian, Cary 50 SCAN). Data were expressed as mg/L.
Volatile fatty acid (VFA) determination
The rumen liquor volatile fatty acids (C2:0, acetic; C3:0, propionic; C4:0, butyric) were analysed by high performance liquid chromatography (HPLC): a volume of 10 mL of rumen liquor was diluted with H2SO4 0.1 N solution (1:1) and centrifuged (5000×g for 15 min at 4 °C) to separate the liquid phase from the feed residuals. The liquid phase was then micro-filtered (0.45 μm millex – HV) and the sample was directly injected into the HPLC apparatus using an ion exclusion column Aminex 85 HPX − 87 H (300 mm × 7.8 mm; Å-sized pores, 9 μm sized particle; Biorad, Milan, Italy) and kept at 40 °C. The detection wavelength was 220 nm. The analyses were carried out using an isocratic elution (flux 0.6 mL/min) with a H2SO4 0.008 N solution as the mobile phase. The injection loop was 20 μL. Individual volatile fatty acids were identified using a standard solution of 4.50 mg/mL of acetic acid, 5.76 mg/mL of propionic acid, 7.02 mg/mL of butyric acid in H2SO4 0.1 N (cod. 338826, 402907, B103500, respectively; Sigma-Aldrich, St Louis, MO, USA). The quantification was obtained using an external calibration curve based on the standards described above. Data were expressed as mmol.
Fatty acid and plasmalogen lipid characterisation
Plasmalogen lipids are contained in the microbial membrane and are strictly related to the bacterial species (Alves et al. Citation2013). They are commonly identified and quantified by converting them into dimethylacetals (DMA), an artefact formed during the methylation of rumen fatty acids for chromatographic analysis (Alves et al. Citation2013). Two other aliquots of rumen liquor were thus freeze-dried and subsequently analysed in order to determine the fatty acid and DMA profile according to Jenkins (Citation2010) as modified by Alves et al. (Citation2013). Briefly: FA were trans-esterified using C9:0 and C19:0 (1 mg/mL) as internal standards (Kramer et al. Citation1997; Alves et al. Citation2013). Fatty acids and DMA fractions were then separated by thin-layer chromatography (TLC). The fatty acids and DMA were identified by a GC2010 Shimadtzu gas chromatograph (Shimadzu, Columbia, MD, USA) equipped with a flame-ionisation detector and a high polar fused-silica capillary column (Chrompack CP-Sil 88 Varian, Middelburg, the Netherlands; 100 m, 0.25 mm i.d.; film thickness 0.20 μm). Hydrogen was used as the carrier gas at a flow of 1 mL/min. A split/splitless injector was used with a split ratio of 1:80. An aliquot of the sample was injected under the following GC conditions: the oven temperature started at 60 °C which was held for 1 min. It was then increased to 173 °C at a rate of 2 °C/min, and held for 30 min, before being once again increased to 185 °C at 1 °C/min and held for 5 min, and then to 220 °C at a rate of 3 °C/min, and held for 19 min. The injector temperature was set at 270 °C and the detector temperature was set at 300 °C. Data related to fatty acids and DMA were expressed as g/100 of fatty acids + DMA.
Statistical analysis
At each sampling time, data related to methane production, ammonia, volatile fatty acids, fatty acids and DMA profile were processed as a completely randomised design using the following linear mixed. The individual data from each bottle were used. The model used the SAS 9.2 package.
where y is the observation; Di is the fixed effect of diet (i = 1 to 5); Tj is the fixed effect of sampling time (j = 1 to 3); D*Tij is the interaction between diet and sampling time; batch(random)k is the random effect of the fermentation run (k = 1 to 3) and eijk is the residual error.
Multiple comparisons among means were performed using the Tukey test.
Results
Gas production and pH
The overall amount of millimoles of methane produced during the fermentation time increased for all the treatments (time effect was significant, p < .0001). There was no interaction between the time and treatments (p = .7608), whereas the diet effect was significantly different (p = .03). The average amount of methane produced was lower when MF, CF and TF were fermented, compared with CON and GF (CON, 0.159 a; MF, 0.141 b; GF, 0.0.160 a; TF, 0.146 ab; CF, 0.137 b; SEM = 0.009; p = .0326; means of diet effect expressed as mmol/L in rumen liquor; Table ).
Table 3. Methane production (mmol/L) at each sampling time.
Data related to pH value after 24 h of fermentation did not show significant differences among treatments (CON 6.67; MF 6.67; GF 6.67; TF 6.69; CF 6.70).
Ammonia production
The pattern of ammonia production differed significantly across treatments, resulting in a significant effect of the interaction Diet × Time (Table ). After 6 h, the ammonia content in rumen liquor from CON fermenters was two to three times higher, compared to the other treatments, irrespective of the type of tannin (Table ). After 12 h, the ammonia nearly halved from 105.75 to 54.52 mg/L in the CON fermenter, whereas in the fermenters containing tannins, the ammonia content did not vary or decreased slightly. After 24 h, the content of ammonia increased in all fermenters, however the final content was significantly higher in the rumen liquor from the CON fermenter, compared to the other treatments. At the end of fermentation, the average ammonia content was significantly lower in fermenters containing MF (Table ).
Table 4. Ammonia production (mg/L) at each sampling time (6, 12, 24 h).
Volatile fatty acid production
Both acetate and propionate production increased throughout the fermentation, irrespective of the treatment (Table ).
Table 5. Volatile fatty acid (VFA) production (mmol/L) at each sampling time (0, 6, 12, 24 h).
The effect of the treatment was significant for acetate. Considering the concentration of each single volatile fatty acid at the end of fermentation, the mean acetate value from the GF treatment was significantly higher than those from the other treatments (p < .05). Interestingly, considering the percentage of production from 6 h to 24 h, acetate was highest in CF fermenters. The butyrate content also increased for all the treatments throughout the fermentation, with the exception of the CON treatment, for which the butyrate content in the rumen liquor remained constant (DxT interaction p = .053, Table ). The total amount of volatile fatty acids increased during fermentation and tended to be higher for the GF treatment (p = .104). Overall, the ratio C2:0/C3:0 did not change across treatments, and there was a general decrease during fermentation, irrespective of the treatment (p = .01).
Fatty acid and DMA profile
Considering the effect of the interaction between Diet × Time (DxT), the fatty acid profile did not show changes, apart from C15iso. In the rumen liquor fermenting CON, the C15iso content increased during the first 12 h, then decreased. Inversely, the C15iso content in the MF fermentation decreased from 6 to 24 h and, at the end of fermentation, the C15iso content was the lowest compared with CON and the other tannin treatments (Table ). During fermentation, the C15iso content increased in both the hydrolysable tannin sources (TF and CF) and in GF treatment, but with a different temporal pattern: the TF and GF treatments reached the maximum content after 12 h, whereas the CF treatment reached it at the end of the fermentation time (24 h). Considering the diet effect, C17:0iso was decreased by both MF and GF but not by both TF and CF: CON, 0.559 a; MF, 0.452 b; GF, 0.432 b; TF, 0.561 a; CF, 0.564 a (SEM = 0.039; p = .005 (means of diet effect expressed as g/100 g total FA in RL). In contrast, C14iso was affected by all the polyphenol extracts tested in this trial: CON 0.694 a; MF 0.525 c; GF 0.477 d; TF 0.569 b; CF 0.601 b; SEM 0.033; p = .014 while C15iso and C16iso showed a selective sensitivity to the different feeds (C15iso: CON 6.235 b; MF 5.586 c; GF 7.059 a; TF 6.021 b; CF 5.151 c; SEM 0.349; p = .003; C16iso: CON 1.054 a; MF 0.862 b; GF 0.902 ab; TF 0.873 b; CF 1.132 a; SEM 0.0829; p = .001; means of diet effect expressed as g/100 g FA in RL).
Table 6. Fatty acid (FA) profile (g/100 g total fatty acid) at each sampling time (6, 12, 24 h).
The biohydrogenation pathway of linoleic acid (C18:2 c9, c12) and linolenic acid (C18:3 c9, c12, c15;) was affected differently by each kind of tannin. On average, the sources of hydrolisable tannins showed a higher content of the main dietary unsaturated fatty acids (linoleic and linolenic acid), particularly for the CF treatment (Table ). For the condensed tannin sources (MF and GF), the average content of linoleic and linolenic acid did not differ significantly from the values obtained for the CON treatment: linoleic acid, CON 8.989 c; MF 8.430 cd; GF 7.705 d; TF 9.145 b; CF 10.813 a; SEM = 0.511; p < .001; linolenic acid, CON 1.065 bc; MF, 1.166 bc; GF 0.959 c; TF 1.133 bc; CF 1.372 a; SEM = 0.100; p = .026; vaccenic acid, CON 1.866 c; MF 2.138 bc; GF 2.388 bc; TF 3.435 a; CF 2.283 bc; SEM = 0.497; p = .014.
The end product of the rumen biohydrogenation of unsaturated fatty acid (C18:0, stearic acid) was contained to a higher extent in the rumen liquor from CON, MF and GF compared with the CF treatment: SA, CON 28.952 b; MF 32.429 a; GF 34.059 a; TF 28.958 b; CF 23.430 c; SEM = 2.064; p < .001 (means of diet effect expressed as g/100 g total fatty acids in rumen liquor).
Interestingly, oleic acid (C18:1 c9) was affected by all the tannin extracts but not by CF: CON, 5.092 c; MF, 5.119 c; GF, 4.810 c; TF, 5.740 b; CF, 6.430 a; SEM = 0.282; p < .001 (means of diet effect expressed as g/100 g total fatty acids in rumen liquor).
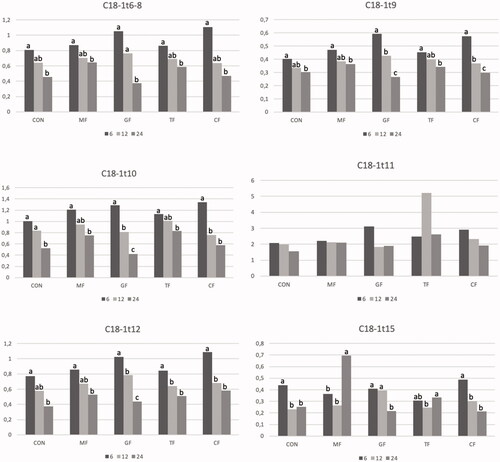
In the case of C18:1 t12 and C18:1 t16 (coeluted with C18:1 c14) the inclusion of tannins in the inoculum resulted in a higher content of these fatty acids compared with the CON treatment, irrespective to the kind of tannin adopted: C18:1 t12, CON, 0.575 c; MF, 0.6879 b; GF, 0.783 a; TF, 0.665 b; CF, 0.7490 a; SEM = 0.040; p < .001; C18:1 t16, CON, 0.351 bc; MF, 0.409 b; GF, 0.435 b; TF, 0.329 c; CF, 0.636 a; SEM = 0.082; p < .006; means of diet effect expressed as g/100 g total fatty acids in rumen liquor).
The content of the trans isomers of C18:1, which are considered as intermediates of the biohydrogenation of dietary unsaturated fatty acid (C18:1 t6-8; C18:1 t9; C18:1 t10; C18:1 t12; C18:1 t15), decreased during fermentation (Figure ).
Figure 1. Trend of main C18:1 isomers during the in vitro fermentation. Control feed (CON); Mimosa feed (MF) with 4 g/100 g DM of Mimosa tannin extract (from Acacia dealbata Link); Gambier feed (GF) with 4 g/100 g DM of Gambier tannin extract (from Uncaria gambir W. Hunter); Tara feed (TF) with 4 g/100 g DM of Tara tannin extract (from Casealpinia spinosa Molina Kuntze) and Chestnut feed (CF) with 4 g/100 g DM of Chestnut tannin extract (from Castanea sativa Mill.). Different letters (a, b, c) indicate significant differences for p <.05.
The main conjugated linoleic acid isomer (CLAc9, t11) and other minor linoleic acid isomers were not detected at any of the sampling times.
Eight different DMA were detected in the rumen liquor during the fermentation, irrespective of the treatment considered. The total amount of DMA ranged between 4% (TF treatment) and 5% (CON treatment) of the sum of fatty acids and DMA. DMA 16:0 was the most present in all treatments, representing from 55% (CF treatment) to 62% (GF treatment) of total DMA. Similarly to the fatty acids profile, DMA concentration did significantly vary considering the interaction effect Diet × Time. Conversely, the diet effect was significant for both total and individual DMA detected, with the exception of DMA 16:1.
The dietary sources of condensed tannins and hydrolysable tannins showed a similar total DMA content and composition compared with CON. On the other hand, the content of DMA 14:0, DMA 15:0 and DMA 18:0 was significantly lower in rumen liquor from TF (Tables and ).
Table 7. Profile of identified dimethylacetals (DMA) (g/100 g of total fatty acid + DMA) in rumen liquor samples at each sampling time (6. 12. 24 h).
Table 8. Profile of identified dimethylacetals (DMA) (g/100 g of total fatty acid + DMA) in rumen liquor samples as means of diet effect.
Discussion
Chestnut extract reduced methanogenesis without decreasing either the acetate syntheses or the C17:0 iso concentration, thus indicating that cellulolytic bacteria are probably not particularly affected by this kind of polyphenol (Dehority Citation2004; Vlaeminck et al. Citation2006). Similar results were found by Liu et al. (Citation2011) who evaluated the productive performances and rumen fermentation of dairy ewes fed with a diet supplemented with chestnut tannin, and by Jayanegara et al. (Citation2015) who found that methanogenesis was lower when feeds including chestnut tannin at three different concentrations (0.5, 0.75 and 1 mg/mL) were fermented in vitro.
Acetate is produced by bacteria during fibre degradation. The start point of the reaction is the conversion of pyruvate to acetilphosphate and formiate. Formiate is degraded into CO2 and H2 and is very toxic for microorganisms. Bacteria thus convert H2 into methane to protect themselves. Consequently, the decrease in methane emissions is often linked to a decrease in fibre rumen degradability. Interestingly, in our experiment, the methane produced was significantly lower when CF was fermented.
Our findings suggest that in our trial the fibre degradability was not decreased by chestnut tannin, thus preserving the efficiency of cellulolytic bacteria or stimulating alternate H2 sinks available in the microbial ecosystem of the rumen. This hypothesis is confirmed by the highest value of C17: 0iso concentration found in CF along with the fact that there was no negative effect on cellulolytic bacteria.
Acetate is a fundamental part of milk fat synthesis. Chestnut tannin extract thus represents an interesting opportunity in dairy ruminant feeding to improve the sustainability of productions. Although MF lowered methanogenesis, it decreased acetate and C17:0 iso productions, thus indicating a possible detrimental effect on cellulolytics. These data confirm that tannins in selectively modulating rumen processes.
Costa et al. (Citation2018) compared mimosa tannins with chestnut tannins and observed a reduced growth of cellulolytic bacteria with condensed tannins compared to hydrolysable tannins, which was gentler. The authors hypothesised that the higher level of depolymerisation in hydrolysable tannins plays a fundamental role in the rumen ecosystem (McSweeney et al. Citation1999). Due to possible detrimental effects of MF on cellulolytic bacteria, a decrease in C14:0 iso, C15:0 iso and C16:0 iso concentrations was observed (Vlaeminck et al. Citation2006; Buccioni et al. Citation2011).
In our study, tannins decreased the concentration of ammonia in each fermenter and at each time of fermentation, thus highlighting how tannins interfere with microorganism syntheses. Our data are in agreement with Mannelli et al. (Citation2018), who found a decrease in rumen protein degradation when tannins were added to feeds in vitro. In our trial, MF had the strongest effect, demonstrating once again that condensed tannins interfere the most with the protein metabolism of the rumen.
However, our data did not reveal whether the decrease in ammonia concentration was due to a direct detrimental effect on proteolytic bacteria or to the ability of tannins in complexing proteins, making them unavailable for rumen microorganism syntheses (Buccioni et al. Citation2017).
In our study, all the tannin extracts reduced biohydrogenation rate thus facilitating the accumulation of vaccenic acid and decreasing the stearic acid content. The same results were found by Carreño et al. (Citation2015) who compared different doses (20–40–60–80 g/kg of diet DM) of condensed (quebracho and grape) and hydrolysable tannins (chestnut and oak) in an in vitro trial.
Our findings confirmed the selective action of tannins on microbial activities. In terms of the effect of diet, CF decreased linoleic and linolenic acid hydrogenation but not the last step of this process. In contrast, the other feeds affected the conversion of vaccenic acid to stearic acid only, which seems to be the most sensitive to tannins.
The accumulation of vaccenic acid could be explained by hypothesising either a direct detrimental effect on microorganisms involved in the last step of the biohydrogenation processes or an inhibition of the enzymes involved in the double bound saturation. Similar results were reported in Buccioni et al. (Citation2015a, Citation2015b, Citation2017), who found that chestnut tannin extract inhibits Butyrivibrio proteoclasticum which converts vaccenic acid into stearic acid.
Several authors have demonstrated that there is still no clear understanding of the role of rumen microbial species in the biohydrogenation pathway nor about the microorganisms involved in these processes. What is, however, clear is that B. proteoclasticus does not play a dominant role in the rumen lipid metabolism and that other as-yet-uncultivated bacteria phylogenetically classified as Prevotella, Lachnospinaceae incertae sedis and unclassified Bacteroidales, Clostridiales and Ruminococcaceae might be more relevant (Boeckaert et al. Citation2008; Kim et al. Citation2008; Belenguer et al. Citation2010; Huws et al. Citation2010, Citation2011; Halmemies-Beauchet-Filleau et al. Citation2013; Castro-Carrera et al. Citation2014).
In our study, tannins did not carry out a protective action on C18:2 cis9 trans11. In fact, no trace of this fatty acid was detected, indicating that there may have been a complete hydrogenation within 6 h.
Chestnut tannin may have induced the accumulation of oleic acid due to a decrease in the biohydrogenation rate of cis9 double bound or to a decrease in its isomerisation (Mosley et al. Citation2002).
Our results showed that the total amount of DMAs did not vary across the treatments, in accordance with Cappucci et al. (Citation2018) who used different doses of olive crude phenolic concentrate in the diet of dairy ewes. We found that DMA 16:0 was the most present in all the treatments, in accordance with the results reported by Alves et al. (Citation2013) and our previous study (Cappucci et al. Citation2018).
All DMAs, with the exception of DMA 16:1, were affected by diet, but the Diet × Time effect did not show any significant differences in the DMA profile among fermenters, suggesting that the tannins tested in our trial did not induce great perturbation in rumen microbiota.
Conclusions
In our trial, commercial doses of MF, GF, TF and CF were tested. All the extracts affected ammonia production, methanogenesis, and the production of fatty acids. We thus conclude that incorporating chestnut tannins into the CF diet improves the sustainability of ruminant rearing since it lowers methanogenesis and ammonia production without compromising the synthesis of acetate.
Disclosure statement
No potential conflict of interest was reported by the author(s).
Ethical approval
Animals were handled according to the guidelines of Italian law on animal welfare for experimental animals (Italian Ministry of Health 2014).
References
- Achmadi SS. 2019. Chapter 5: Polyphenols resources in Indonesia from economic perspective. In: Watson RR, editor. Polyphenols in plant: isolation, purification and extract preparation. 2nd ed. London (UK): Academic Press; p. 67–79.
- Alves SP, Santos-Silva J, Cabrita AR, Fonseca AJ, Bessa RJ. 2013. Detailed dimethylacetal and fatty acid composition of rumen content from lambs fed lucerne or concentrate supplemented with soybean oil. PloS One. 8:e58386.
- Angelidaki I, Alves M, Bolzonella D, Borzacconi L, Campos JL, Guwy AJ, Kalyuzhnyi S, Jenicek P, van Lier JB. 2009. Defining the biomethane potential (BMP) of solid organic wastes and energy crops: a proposed protocol for batch assays. Water Sci Technol. 59:927–934.
- AOAC International. 1995. Official methods of analysis. Gaithersburg (MD): AOAC International.
- Belenguer A, Toral PG, Frutos P, Hervás G. 2010. Changes in the rumen bacterial community in response to sunflower oil and fish oil supplements in the diet of dairy sheep. J Dairy Sci. 93:3275–3286.
- Boeckaert C, Vlaeminck B, Fievez V, Maignien L, Dijkstra J, Boon N. 2008. Accumulation of trans C18:1 fatty acids in the rumen after dietary algal supplementation is associated with changes in the Butyrivibrio community. Appl Environ Microbiol. 74:6923–6930.
- Buccioni A, Cappucci A, Mele M. 2014. Methane emission from enteric fermentation: methanogenesis and fermentation. In: Sejian V, Gaughan J, Baumgard L, Prasad C, editors. Climate change impact on livestock: adaptation and Mitigation. New Delhi (India): Springer; p. 171–187.
- Buccioni A, Minieri S, Rapaccini S, Antongiovanni M, Mele M. 2011. Effect of chestnut and quebracho tannins on fatty acid profile in rumen liquid- and solid-associated bacteria: an in vitro study. Animal. 5:1521–1530.
- Buccioni A, Pallara G, Pastorelli R, Bellini L, Cappucci A, Mannelli F, Minieri S, Roscini V, Rapaccini S, Mele M, et al. 2017. Effect of dietary chestnut or quebracho tannin supplementation on microbial community and fatty acid profile in the rumen of dairy ewes. Biomed Res Int. 2017:4969076.
- Buccioni A, Pauselli M, Viti C, Minieri S, Pallara G, Roscini V, Rapaccini S, Trabalza Marinucci M, Lupi P, Conte G, et al. 2015a. Milk fatty acid composition, rumen microbial population, and animal performances in response to diets rich in linoleic acid supplemented with chestnut or quebracho tannins in dairy ewes. J Dairy Sci. 98:1145–1156.
- Buccioni A, Serra A, Minieri S, Mannelli F, Cappucci A, Benvenuti D, Rapaccini S, Conte G, Mele M. 2015b. Milk production, composition, and milk fatty acid profile from grazing sheep fed diets supplemented with chestnut tannin extract and extruded linseed. Small Rumin Res. 130:200–207.
- Burns RE. 1963. Methods of tannin analysis for forage crop evaluation. Technical bullettin number 32. Athens (GA): Georgia Agricultural Experiment Station.
- Cappucci A, Alves SP, Bessa RJB, Buccioni A, Mannelli F, Pauselli M, Viti C, Pastorelli R, Roscini V, Serra A, et al. 2018. Effect of increasing amounts of olive crude phenolic concentrate in the diet of dairy ewes on rumen liquor and milk fatty acid composition. J Dairy Sci. 101:4992–5005.
- Carreño D, Hervás G, Toral PG, Belenguer A, Frutos P. 2015. Ability of different types and doses of tannin extracts to modulate in vitro ruminal biohydrogenation in sheep. Anim. Feed Sci. Technol. 202:42–51.
- Castro-Carrera T, Toral PG, Frutos P, McEwan NR, Hervás G, Abecia L, Pinloche E, Girdwood SE, Belenguer A. 2014. Rumen bacterial community evaluated by 454 pyrosequencing and terminal restriction fragment length polymorphism analyses in dairy sheep fed marine algae. J Dairy Sci. 97:1661–1669.
- Christie WW. 1982. A simple procedure for rapid transmethylation of glycerolipids and cholesteryl esters. J Lipid Res. 23:1072–1075.
- Costa M, Alves SP, Cappucci A, Cook SR, Duarte A, Caldeira RM, McAllister TA, Bessa RJB. 2018. Effects of condensed and hydrolyzable tannins on rumen metabolism with emphasis on the biohydrogenation of unsaturated fatty acids. J Agric Food Chem. 66:3367–3377.
- Dehority BA. 2004. Rumen microbiology. Nottingham (UK): Nottingham University Press.
- FAO. 2009. Food security and agricultural mitigation in developing countries: options for capturing synergies. Rome (Italy): FAO. www.fao.org/docrep/012/i1318e/i1318e00.pdf
- Folch J, Lees M, Sloane Stanley GH. 1957. A simple method for the isolation and purification of total lipids from animal tissue. J Biol Chem. 226:497–509.
- Halmemies-Beauchet-Filleau A, Kairenius P, Ahvenjärvi S, Crosley LK, Muetzel S, Huhtanen P, Vanhatalo A, Toivonen T, Wallace RJ, Shingfield KJ. 2013. Effect of forage conservation method on ruminal lipid metabolism and microbial ecology in lactating cows fed diets containing a 60:40 forage-to-concentrate ratio. J Dairy Sci. 96:2428–2447.
- Huang Q, Liu X, Zhao G, Hu T, Wang Y. 2018. Potential and challenges of tannins as an alternative to in-feed antibiotics for farm animal production. Anim Nutr. 4:137–150.
- Huws SA, Kim EJ, Lee MRF, Scott MB, Tweed JKS, Pinloche E, Wallace RJ, Scollan ND. 2011. As yet uncultured bacteria phylogenetically classified as Prevotella, Lachnospiraceae incertae sedis and unclassified Bacteroidales, Clostridiales and Ruminococcaceae may play a predominant role in ruminal biohydrogenation. Environ Microbiol. 13:1500–1512.
- Huws SA, Lee MRF, Muetzel SM, Scott MB, Wallace RJ, Scollan ND. 2010. Forage type and fish oil cause shifts in rumen bacterial diversity. FEMS Microbiol Ecol. 73:396–407.
- Italian Ministry of Health. 2014. Legislative Decree 4 March 2014, n. 26 Implementation of Directive 2010/63/EU on the protection of animals used for scientific purposes (14G00036) (GU General Series n.61 of 14-03-2014).
- Jayanegara A, Goel G, Makkar HPS, Becker K. 2015. Divergence between purified hydrolysable and condensed tannin effects on methane emission, rumen fermentation and microbial population in vitro. Anim Feed Sci Technol. 209:60–68.
- Jenkins TC. 2010. Technical note: Common analytical errors yielding inaccurate results during analysis of fatty acids in feed and digesta samples. J Dairy Sci. 93:1170–1174.
- Kim EJ, Huws SA, Lee MRF, Wood JD, Muetzel SM, Wallace RJ, Scollan ND. 2008. Fish oil increases the duodenal flow of long chain polyunsaturated fatty acids and trans-11 18:1 and decreases 18:0 in steers via changes in the rumen bacterial community. J Nutr. 138:889–896.
- Kramer JK, Fellner V, Dugan ME, Sauer FD, Mossoba MM, Yurawecz MP. 1997. Evaluating acid and base catalysts in the methylation of milk and rumen fatty acids with special emphasis on conjugated dienes and total trans fatty acids. Lipids. 32:1219–1228.
- Licitra G, Hernandez TM, Van Soest PJ. 1996. Standardization of procedures for nitrogen fractionation of ruminant feed. Anim Feed Sci Technol. 57:347–358.
- Liu H, Vaddella V, Zhou D. 2011. Effects of chestnut tannins and coconut oil on growth performance, methane emission, ruminal fermentation, and microbial populations in sheep. J Dairy Sci. 94:6069–6077.
- Mannelli F, Cappucci A, Pini F, Pastorelli R, Decorosi F, Giovannetti L, Mele M, Minieri S, Conte G, Pauselli M, et al. 2018. Effect of different types of olive oil pomace dietary supplementation on the rumen microbial community profile in Comisana ewes. Sci Rep. 8:8455.
- McDougall EI. 1948. Studies on ruminant saliva. The composition and output of sheep’s saliva. Biochem J. 43:99–109.
- McSweeney CS, Palmer B, Bunch R, Krause DO. 1999. Isolation and characterization of proteolytic ruminal bacteria from sheep and goats fed the tannin-containing shrub legume Calliandra calothyrsus. Appl Environ Microbiol. 65:3075–3083.
- Mosley EE, Powell GL, Riley MB, Jenkins TC. 2002. Microbial biohydrogenation of oleic acid to trans isomers in vitro. J Lipid Res. 43:290–296.
- Patra AK, Saxena J. 2011. Exploitation of dietary tannins to improve rumen metabolism and ruminant nutrition. J Sci Food Agric. 91:24–37.
- Ragaglini G, Dragoni F, Simone M, Bonari E. 2014. Suitability of giant reed (Arundo donax L.) for anaerobic digestion: effect of harvest time and frequency on the biomethane yield potential. Bioresour Technol. 152:107–115.
- Ramos-Morales E, Arco-Pérez A, Martín-García AI, Yáñez-Ruiz DR, Frutos P, Hervás G. 2014. Use of stomach tubing as an alternative to rumen cannulation to study ruminal fermentation and microbiota in sheep and goats. Anim Feed Sci Technol. 198:57–66.
- Salami S, Valenti B, Bella M, Grady M, Luciano G, Kerry J, Jones E, Priolo A, Newbold C. 2018. Characterization of the ruminal fermentation and microbiome in lambs supplemented with hydrolysable and condensed tannins. FEMS Microbiol Ecol. 94.
- Valenti B, Natalello A, Vasta V, Campidonico L, Roscini V, Mattioli S, Pauselli M, Priolo A, Lanza M, Luciano G. 2019. Effect of different dietary tannin extracts on lamb growth performances and meat oxidative stability: comparison between mimosa, chestnut and tara. Animal. 13:435–443.
- Van Soest PJ, Robertson JB, Lewis BA. 1991. Methods for dietary fiber, neutral detergent fiber, and nonstarch polysaccharides in relation to animal nutrition. J Dairy Sci. 74:3583–3597.
- Vasta V, Daghio M, Cappucci A, Buccioni A, Serra A, Viti C, Mele M. 2019. Invited review: plant polyphenols and rumen microbiota responsible for fatty acid biohydrogenation, fiber digestion, and methane emission: experimental evidence and methodological approaches. J Dairy Sci. 102:3781–3804.
- Vasta V, Yáñez-Ruiz DR, Mele M, Serra A, Luciano G, Lanza M, Biondi L, Priolo A. 2010. Bacterial and protozoal communities and fatty acid profile in the rumens of sheep fed a diet containing added tannins. Appl Environ Microbiol. 76:2549–2555.
- Vlaeminck B, Fievez V, Demeyer D, Dewhurst RJ. 2006. Effect of forage:concentrate ratio on fatty acid composition of rumen bacteria isolated from ruminal and duodenal digesta. J Dairy Sci. 89:2668–2678.
- Weatherburn MW. 1967. Phenol-hypoclorite reaction for determination of ammonia. Anal Chem. 39:971–974.