
 ?Mathematical formulae have been encoded as MathML and are displayed in this HTML version using MathJax in order to improve their display. Uncheck the box to turn MathJax off. This feature requires Javascript. Click on a formula to zoom.
Abstract
The study aimed to evaluate the most predictive traits of fresh maize and the most appropriate multivariate approach for estimating silage fermentation quality. The use of near infrared (NIRs) instruments allowed rapid, accurate and cheap analysis. Samples of fresh maize plant (n = 822) from hybrids (Class Cultivar) of early and late classes, were harvested at three maturity stages: early, medium and late, in three areas (level input field) of ‘low’, ‘medium’ and ‘high’ soil fertility, along three consecutive years. Several algorithms of feature selection, regression, classification and machine learning, were tested. Maize silage fermentative quality was summarised through a Fermentative Quality Index (FQI). We found the most predictive traits as dry matter (DM), starch, and acid detergent lignin (ADL), with negative coefficients, or water-soluble carbohydrates (WSC) with a positive coefficient. FQI was significantly (p < 0.0001) affected by year (negatively for 2018), level input field (positively for high level) and maturity stage (negatively for the late harvest). The most satisfying results were attained using a stepwise regression algorithm (R2 = 0.48), improved by the introduction of fixed effects (R2 = 0.55) and partial least square discriminant analysis (PLS-DA), which was assessed through the Mattew Correlation Coefficient (MCC) in validation (MCC = 0.57). Concluding, among the tested approaches, the use of linear regression after stepwise algorithm or the use of PLS could be of practical help for the farmers to the effective management of the ensiling process of maize plants, even though environmental conditions should be considered to improve the predictions.
The prediction of FQ at harvest would allow the farmer to tune up the ensiling process
The prediction of FQ through the use of portable NIRs instruments was successful
DM, starch and ADL were negatively related to FQ index
HIGHLIGHTS
Introduction
In the context of dairy farming, efforts are being made to increasingly combine the production and economic needs of farmers with those of reducing the environmental impact, for greater sustainability (Britt et al. Citation2018). A possible unifying element between these needs is represented by the improvement of production efficiency (Connor Citation2015), which is however difficult to achieve due to the extreme variability that characterises the composition and quality of the ration, animals, environment and farm management. Feed quality, which includes nutrient composition (Krämer-Schmid et al. Citation2016), digestibility, absence of contamination (Driehuis Citation2013), fermentation quality (Kung et al. Citation2018) and even the homogeneity of the ration (Marchesini et al. Citation2020), can vary over time and between different batches of feed, silo-bunkers and even between different areas within the same silo-bunker (Gallo, Bertuzzi, et al. Citation2016).
To limit this variability and always guarantee the animals a high quality ration, it is necessary to frequently measure feed characteristics as recommended within the view of precision feeding (Wathes et al. Citation2008; Mottram Citation2016). In this regard, repeated measures are made feasible by the use of Near Infra-red spectroscopy (NIRs) technique, a type of analysis that is more and more extensively adopted in agriculture (Fernández-Ahumada et al. Citation2008) for its low costs, high speed and ease of use and for the availability of portable devices which allow performing the analyses in real-time at field level (Marchesini et al. Citation2017; Harris et al. Citation2018). Among the ingredients used in the ration of dairy cows, maize silage is one of the most important (Grant and Adesogan Citation2018) and is characterised by a great variability both in composition and fermentation quality (Grant and Ferraretto Citation2018; Marchesini et al. Citation2019), which if not adequate, could reduce DM intake (DMI) and production (Gerlach et al. Citation2013) and lead to poor health (Borreani et al. Citation2008).
Fermentation quality of maize silage is assessed by the value of pH of the ensiled mass and the concentration of a complex array of compounds, such as lactic, acetic, propionic and butyric acids, alcohols and esters (Kung et al. Citation2018) and can be summarised by a fermentation quality index (FQI), as reported by Andrighetto et al. (Citation2018). Because the fermentation products present in the silage are strongly affected by the characteristics of the fresh ensiled plant, such as dry matter (DM) content, protein, fibre, N-free extract and water-soluble carbohydrates (WSC) (Archibald et al. Citation1960; Kung et al. Citation2018), it should be possible predicting the fermentation quality of silage starting from the characteristics of the fresh plant. This possibility would allow the farmer to comprehend the ensiling attitude of fresh maize plants at the time of harvest and decide how to tune up the ensiling process adopting suitable choices, such as by consciously delaying the harvesting period to reach maturity and the ideal composition (Filya Citation2004; Xie et al. Citation2012) or for example, by the proper choice of inoculants (Wilkinson and Davies Citation2013). Since the use of multiple parameters to assess the silage quality requires a multivariate approach, which has already been proved useful in characterising silage conservation methods, post-ensiling composition, digestibility, and fermentation traits as well (Gallo, Bertuzzi et al. Citation2016; Gallo, Giuberti et al. Citation2016), this study aimed to evaluate the best fitting multivariate approach, compared with the multiple linear regression, to predict the potential of maize silage fermentation quality based on the chemical composition of harvested fresh whole maize plants.
Materials and methods
Experimental design
Data were collected in the harvest season among three consecutive years (2016, 2017 and 2018) from maize cultivated in the Veneto Region (Northeast Italy), using a total of 37 maize hybrids of early (FAO class 200, n = 19) and late (FAO class 600–700, n = 18) ripening classes, as reported: in 2016, 14 early and 15 late; in 2017, seven early and eight late; in 2018, five early and five late. The average yield per hectare was 23.5, 22.3 and 24.0 tons for the years 2016, 2017 and 2018, respectively. In 2016 each hybrid was harvested in three plots, corresponding to three areas (level input field) defined by different pedoclimatic characteristics. Each area was characterised by an average yield that could be referred to as soils of ‘low’ (medium-heavy soil with an average production of 496 q/ha), ‘medium’ (medium-light soil with an average production of 543 q/ha) and ‘high’ fertility (clay soil with an average production of 686 q/ha). In 2017 and 2018, the trial was performed only in ‘medium’ and ‘high’ productivity plots. Per each plot, every hybrid was harvested twice in two different subplots. Each hybrid was sown in both subplots in a land area of 4 rows × 10 plants. In total, 40 plants were grown per hybrid and subplot. In the main plot field, some external rows of generic seeds have been sown and excluded from the trial. In the core of the field, early and late hybrid were sown at precise densities to maximise the production, corresponding to 95,000 and 70,000 plants/ha, respectively. Corn silage was manually harvested at a stubble height of approximately 20 cm, and chopped at a theoretical length-of-cut of 20.0 mm by the means of a self-propelled forage harvester. Per each plot and subplot, plants were harvested at three maturity phases: early (EH, 1/3 milk line phase), medium (MH, at 2/3 milk line phase) and late (LH, 5 d after the 2/3 milk line phase). Per each plot, subplot and maturity phase, about five plants were harvested, chopped and mixed to obtain one sample. Each sample was split into two subsamples. Any processing and NIRs analysis were executed with two scans on subsamples, but averages of scans and subsamples were performed before statistical analysis was performed.
The number of samples collected per each year was 522 (29 hybrids × 3 plots × 2 subplots × 3 maturity phases), 180 (15 hybrids × 2 plots × 2 subplot × 3 maturity phases) and 120 (10 hybrids × 2 plots × 2 subplots × 3 maturity phases), for 2016, 2017 and 2018, respectively.
Fixed effects considered were: growing area (3 levels), maturity phase (3 stages), ripening class (2 classes) and year (3 years).
Sample collection, preparation and analysis
To prevent possible modifications resulting from respiration activity, pre-ensiling subsamples were immediately collected after harvesting and placed in a large vessel, which could hold about 1.5–2.0 kg of fresh product. Each subsample was scanned twice using a portable NIRs system (poliSPECNIR, ITPhotonics, Breganze, Italy), and each scan was of 10 s (with an integration time of about 10ms). Thus, the within-sample variability was mostly acquired. Subsamples (n = 1644) were suddenly ensiled in vacuum-packed bags (Orved 2633040, Orved SpA, Musile di Piave, VE, Italy) as described by Andrighetto et al. (Citation2018) and stored in a dark room at 23 °C for 60 days (Marchesini et al. Citation2019). Post-ensiling subsamples were scanned twice by the use of a FOSS NIRSysistem 5000 scanning monochromator (FossNIR-System, Hillerød, Denmark) and predicted using the calibration curve as previously reported by Andrighetto et al. (Citation2018). From the analysis results, a fermentation quality index (FQI) was calculated according to what was reported by Andrighetto et al. (Citation2018) for quality index I1. The FQ index is a lab-scale quality index designed for the evaluation of maize silage fermentation results. The FQI was intended to evaluate the maize silage fermentation quality upon weighted scores assigned according to the main fermentative parameters’ values. The FQI index has a range of values from 1 to 100, where all the samples higher than a cut-off limit set at 57.4 (Andrighetto et al. Citation2018), were classified as excellent quality (EQ), while the remaining were considered as not excellent quality (NEQ), obtaining a classification variable for FQI (FQIc).
NIRs instruments and calibrations
A poliSPECNIR Near Infra-red system, together with a robust calibration curve was used to analyse DM, ash, crude protein (CP), ether extract (EE), neutral detergent fibre (aNDF), acid detergent fibre (ADF), acid detergent lignin (ADL), WSC and starch on fresh harvested pre-ensiling subsamples. Calibration performances are reported in Table . A FOSS NIRSystem 5000 scanning monochromator with the same calibration described by Andrighetto et al. (Citation2018), built with the use of a large dataset (n = 2098), was used to analyse post-ensiling subsamples. The reference methodologies used to calibrate both the NIRs instruments were: #934.01 (AOAC Citation2003) for DM, 2001.11 (AOAC Citation2005) for CP, #942.05 (AOAC Citation2003) for ash; #996.11 (AOAC Citation2000) for starch, 2003.05 (AOAC Citation2006) for EE; ANKOM Technology (Citation2015a) for aNDF; ANKOM Technology (Citation2015b) for ADF; Akon-Technology (Citation2020) for ADL; and Charles (Citation1981) for WSC. The ammonia was analysed according to Megazyme’s assay procedure (Megazyme Citation2014) and pH as proposed by Martillotti et al. (Citation1987) methods 1.5 − 18, and Playne and McDonald (Citation1966). The volatile fatty acids and lactate, ethanol and mannitol were examined according to the method proposed by Martillotti and Puppo (Citation1985) and described in Andrighetto et al. (Citation2018).
Table 1. Specifications of the calibration curve used for fresh harvested pre-ensiling maize (n = 205), by the use of a poliSPECNIR near infrared system.
Statistical analysis
In this study, the authors tested many different multivariate approaches by the use of different software for data computation. Thought approaches are intended to describe the pre-ensiling dataset and the relation of the latter traits with the FQI and FQIc. The post-ensiled dataset is presented merely for the calculation of the FQI and to describe the traits of the silages. A resuming graphical scheme for multivariate approaches is reported in the Supplementary Material Figure .
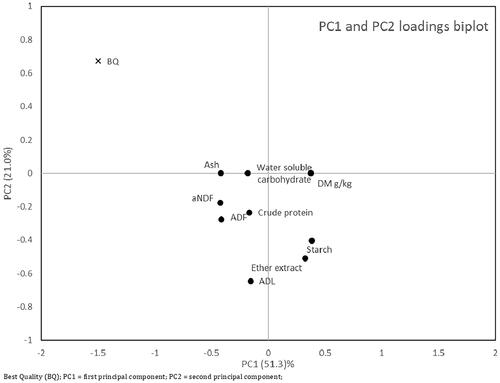
Figure 1. PC1 and PC2 biplot from PCA algorithm.
Preliminary investigation
A preliminary investigation was conducted on the proximate composition database of both pre-ensiling and post-ensiling subsamples, by the use of R (R version 3.5.3 (2019-03-11). To assess the normality of the data the Shapiro–Wilk test (>0.9 = normally distributed) was applied. The same datasets were submitted to a descriptive analysis to evaluate Minimum, Maximum, Mean and Standard Deviation values. With the use of SAS release 9.4 (SAS Institute Inc., Cary, NC 2012), an ANOVA model was applied including hybrid ripening class (two levels: early and late), input level fields (three levels: low, medium and high), maturity phase at harvest (three levels: EH, MH, and LH) as fixed effects. Post-hoc pairwise comparisons were run between factor levels using Bonferroni correction. The assumptions of the linear model on the residuals were graphically tested.
As a preliminary investigation of the pre-ensiled traits dataset and its relations with the quality outcomes, a graphical plot of the feature space is useful to understand its structure. Principal Component Analysis (PCA) is an unsupervised technique merely considering the link between the predictors, without considering any classification factor. PCA permits, by the calculation of an orthogonal transformation, a preliminary exploration of data (Kim and Kim Citation2012), decreasing the original pool of correlated variables into a reduced number of uncorrelated components. PCA allows increasing the dataset interpretability with a few losses of information (Jolliffe et al. Citation2016). One of the significant advantages of PCA is the possibility to accomplish a biplot graphical representation of the multivariate dataset. Data were submitted to the pre-process ‘centering’ and ‘scaling.’
Features selection
The Authors applied a features selection to identify the most predictive variables able to discriminate between the FQIc or to estimate FQI continuous variables.
Random Forest is a popular ML algorithm characterised by a typically easy interpretability. Unlike PCA, the Random Forest considers the information between feature values and the target class. Moreover, the Random Forest does not require the assumption of normality. From another point of view, it is useful to select the relevant attributes to solve the problem of finding the only relevant ones, instead of merely the non-redundant. One of the primary objectives of RF is to avoid a decrease in accuracy when too many variables are present, and their number is significantly higher than optimal (Kursa Citation2010).
A Random Forest (RF) feature selection procedure, based on the Boruta algorithm (Kursa Citation2010), was applied to pre-ensiling corn composition parameters. Such algorithms operate through a wrapper approach built around a Random Forest classifier, in order to achieve the best discrimination for the FQIc, by maximising the distance among EQ Vs. NEQ groups.
Regression algorithms
The use of ‘createDataPartition’ of ‘caret’ package (Kuhn Citation2008) in R, splits the original pre-ensiling dataset in training (training = 70%) and testing (testing = 30%), keeping the proportion of the FQIc classes, for further utilisation.
A stepwise algorithm, with the use of SAS (PROC REG), performed as a feature selection procedure applied to pre-ensiling corn composition parameters, allowed to estimate linear regression relating the predictors to the FQI variable. Such a stepwise algorithm, computed on the training dataset, has furtherly been validated with the testing dataset. The coefficient of determination (R2v) and the standard error (SEv) in validation were calculated as indicators of the goodness of the prediction procedure, applying the linear regression coefficient, estimated in the training set, to the samples of the testing dataset. To evaluate the effects of harvesting conditions, a ‘reduced’ dataset with only three hybrids (n = 1 early, n = 2 late), harvested in the 3 years (2016, 2017 and 2018), and the two fields (high and medium input field), in total 108 subsamples, was evaluated for FQI in the STEPWISE algorithm. The fixed effects were previously converted to dummy variables.
Partial Least Square regression (PLS) is a technique that combines the feature selection, as for the PCA, and the computation of a linear regression algorithm (Cui and Fearn Citation2017). Moreover, PLS allows good data interpretability, such as by the use of the Variable Importance in Projection (VIP) (Mehmood et al. Citation2012; Ottavian et al. Citation2015). A PLS was computed by the use of Matlab R2017a (software V9.2.0.538062, The MathWorks Inc., Natick, MA) and PLS Toolbox (PLS Toolbox V5.8.2.1, Eigenvector Research Inc., Manson WA) in the pre-ensiling dataset and evaluated by cross-validation (Venetian blinds w/10 splits and two samples per split), for the predictions of the FQI. The coefficient of determination in cross-validation (R2cv) and the standard error in cross-validation (SEcv) measured the reliability of the regression method on the training dataset and, furtherly, tested on the testing dataset (R2v = coefficient of determination in validation; SEv = standard error in validation), by comparing the Predicted Vs the Actual FQI values. The number of the latent variable used to perform the PLS was chosen by minimising the Root Mean Square Error in Cross-Validation (RMSEcv). Variable importance in projection (VIP) index was calculated to underlie the most critical parameters in the regression (Ottavian et al. Citation2014).
Classification algorithms
Using a preliminary stepwise discriminant analysis (PROC STEPDISC, SAS) performed as a features selection algorithm, a canonical discriminant analysis (PROC CANDISC, SAS) was applied as a classification algorithm for FQIc in the dataset (822 samples, 25 incomplete records removed). The predictive variables used were the pre-ensiling maize composition parameters. In this case, three classes for FQIc were calculated, and the thresholds were chosen as silages with FQI < 47.7 are classified as ‘lower’ quality silage, silages whit 47.7 ≤ FQI < 57.4 are ‘good’ quality silage, and for those with FQI ≥ 57.4 are classified as ‘excellent’ quality silage. The use of Wilks’ λ and approximately F evaluated performances of the algorithm, as well as the squared Mahalanobis distances (D2-Mahalanobis), showed the degree of dissimilarity among FQI classification (Bisutti et al. Citation2019). Outcomes of the canonical discriminant analysis (CDA) are plotted according to the two main canonical functions CAN1 and CAN2. For each sample, the Mahalanobis Distances from the coordinates of the geometric centre of each group (lower, good, excellent) were calculated, and as a result, three values per sample were obtained. The lower of the three values indicated the assigned group. In such a way, it was built a confusion matrix. As for stepwise regression, the performance of the approach in CDA for FQIc was tested in a reduced dataset (101 samples, 7 incomplete records removed).
Partial Least Square Discriminant Analysis (PLS-DA) (Barker and Rayens Citation2003) is a chemometric classification based on the PLS algorithm. PLS-DA is an adaptation of PLS regression methods to solve the problems of supervised clustering, used to sharpen the separation between groups of observations. Using MATLAB and PLS Toolbox, PLS-DA for FQIc, after autoscaling of data, was evaluated by cross-validation (Venetian blinds w/10 splits and 2 samples per split) on the training dataset and furtherly tested on the testing dataset. The PLS-DA model was evaluated by the sensitivity, specificity, accuracy, precision, and Matthews Correlation Coefficient (MCC) as they are defined in (Bisutti et al. Citation2019).
Machine learning approaches
Referring to the pre-ensiling dataset and using the aforementioned classification for FQIc, the Machine Learning technique was tested.
The Support Vector Machine (SVMs) is a powerful technique for classification (James et al. Citation2013). An SVMs was modelled by the use of package ‘caret’ (Kuhn Citation2008) on R software, through both the svmLinear and svmRadial kernel, and applied on the training dataset with repeated cross-validation (setting in number = 10 and repeats = 5). C-value (Cost) in the Linear classifier was customised by inputting values in a grid search. Even testing the Radial Basis Function sigma was customised, adopting a grid search. Before training the SVMs model, both pre-process ‘centering’ and ‘scaling’ were applied to the training dataset. After training the SVMs model, a validation was explored on the testing dataset by the use of the ‘predict method’ for calculating results. A confusion matrix allowed evaluating the accuracy, sensitivity, specificity and MCC of the method.
K-Nearest Neighbours (KNN) is a classification method whose principle is to predict a class for a given test observed by attributing the class of the K-nearest observed sample (James et al. Citation2013). The idea behind KNN is to identify the closest K point in the training dataset to the tested sample, where K point is a positive integer. Finally, KNN classifies the tested sample to the class with the most considerable probability. In R, with the use of the package ‘caret’, the KNN method was tested after applying ‘centering’ and ‘scaling’ to the training dataset, with repeated cross-validation (setting number = 10 and repeats = 5). After training the KNN, the model was applied to the testing dataset by the use of the ‘predict method’ to obtain the results. A confusion matrix is allowed to evaluate the accuracy, sensitivity, specificity and MCC of the method.
Results
Dataset
The traits of the pre-ensiling and post-ensiling datasets are reported in Tables and . Datasets included the results of analyses made on whole fresh maize plants harvested in the years 2016 (Marchesini et al. Citation2019), 2017 and 2018 (Table ) and on post-ensiling samples (Table ). All parameters, except for glucose, propionic and butyric acids, have a Shapiro test (w) value higher than 0.9. To better describe the dataset, the ANOVA analysis for FQIc is reported in Table . The main fixed effects (years, level input field and maturity) are significant.
Table 2. Specifications of the fresh whole corn plant, pre-ensiling dataset.
Table 3. Specifications of the post-ensiled dataset.
Table 4. Fermentation quality index (FQI) of maize silage belonging to different FAO classes (class 200 vs. class 600–700), grown in different yield potential areas (low vs. medium vs. high) and harvested at different Maturity (early, EH vs. medium, MH vs. late, LH).
Preliminary investigation
The proximate composition of the fresh whole corn plant was submitted to an ANOVA including FQIc (EQ Vs. NEQ) as a fixed effect (Table ). It appears that all chemical parameters significantly differ for the two levels of FQIc. Ash, CP, aNDF, ADF and WSC show higher values in EQ, whereas the remaining parameters show higher values in NEQ.
Table 5. Composition of the fresh whole plant maize belonging to different FQI classes (NEQ, EQ).
Figure reports the biplot of the PCA loadings. By visual inspection of PCA loadings biplot and regarding FQc, EQ coordinates are nearby to ash, aNDF and WSC loadings coordinates. The total variance explained by the two main components accounts for 72%.
Features selection
In this study, as a result of applying RF for FQIc, all nine components are confirmed as necessary, and the Z scores were, in order of importance: DM (34.5), ADL (30.3), EE (23.6), Starch (20.4), WSC (19.3) Ash (18.7), ADF (15.3), CP (14.8) and aNDF (13).
Regression algorithms
The previous investigation did not identify clearly the most useful variables for predicting FQIc or FQI. Conversely, RF suggests that all features should be used.
Stepwise regression in SAS was performed within the training set (Table ) and then validated on the testing set. FQI regression used a negative coefficient for DM, ADL and starch and a positive coefficient for Ash, EE and aNDF, R2 = 0.48. In validation, FQI produced an R2v = 0.42.
Table 6. Results of stepwise regression of constituents for FQI: estimated regression coefficients, intercept of the model and P (R2 = 0.48 for the training dataset and 0.55 for reduced dataset).
Regression coefficients for the reduced dataset are reported in Table ; fixed effects (growing area, maturity phases and years) resulted statistically significant in the regression.
Using MATLAB and PLS Toolbox, a PLS regression for FQI was calculated on the training set, X data were autoscaled. Regression results were R2cv = 0.44 and SEcv = 7.11. Selecting 4 PC (captured variance for PC1 = 49.7%, for PC2 = 7. 93%, PC3 = 7.93% and PC4 = 4.49%) and applying the regression to the testing set, resulted in Rv2 = 0.42 and SEv = 7.26. Variables with VIP > 1, considered significant, are DM (1.40), Ash (1.01), EE (1.21) and Starch (1.25). Regression coefficient were DM = −0.53, Ash = 0.005, EE = 0.003, Starch = −0.092.
Classification algorithms
A CDA allowed a Can1 and Can2 bi-plot chart (Figure ). The STEPDISC procedure selected DM, Ash, CP, ADL and Starch for FQIc. The canonical functions showed a low discriminative power (Wilk’ λ = 0.60 with p < 0.0001, approximate F value = 45.5 and 1.87, df1 = 10 and 4, df2 = 1580 and 791, p < 0.0001 and 0.114 for Can1 and Can2, respectively). D2-Mahalanobis distance between means = 1.35, 4.33 and 0.91, p < 0.0001 for comparison of classes lower vs. Good, lower vs. Excellent and good Vs. Excellent, respectively. The Can1 accounted for 98.6% and Can 2 accounted for 1.40% of the variability. For FQIc 69, 46 and 69% of correct attributions were for the three-class FQI lower, good and excellent silage, respectively (Table ).
Figure 2. scatter plot for the outcomes of the CDA (Can1 and Can2) for the samples of the original dataset, considering the three classes for FQIc. (A) Green filled area = ‘lower’; red filled area = ‘good’; blue filled area = ‘excellent’. (B) Green filled area = ‘lower’; red filled area = ‘good or excellent’. Ellipses represent a 95% confidence interval.
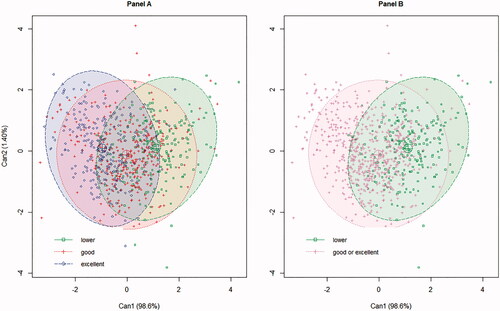
Table 7. Confusion matrix for CDA in the original dataset (n = 797, 25 incomplete records removed) and in the reduced dataset (n = 101, 7 incomplete records removed) for FQIc, classified in three levels.
However, as many samples are confused between ‘excellent’ and ‘good’ classes, they may be joint in one ‘overall’ class that can be opposed to the ‘lower silage’ class (Figure , panel B). In the latter case, correct attributions were 69 and 83% for ‘lower silage’ and ‘overall’ classes for FQIc, respectively.
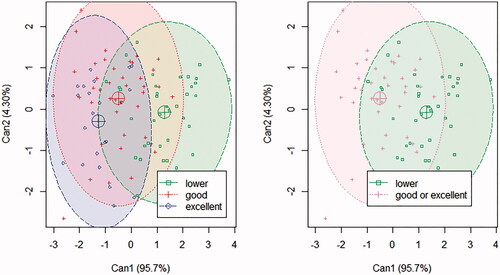
The reduced dataset was used to evaluate the fixed effects in the CDA for FQIc. For FQIc, Can1 accounted for 95.7% and Can2 accounted for 4.30% of the variability (Figure ). The selected features were Ripening Classes, Year, CP, WSC and Starch. The confusion matrix is reported in Table , and 95, 45 and 13% of correct attributions were found for the three-class FQIc lower, good, and excellent silage, respectively. For the reduced dataset, the correct attribution was 95%, and 57% for ‘lower silage’ and ‘overall’ classes, respectively.
Figure 3. scatter plot for the outcomes of the CDA (Can1 and Can2) for the samples of the reduced dataset, in the three classes for FQIc. (A) green filled area = “lower”; red filled area = “good”; blue filled area = “excellent”. (B) Green filled area = “lower”; red filled area = “good or excellent”. Ellipses represent a 95% confidence interval.
PLS-DA resulted in FQIc with VIP > 1 for DM (1.38), Ash (1.03), EE (1.27) and Starch (1.31). Regression coefficient for NEQ, were DM = −0.37, Ash = 0.02, EE = 0.06, Starch = 0.11 with selected four PCs (captured variance for PC1 = 49.5%, for PC2 = 21.3%, PC 6.53% and PC4 = 5.65%). In Table , are reported the confusion matrix for PLS-DA in validation (testing set): 80.9 and 78.2.0% were correctly predicted for NEQ, FQI < 57.4 and EQ, FQI ≥ 57.4, respectively.
Table 8. confusion matrix for PLS-DA, SVMs and KNN algorithms, validated on the testing set of FQIc.
Machine learning approaches
Support vector machine (SVM) algorithm was tested for linear and radial basis function, by selecting the c (cost) function and sigma by the use of a grid. Best performances were reached by the linear kernel, C = 0.75 which correspond accuracy = 0.78 and Kappa = 0.45, in cross-validation. The confusion matrix was calculated in the testing set (Table ), where the 93.0 and 46.0% of true positive are correctly predicted for NEQ, FQI < 57.4, and EQ, FQI ≥ 57.4, respectively.
By the use of the KNN algorithm, for FQI classification, the better cross-validate choice in the training set was K-point = 13, corresponding to accuracy = 0.78 and k = 0.43. In Table , we report the confusion matrix for the testing set in FQI classification. The percentage of the true positive was 95 and 48% for NEQ, EQ, respectively, while MCC > 0.54.
Summarising, multiple regression and PLS tested for FQI reached R2 = 0.42 in the validation. For FQIc the MCC was greater than 0.57, 0.50 and 0.54 for PLS-DA, SVM and KNN, respectively, and greater than 0.25 for CDA, in the validation dataset. The most predictive variables for FQI detected by stepwise were DM, ADL and starch with negative coefficients, and ash, EE, and aNDF with positive coefficients. Both VIP in PLS and the STEPDISC of CDA confirmed the role of DM, ash, EE and starch, whereas CP and ADL were confirmed only by the latter algorithm. Results of the ANOVA underlined that ash, CP, aNDF and WSC positively influenced the FQI values; similar results (except for CP) were obtained by the visual inspection of the first two PCs. The use of the dummy variables affected significantly the stepwise multiple regression and improved the R2 to 0.48. The RF has not identified any redundant predicting variable among the pre-ensiled traits.
Discussion
Several multivariate approaches, as well as several algorithms, have been tested. The first aim was to identify the right choice of features to be used in multivariate approaches. In the ANOVA of FQIc, ash, CP, aNDF, ADF and WSC are positively and significantly associated with EQ. In PCA, FQIc (EQ level) coordinates are nearby to Ash, aNDF and WSC loadings coordinates. Inversely, in Random Forest, all original variables (the proximate composition of freshly harvested corn) seem to be significantly important.
Stepwise regression recognises DM, ADL and starch as the predictive variables with negative coefficients, and ash, EE, and aNDF with the positive coefficient, confirming the ones obtained by PCA. Hence, pre-ensiling traits taken as indexes of the maturity stage of the plant (Ferraretto et al. Citation2018) are negatively related to FQI indexes. These results are underlying that the harvest at an early maturity stage leads to better ensiling processes. This finding confirms the results from other authors (Johnson et al. Citation2003; Neylon and Kung Citation2003; Arriola et al. Citation2012) where fresh maize plants ensiled at different DM content resulted in higher Lactic Acid content when harvested early (lower DM content). These responses were attributed to the combination of low WSC concentrations in late-harvested maize (Johnson et al. Citation2003) and reduction in the growth of lactic acid bacteria because water activity decreased along with the increasing dryness as the forage matures (Neylon and Kung Citation2003). The regression led to discrete performances for FQI, R2v = 0.42; this result could be affected by the interference of several factors influencing the ensiling processes, such as year (Kruse et al. Citation2008; Loučka et al. Citation2015). The potential influence of the above-mentioned factors is confirmed by the increase of predicting performance (R2v = 0.55) attained after the introduction of some fixed factors (growing area, maturity phase, ripening class and year) in the model applied to the reduced dataset.
PLS produces results comparable to those of stepwise regression, both in the cross-validation and validation of FQI. Using classes instead of continuous variables could simplify the calculation. The CDA resumed the variance in Can1 and Can2, but R2 between Can1 and Can2 Vs. CLASS variable was weak (Can1 = 0.39 and Can2 = 0.009 for FQI classification). The CDA performed with the use of fixed-effects confirmed the usefulness of Ripening Classes and Year on the FQIc.
On the contrary, PLS-DA performed good results, with 80.9 and 78.2% of correct predictions for NEQ and EQ, respectively. VIP for the PLS-DA algorithm shows as the most related variable to FQIc: DM, Ash, EE and Starch.
SVMs improved the ability of discrimination, with 93.0 and 46.0% of true positives which are correctly predicted for EQ and NEQ, respectively. Finally, the K-Nearest Neighbours confirmed to be a secure and robust classifier method with MCC > 0.54 for FQIc.
In this study, the FQI was greater for samples harvested at 1/3 milk line maturity phase than in later maturity phases. These findings confirm the relevance of the maturity phase at harvest, which is related to the plant nutrients, such as WSC content (Johnson et al. Citation2003) and affects silage fermentation characteristics determining silage final pH and aerobic stability, through the differentiated production of acetic and other organic acids (Filya, Citation2004). The FQI value (accordingly to FQIc class) is influenced by the role of some pre-ensiled traits as shown by this study (ANOVA, PCA, feature selection and CDA) with negative coefficients for DM and starch, and positive coefficients for aNDF. These traits, and their variation are indicators of the maturity stage of the maize plant (Johnson et al. Citation2002; Jensen et al. Citation2005) and contribute to the definition of silage quality in terms of DM, CP, starch, fibre content and nutrients digestibility (Kuehn et al. Citation1999; Addah et al. Citation2011; Krämer-Schmid et al. Citation2016). In our findings, the influence of the crop year, level input field and maturity phase in the FQI value have been shown by the ANOVA as well as by their relevance in the multiple regression or CDA algorithms. Anyhow, other several factors not considered in this study, such as genetics, plant ecophysiology, and different agro-techniques, including seeding density, fertilisation, meteorological conditions, might affect the final fermentation quality (Berzsenyi and Dang Citation2008; Sárvári and Pepó Citation2014 together with the ensiling procedures such as the mechanical processing, the use of inoculants and additives, and the packing density (Johnson et al. Citation2002; Johnson at al. 2003).
Conclusions
NIRs technique applied through the use of portable instruments was confirmed to be an essential tool to apply the precision feeding strategy to the assessment of the composition of maize plants intended for ensiling. The prediction of the fermentation quality, summarised through the FQI index, starting from the composition of the plant at harvest was successful, even though it was evident that the inclusion of data on growing and harvesting conditions can improve the prediction capacity. Among the traits of the fresh maize plant DM, starch and ADL appeared to be negatively related to FQI whereas aNDF and WSC were positively related to FQI. This finding, obtained by the multivariate approaches, might be relevant to focus on the desired improvement in the maize selections, agronomic techniques and ensiling process. Among several algorithms tested for the predictive or classification ability, performances were similar in overall used models but, due to its simplicity in the application and to the fewer calculation requirements, the linear regression obtained after the stepwise procedure appeared to be the most convenient method, even because it might be easily enforced on harvesting machines. Moreover, the use of a stepwise procedure before the linear regression would reduce the risk of multicollinearity of predictive variables and reduce the optimism in the results, as demonstrated by the likeness of the determination coefficient obtained in calibration and validation. Conversely, for research purposes, the tested multivariate approaches allow to a deeper description and knowledge of the dataset and of the relationships within the predictive variables and among them with the outcomes. In practical terms, the multivariate approaches would drive to better prediction performances using a larger number of predictive variables which drive to more selectable features and latent variables. Nevertheless, the unexplained variability for the better tested algorithms in regression was 45%, which let to assume that other predictors as well as the sample variability within the field must be furtherly considered for more consistent results. As the application of technologies in the precision feeding sector is in strong expansion and continuous evolution, further research on this topic is needed.
Supplemental Material
Download MS Word (724 KB)Disclosure statement
The authors declare that they have no known competing financial interests or personal relationships that could have appeared to influence the work reported in this paper.
Additional information
Funding
References
- Addah W., Baah J., Groenewegen P., Okine E.K., McAllister T.A. 2011. Comparison of the fermentation characteristics, aerobic stability and nutritive value of barley and corn silages ensiled with or without a mixed bacterial inoculant. Can J Anim Sci. 91:133–146.
- Akon-Technology. 2020. Determining acid detergent lignin in beakers. [accessed 2020 Sep 12]. https://www.ankom.com/sites/default/files/document-files/Method_8_Lignin_in_beakers.pdf.
- Andrighetto I, Serva L, Gazziero M, Tenti S, Mirisola M, Garbin E, Contiero B, Grandis D, Marchesini G. 2018. Proposal and validation of new indexes to evaluate maize silage fermentative quality in lab-scale ensiling conditions through the use of a receiver operating characteristic analysis. Anim Feed Sci Technol. 242:31–40.
- ANKOM Technology. 2015a. Method 12, 4/10/15: acid detergent fiber in feeds - filter bag technique (for A2000 and A2000I). ANKOM Technology, Macedon, NY. [accessed 2016 Mar 20]. https://www.ankom.com/sites/default/files/document-files/Method_12_ADF_A2000.pdf.
- ANKOM Technology. 2015b. Method 13, 4/10/15: Neutral detergent fiber in feeds - filter bag technique (for A2000 and A2000I). ANKOM Technology, Macedon, NY. [accessed 2016 Mar 20]. https://www.ankom.com/sites/default/files/document-files/Method_13_NDFA2000_.pdf.
- AOAC. 2000. Official methods of analysis. 17th ed. Gaithersburg (MD): Association of Official Analytical Chemists.
- AOAC. 2003. Official methods of analysis. 17th ed. 2nd revision. Gaithersburg (MD): Association of Official Analytical Chemists.
- AOAC. 2005. Official methods of analysis. 18th ed. Gaithersburg (MD): Association of Official Analytical Chemists.
- AOAC. 2006. Official method of analysis. 18th ed. Gaithersburg (MD): AOAC International.
- Archibald JG, Kuzmeski JW, Russell S. 1960. Grass silage quality as affected by crop composition and by additives. J Dairy Sci. 43(11):1648–1653.
- Arriola KG, Kim SC, Huisden CM, Adesogan AT. 2012. Stay-green ranking and maturity of corn hybrids: 1. Effects on dry matter yield, nutritional value, fermentation characteristics, and aerobic stability of silage hybrids in Florida. J Dairy Sci. 95(2):964–974.
- Barker M, Rayens W. 2003. Partial least squares for discrimination. J Chemometrics. 17(3):166–173.
- Berzsenyi, Z., and Dang Q. L. 2008. Effect of various crop production factors on the yield and yield stability of maize in a long-term experiment. Cereal Res Commun. 36:167–176.
- Bisutti V, Merlanti R, Serva L, Lucatello L, Mirisola M, Balzan S, Tenti S, Fontana F, Trevisan G, Montanucci L, et al. 2019. Multivariate and machine learning approaches for honey botanical origin authentication using near infrared spectroscopy. J Near Infrared Spectrosc. 27(1):65–74.
- Borreani G, Bernardes TF, Tabacco E. 2008. Aerobic deterioration influences the fermentative, microbiological and nutritional quality of maize and sorghum silages on farm in high quality milk and cheese production chains. R Bras Zootec. 37:68–77.
- Britt JH, Cushman RA, Dechow CD, Dobson H, Humblot P, Hutjens MF, Jones GA, Ruegg PS, Sheldon IM, Stevenson JS. 2018. Invited review: learning from the future—a vision for dairy farms and cows in 2067. J Dairy Sci. 101(5):3722–3741.
- Charles D.F. 1981. Analysis of sugars and organic acids. Int Sugar J. 83:169–172.
- Connor EE. 2015. Invited review: improving feed efficiency in dairy production: challenges and possibilities. Animal. 9(3):395–408.
- Cui C, Fearn T. 2017. Comparison of partial least squares regression, least squares support vector machines, and Gaussian process regression for a near infrared calibration. J Near Infrared Spectrosc. 25(1):5–14.
- Driehuis F. 2013. Silage and the safety and quality of dairy foods: a review. AFSci. 22(1):16–34.
- Fernández-Ahumada E, Garrido-Varo A, Guerrero-Ginel JE. 2008. Feasibility of diode-array instruments to carry near-infrared spectroscopy from laboratory to feed process control. J Agric Food Chem. 56(9):3185–3192.
- Ferraretto LF, Shaver RD, Luck BD. 2018. Silage review: recent advances and future technologies for whole-plant and fractionated corn silage harvesting. J Dairy Sci. 101(5):3937–3951.
- Filya I. 2004. Nutritive value and aerobic stability of whole crop maize silage harvested at four stages of maturity. Anim Feed Sci Technol. 116(1–2):141–150.
- Gallo A, Bertuzzi T, Giuberti G, Moschini M, Bruschi S, Cerioli C, Masoero F. 2016. New assessment based on the use of principal factor analysis to investigate corn silage quality from nutritional traits, fermentation end products and mycotoxins. J Sci Food Agric. 96(2):437–448.
- Gallo A, Giuberti G, Bruschi S, Fortunati P, Masoero F. 2016. Use of principal factor analysis to generate a corn silage fermentative quality index to rank well- or poorly preserved forages. J Sci Food Agric.96(5):1686–1696.
- Gerlach K, Roß F, Weiß K, Büscher W, Südekum KH. 2013. Changes in maize silage fermentation products during aerobic deterioration and effects on dry matter intake by goats. AFSci. 22(1):168–181.
- Grant RJ, Adesogan AT. 2018. Journal of Dairy Science silage special issue: introduction. J Dairy Sci. 101(5):3935–3936.
- Grant RJ, Ferraretto LF. 2018. Silage review: silage feeding management: silage characteristics and dairy cow feeding behavior. J Dairy Sci. 101(5):4111–4121.
- Harris PA, Nelson S, Carslake HB, Argo CMG, Wolf R, Fabri FB, Brolsma KM, van Oostrum MJ, Ellis AD. 2018. Comparison of NIRS and wet chemistry methods for the nutritional analysis of haylages for horses. J Equine Vet Sci. 71:13–20.
- James G, Witten D, Hastie T, Tibshirani R. 2013. Springer texts in statistics: an introduction to statistical learning. New York: Springer US.
- Jensen C., Weisbjerg M. R., Nørgaard P., Hvelplund T. 2005. Effect of maize silage maturity on site of starch and NDF digestion in lactating dairy cows. Anim Feed Sci Technol. 118:279–294.
- Johnson LMM, Harrison JHH, Davidson D, Mahanna WCC, Shinners K, Linder D. 2003. Corn silage management: effects of hybrid, maturity, inoculation, and mechanical processing on fermentation characteristics. J Dairy Sci. 86(1):287–308.
- Johnson LM., Harrison JH., Davidson D., Mahanna WC., Shinners K., Linder, D. 2002. Corn silage management: effects of maturity, inoculation, and mechanical processing on pack density and aerobic stability. J Dairy Sci. 85:434–444.
- Jolliffe I, Cadima J, Cadima J. 2016. Principal component analysis: a review and recent developments. PhilTrans R Soc A. 374(2065):1–16.
- Kim D, Kim SK. 2012. Comparing patterns of component loadings: principal component analysis (PCA) versus independent component analysis (ICA) in analyzing multivariate non-normal data. Behav Res. 44(4):1239–1243.
- Krämer-Schmid M, Lund P, Weisbjerg MR. 2016. Importance of NDF digestibility of whole crop maize silage for dry matter intake and milk production in dairy cows. Anim Feed Sci Technol. 219:68–76.
- Kruse S, Herrmann A, Kornher A, Taube F. 2008. Evaluation of genotype and environmental variation in fibre content of silage maize using a model-assisted approach. Eur J Agron. 28(3):210–223.
- Kuehn, C.S., Linn, J.G., Johnson, D.G., Jung, H.G., Endres, M.I., 1999. Effect of feeding silages from corn hybrids selected for leafiness or grain to lactating dairy cattle. J Dairy Sci. 12. 82, 2746–2755.
- Kuhn M. 2008. Building predictive models in R using the caret package. J Stat Softw. 28(5):1–26.
- Kung L, Shaver RD, Grant RJ, Schmidt RJ. 2018. Silage review: interpretation of chemical, microbial, and organoleptic components of silages. J Dairy Sci. 101(5):4020–4033.
- Kursa MB. 2010. Feature selection with the Boruta package. J Stat Softw. 36(11):1–13.
- Loučka R, Hakl J, Jirmanová J, Tyrolová Y. 2015. differences in temperature and precipitation in individual months. Grass Forage Sci. 70(4):674–681.
- Marchesini G, Cortese M, Ughelini N, Ricci R, Chinello M, Contiero B, Andrighetto I. 2020. Effect of total mixed ration processing time on ration consistency and beef cattle performance during the early fattening period. Anim Feed Sci Technol. 262:114421.
- Marchesini G, Serva L, Chinello M, Gazziero M, Tenti S, Mirisola M, Garbin E, Contiero B, Grandis D, Andrighetto I. 2019. Effect of maturity stage at harvest on the ensilability of maize hybrids in the early and late FAO classes, grown in areas differing in yield potential. Grass Forage Sci. 74 (3), 415–426.
- Marchesini G, Serva L, Garbin E, Mirisola M, Andrighetto I. 2018. Near-infrared calibration transfer for undried whole maize plant between laboratory and on-site spectrometers. Ital J Anim Sci. 17: 1, 66–72.
- Martillotti F., Anotngiovanni M., Rizzi L. Santi E., Bittante G. 1987. Metodi di analisi per la valutazione degli alimenti d'impiego zootecnico. In: di Quaderni metodologici. Milano: CNR. IPRA.
- Martillotti, F., Puppo, S., 1985. Liquid chromatographic determination of organic acids in silages and rumen fluids. Ann Dell’Istituto Sper Zootec. 18, 1–10.
- Megazyme. 2014. Urea/ammonia assay procedure. [accessed 2017 Sep 1]. https://secure.megazyme.com/files/Booklet/K-URAMR_DATA.pdf.
- Mehmood T, Liland KH, Snipen L, Saebø S. 2012. A review of variable selection methods in partial least squares regression. Chemom Intell Lab Syst. 118:62–69.
- Mottram T. 2016. Animal board invited review: precision livestock farming for dairy cows with a focus on oestrus detection. Animal. 10(10):1575–1584.
- Neylon JM, Kung L. 2003. Effects of cutting height and maturity on the nutritive value of corn silage for lactating cows. J Dairy Sci. 86(6):2163–2169.
- Ottavian M, Fasolato L, Serva L, Facco P, Barolo M. 2014. Data fusion for food authentication: fresh/frozen-thawed discrimination in west African goatfish (Pseudupeneus prayensis) fillets. Food Bioprocess Technol. 7(4):1025–1036.
- Ottavian M, Franceschin E, Signorin E, Segato S, Berzaghi P, Contiero B, Cozzi G. 2015. Application of near infrared reflectance spectroscopy (NIRS) on faecal samples from lactating dairy cows to assess two levels of concentrate supplementation during summer grazing in alpine pastures. Anim Feed Sci Technol. 202:100–105.
- Playne MJ, McDonald P. 1966. The buffering constituents of herbage and of silage. J Sci Food Agric. 17:264–268.
- Sárvári M, Pepó P. 2014. Effect of production factors on maize yield and yield stability. Cereal Res Commun. 42:710–720.
- Wathes CM, Kristensen HH, Aerts JM, Berckmans D. 2008. Is precision livestock farming an engineer’s daydream or nightmare, an animal’s friend or foe, and a farmer’s panacea or pitfall? Comput Electron Agric. 64(1):2–10.
- Wilkinson JM, Davies DR. 2013. The aerobic stability of silage: key findings and recent developments. Grass Forage Sci. 68(1):1–19.
- Xie ZL, Zhang TF, Chen XZ, Li GD, Zhang JG. 2012. Effects of maturity stages on the nutritive composition and silage quality of whole crop wheat. Asian Australas J Anim Sci. 25(10):1374–1380.