
 ?Mathematical formulae have been encoded as MathML and are displayed in this HTML version using MathJax in order to improve their display. Uncheck the box to turn MathJax off. This feature requires Javascript. Click on a formula to zoom.
Abstract
This study assessed the ability of honeybees as environmental indicators for atmospheric Lead and Cadmium concentrations through regression analyses. For this purpose, honeybees sampling was performed from June to November 2017, in three apiaries in Milano, and in two apiaries in Lodi and in Magenta. Heavy metals were detected on bees through atomic absorption and related to the respective mean atmospheric levels, measured by municipal monitoring units during 30 d before bees collection. The highest values of Cadmium on bees, 0.028–0.385 µg g−1, were detected in Magenta, a suburban-rural site. Lead showed the highest values, 0.244–0.741 µg g−1, in Milano, Orti di Via Padova, an urban ex-industrial area retrained for horticulture, characterised by a planted area rich in biodiversity. Cd and Pb on bees were significantly (p < .001) affected by the respective atmospheric heavy metal concentration, measured by the nearest municipal monitoring station (p < .05) and affected by beehive site type (p < .05). The linear regression models performed for each site, showed that atmospheric metals were significantly better predicted in biodiverse sites than in sites characterised by poor vegetal biodiversity, probably for the necessity of bees of a larger foraging area. This study highlighted the relationship between bee and atmospheric quality of the hive site, confirming and quantifying the ability of bees as “alternative tools” to atmospheric monitoring devices for Cadmium and Lead pollution level. For the local-regional aspect of the study, further studies at larger scale are needed.
Graphical Abstract
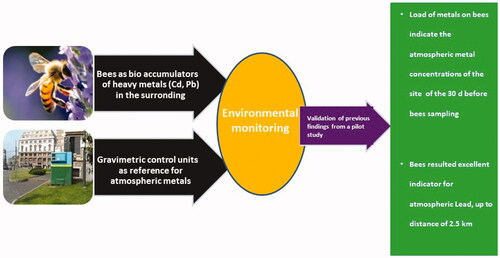
Honey bees are considered indicators for environmental pollution
Pb, Cd were measured on bees in five urban and suburban beehives in Northern Italy
Metals detected on bees were related to atmospheric concentrations for each site
Pb and Cd load on bees indicate the mean atmospheric metals of the 30 d before bees sampling
Bees resulted excellent indicator for atmospheric Lead, up to distance of 2.5 km
HIGHLIGHTS
Introduction
In last times, the increasing losses of honeybees in North America and in Europe, together with wild bee species decline, have raised considerable concern amongst scientists, producers, stakeholders, and common people (Neumann and Carreck Citation2010).
The decline of pollinators occurred, mainly, for pests and diseases, (Cilia et al. Citation2019), for the poorly diversified vegetation of intensified, up to single-crop, agriculture, that caused the loss of forage biodiversity for bees (Goulson et al. Citation2015). Also the increase of environmental contaminants, as heavy metals, generated by anthropogenic activities, can affect the health status of the bees, in terms of diseases and mite infestation (Hladun et al. Citation2016).
Heavy metals emitted in the environment can derive from natural and anthropogenic sources. They increased rapidly over the past century for the enhanced anthropogenic emissions into the environment (Singh et al. Citation2017), leading to high metals concentrations in the atmosphere and to accumulation on plants, on nectar and pollen, that represent the feed picked up by honeybees during foraging (Perugini et al. Citation2011).
There is a wide literature demonstrating that adult honeybees could be used as an indicator of environmental pollution (Crane Citation1984; Celli and Maccagnani Citation2003; Al Naggar et al. Citation2013; Negri et al. Citation2015; Parikh et al. Citation2020). Literature analysis highlights the anthropogenic source of metals on bees pollution (Smith and Weis Citation2020; Ilijević et al. Citation2021), and that the level of pollution on bees is referred to the type of site, if industrial, rural, urban-suburban and control, or non – contaminated, sites (Steen et al. Citation2012; Zarić et al. Citation2016; Giglio et al. Citation2017; Goretti et al. Citation2020).
For the first time, Van der Steen et al. in 2015, studied the relationship between Vanadium, Cadmium and Lead found on bees and their atmospheric concentrations, with the aim to quantify the correspondence bees-air quality. In that study, Steen et al. (Citation2015) found that the concentrations of Vanadium were significantly and positively related in weekly sampled worker bees with the concentrations in air during the same 14-day period preceding the sampling of the bees, but no relationship for Cd and Pb for bees-atmosphere were found, probably for the less bioaccumulation of atmospheric metals occurring on bees in 14 d.
For the above exposed reasons, the aim of this study is to investigate the efficiency of adult honeybees as bio-accumulators and predictors for Lead and Cadmium, comparing Cd and Pb load on adult forager bees to the related atmospheric concentration, in different urban and peri-urban sites in the Lombardy Region, in Northern Italy. The regression analyses performed is addressed to assess the potential bee reliability as an alternative tool to atmospheric monitoring units.
Materials and methods
Sites of sampling
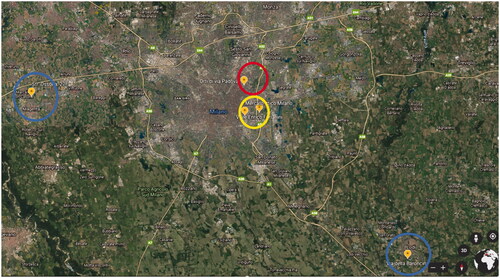
Sampling of honeybees was performed from June to November 2017 in 5 apiaries, each composed of 7 beehives, conducted by the same beekeeper, 35 beehives were considered in total in the experiment. Three apiaries were located in the city of Milan (Northern Italy), one in Lodi, 30 km south-east of Milan, and one in Magenta, 26 km west of Milan. The urban site of sampling (Orti di via Padova) and the suburban ones (Linate, Mercato Ittico) in Milano, and the suburban ones, near rural areas of Lodi and Magenta are depicted in Figure , respectively with red (urban) and blue (suburban) circles.
Figure 1. Map of the sampling sites: red circles urban sites, yellow circle suburban sites; blue circles suburban-rural sites.
Colonies health and the absence of diseases were assessed by the beekeeper and by the Veterinarians involved in the trial.
Animal sampling
The present study was conducted in full compliance with all relevant codes of experimentation and legislation.
During each month of the trial, June to November 2017, three samples of around 10 bees, to provide an amount of 0.5 g of dry matter tissue for each sub sample, found dead within 3 m from the hives, were collected using plastic gloves, and taken to the laboratory to evaluate the concentration of Lead and Cadmium sampling. Only dead bees were considered in the trial, since one month, that is around the working life of a forager, was the reference time selected for the regression analysis, on the basis of previous studies (Steen et al. Citation2015, Costa et al. Citation2019).
Detection of heavy metals on bees: preparation of honeybees for atomic absorption
This study quantified the amount of Cd and Pb on bees, other metals, as As, Cr, Mn, and Ni were not considered since they are normally found in pollen, source of food (Lambers et al. Citation1998), and in instrumental equipment of beehives (Steen et al. Citation2012). The analysis procedure was described in Costa et al. (Citation2019). The analysis for heavy metal extraction was conducted in the laboratory of the Veterinary Department and Safety Of Food Of Animal Origin (ATS, Agenzia per la tutela della salute – Health Protection Agency) according to the CE rules 333/2007, CE 882/2004, UNI EN 14084:2003 – “Foodstuffs - Determination of trace elements - Determination of lead, cadmium, zinc, copper and iron by atomic absorption spectrometry (AAS) after microwave digestion” and the “Guidelines for the validation of analytical methods and for calculating the uncertainty”, MPN/SC 05 Ref. UNI EN 14084: 2003 Rev. 2, 11/27/2012.
A solution of purified water through osmosis (Milli-Q Millipore 18.2 M cm1 resistivity) was used, nitric acid, hydrogen peroxide, and hydrochloric acid were utilised (E. Merck, Darmstadt, Germany).
An amount of 0.5 g of honeybee sample (dry matter) was added with concentrated nitric acid in PTFE vessels for microwave digestion and placed in the rotor of a microwave oven, the digestion was performed according the sequence −200 W/5 min; 0 W/5 min; 500 W/5 min-. The vessels were cooled down to the room temperature and samples were quantitatively transferred into calibrated volumetric flasks, blank samples were passed through the whole procedure.
To determine Pb and Cd, an atomic absorption spectrometer (AAS; Analyst 700; Perkin-Elmer, Norwalk, Connecticut, USA) equipped with graphite furnace for samples injection was used.
Blank samples, one per each digestion session, without bees, were prepared following the same procedure to assess possible contamination during sample preparation procedure.
Analytical detection limit (LOD) was 0.01 mg kg−1 for Pb and Cd, analytical limit of quantification (LOQ) varied from 0.01 mg kg−1 for Cd to 0.02 mg kg−1 for Pb.
Detection of heavy metals in the atmosphere
Atmospheric levels of Lead and Cadmium were measured daily by the municipal monitoring stations of ARPA (Agency for Environmental Protection) through gravimetric method. The municipal control units measure particulate matter (PM10 and PM2.5) and metals(on PM10 filters) through gravimetric method, sampling pollutants on individual filters. Filters in PTFE were conditioned before and after particulate collection, i.e., at 20 ± 1° C, at a relative humidity of 50 ± 5%, for at least 48 h. The difference between the two weights, before and after conditioning, corresponded to the exact value of the weight of the analysed particulate matter.
Heavy metals detection was performed on the filters for PM10 measurements by the municipal ARPA laboratories, through the same procedure used for heavy metals detection on bees (atomic absorption), described in the previous section.
Data about atmospheric Pb and Cd, published on the ARPA website (one daily mean value for each metal is provided) were downloaded and used in the study.
When available, the beehives were related to different monitoring stations in the surrounding, to evaluate the efficiency of bees as heavy metals bio-accumulators, in function of the distance of the beehive from the monitoring station, also in order to obtain more information on the size of the foraging area of bees.
Table shows beehive sites and heavy metals monitoring stations (ARPA) considered, together with the distance from the beehive location.
Table 1. Beehive locations and ARPA monitoring stations considered in the survey.
Statistical analysis
Data about Cd and Pb load on honeybees were submitted to variance analysis (Proc GLM of the SAS statistical package 9.4 2019) in order to evaluate the effect of month, sampling site. Normality of data was tested through Kolmogorov-Smirnov test.
Tukey’s for multiple comparison test was performed to analyse differences in sampling sites and sampling months.
A Pearson correlation analysis (Proc CORR of the SAS statistical package 9.4 2019) was conducted to analyse the effect the weight of the mineralised bees on the concentration of Cd and Pb on bees.
Then, a variance analysis (Proc GLM of the SAS statistical package 9.4 2019) was performed to evaluate the effect of the atmospheric concentration of Pb and Cd on the concentration of the respective heavy metal in bees, considering different monitoring stations (see the previous section).
For this purpose, the mean atmospheric pollutant concentrations of the 30 d before bees collection was considered, as the most affecting heavy metals load on bees, according to previous findings (Costa et al. Citation2019), and after testing the bees’ metals load association with the mean atmospheric concentrations of different periods, intended as one week, two weeks and three weeks before bees sampling.
Before data processing to variance analysis, data of each atmospheric metal was divided into concentration classes, according to data distributions (concentrations peaks and range of frequency).
Atmospheric mean Pb concentration (calculated on 30 d values before bees collection) was classified in three classes, from 0 µg m−3 to 50 µg m−3, (0–10 µg m−3; 10–30 µg m−3, more than 30 µg m−3), according to data distribution.
Atmospheric mean Cd concentration (calculated on 30 d values before bees collection) was classified in five classes, from 0 µg m−3 to 0.5 µg m−3, by 0.1 µg m−3, according to data distribution.
Minimum significance level was declared at p < .05 for each statistical analysis procedure session.
At the end, a linear regression analysis model was conducted, (Proc REG of the SAS 9.4 statistical package Citation2019) for each site, to estimate the correspondence between animals and atmospheric concentrations of Cd and Pb in the different locations, according to different distances from the monitoring stations, within the concept of precision bee farming. The metal concentration in bees was calculated as the average value of the sampled three bee colonies (replicates) per location and sampling date, and the metal concentration in the air was calculated as the average of metals values during the month (30 d) preceding the sampling of the bees.
Only the models with significance at 5%, R2 > 50%, Adj R2 > 50%, and parameters significance level lower than 5% were considered as reliable model for fitting the relationship bees/environment.
Results
Heavy metals detected on bees
Table shows mean, minimum and maximum values for Pb and Cd on bees in the five sites during the six monitoring months.
Table 2. Mean, minimum and maximum values for Cd and Pb on bees in the five sites during the six monitoring months.
No diseases were detected during the trial in the five beehives.
Values of Cd and Pb raised during fall, from September. Tukey’s test that the amount of heavy metals on bees resulted affected by the month of sampling (for Pb p < .01; for Cd p < .001), with higher values during fall, especially for lead, the location affected significantly Cd (p < .001) and Pb (p < .01) bioaccumulated on bees.
Table shows the mean values of Cadmium and Lead measured on bees collected during the 5 months of the trial at the different sites.
Table 3. Mean Cd and Pb (± SEM) measured on bees in the different sites, over the trial (June–July 2017).
Pearson correlation analysis revealed that the concentration of Cd and Pb resulted affected by the weight of the mineralised bees, Cd concentration was inversely proportional (72%, p < .01) and Pb directly proportional to the weight of the samples of bees used for the analysis (68%, p < .01).
Atmospheric levels of cadmium and lead
Table shows the mean values of atmospheric Cd and Pb, calculated on the 30 days before bees collection in Magenta, at the monitoring station located in Via Turati, and in Milano, at the monitoring stations located in Via Senato and in Città Studi.
Table 4. Mean atmospheric concentration of Cd and Pb measured by municipal monitoring units, calculated on the 30 d before bees collection.
The monitoring station located in Lodi did not measure any concentration of heavy metal during the trial, so Lodi was not considered in the following analyses.
Concentrations of the two heavy metals were relatively low at each site, during summer months, but, in September, with the resumption of working and school activities, the concentrations raised, in particular way, at the monitoring station of Milan Città Studi.
Relationship between heavy metals on bees and their atmospheric concentrations
Variance analysis, conducted to evaluate the effect of the atmospheric concentration of Cd and Pb on bee heavy metals load and the effect of distance of beehive from the monitoring stations, revealed that Cd and Pb concentrations on bees were respectively affected in a significant way by mean monthly atmospheric Cd and Pb (p < .001). Cd and Pb load depended on the atmospheric concentration measured by the nearest monitoring station (p < .05) and on beehive site (p < .05).
Following these results, a regression model (linear model) was performed for each site, to quantify the relationship of heavy metals between environment and its load on sampled bees.
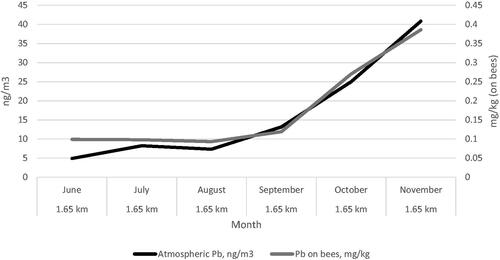
The following Figures and show two examples of the trend of Cadmium and Lead detected on bees and Cd atmospheric levels during the trial, downloaded from ARPA website, according to the distance of the monitoring station/s from the beehives.
Figure 2. Concentrations of atmospheric Cd and its content on bees located in the city of Milan (Orti di via Padova) (the beehive is 1.65 km far from the monitoring station of Milan,Città Studi and 5 km from the monitoring station of Milan, Senato).
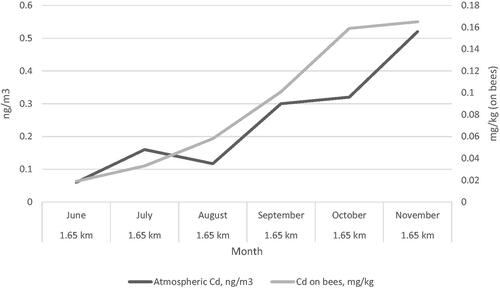
Figure 3. Concentrations of atmospheric Pb and its content on bees located in the city of Milan (Orti di via Padova, the beehive is 1.65 km far from the monitoring station of Milan, Città Studi and 5 km from the monitoring station of Milan, Senato).
Linear regression analysis: Cadmium
Magenta
The proc reg performed on this group of data showed a regression (p < .01) with a high R2 of 0.92 and Adj R2 of 0.90, but the intercept parameter was not significant.
Milan, orti di via padova
The proc reg performed on this group of data (Figure ) showed a regression (p < .05) with R2 of 0.84 and Adj of R2 0.80, when the distance apiary-monitoring station was 1.65 km; a regression (p < .05) with R2 of 0.84 and Adj R2 of 0.80, when the distance was 5 km.
The calculated regression is referred to the beehives located in Milan, Orti di via Padova and the monitoring station of Milan, Città Studi (far 1.65 km).
The linear regression calculated on data produced by the monitoring station located in Milan, Senato (5 km of distance) was not considered, since the intercept parameter was not significant.
Milano mercato ittico
The proc reg performed on this group of data showed a regression (P = NS) with R2 of 0.54 and Adj of R2 0.43, when the distance apiary/monitoring station was 2 km; a regression (P = NS), R2 of 0.48 and Adj R2 of 0.35, when the distance apiary/monitoring station was 2.5 km.
Milan linate
The proc reg performed on this group of data showed a regression (P = NS), with R2 of 0.66 and Adj R2 of 0.57, when the distance apiary/monitoring station was 5 km; a regression (P = NS) with a low R2 of 0.34 and Adj R2 of 0.17, when the distance was 7.6 km.
Linear regression analysis: Lead
Magenta
The proc reg performed on this group of data showed a regression (P = NS) with R2 of 0.61 and a Adj R2 of 0.51.
Milan orti di via padova
The proc reg performed on this group of data (Figure ) showed a regression (p < .001) with a high R2 of 0.98 and Adj R2 of 0.97, when the distance apiary/monitoring station was 1.65 km; a regression (p < .01) with R2 of 0.67 and a Adj R2 of 0.66, when the distance was 5 km.
The linear regression calculated on data produced by the monitoring station located in Milan Senato (5 km of distance) was not considered, since the intercept parameter was not significant.
Milan, mercato ittico
The proc reg performed on this group of data showed a regression (p < .001) with a high R2 of 0.97 and a Adj R2 of 0.96, when the distance apiary/monitoring station was 2 km;
a regression (p < .01) with a high R2 of 0.88 and Adj R2 of 0.85, when the distance was 2.5 km.
Milan linate
The proc reg performed on this group of data showed a regression (P = NS), with R2 of 0.20 and Adj R2 of 0.00, when the distance was 5 km; a regression (P = NS) with a R2 (0.14) and an Adj R2 of 0.00, when the distance was 7.6 km.
Discussion
Data about heavy metals load on bees differed in significant way in the six sampling months, with higher values starting from September for both metals, and in the five sites. Magenta (suburban-rural site) and Milan – Orti di via Padova sites showed the highest values for Cd. Milan- Orti di Via Padova and Linate, near the airport, showed the highest values of Pb on bees. The considered sites in Milan are in urban and suburban areas, Linate is a suburban area of Milano, near the airport, Mercato Ittico is a commercial suburban site near highways although not far from urban green areas, and Orti di Via Padova is an urban ex-industrial area retrained for horticulture, characterised by a planted area rich in biodiversity. The two suburban-rural sites outside Milan differ for the wooded area around Magenta.
The values related to the bees sampled in the three locations in Milano in the present study are lower than those found for Pb (mean 0.602 µg g−1; 0.248–1.396 μg g−1) in a previous study conducted in Milano (Costa et al. Citation2019) during the Expo 2015 time, maybe for the lower atmospheric concentration of pollutants related to the lower road traffic, in comparison with that occurred during the months of Expo. This decline in Pb biaccumulated on bees can be explained by recent findings of Zarić et al. (Citation2018a, Citation2018b), who observed the decline of Pb concentrations during the years, for the “mitigation” of Pb anthropogenic sources in urban sites.
The study confirmed the bioaccumulation of metals on bees according the month of sampling, or, to metals environmental levels, higher from September to November, end of the survey; in general, literature reports differences in metal concentrations according to the sampling month, with higher concentrations in Summer. This trend can be explained by the higher number of plants blooming and the higher activity level and bees participation during the peak occurring in spring and summer (Zarić et al. Citation2016), with lower values of metal bioaccumulated in bees in September, for the less exposition of bees to the environment, for the reduction of pollen and nectar (Kauffeld Citation1980). The peaks of metals bioaccumulated on bees occurred from September, probably with the recovery of vehicular traffic for work and university activities, as showed by the metals concentrations measured by the monitoring station of Città Studi, hosting the Scientific Faculties of Milano Universities. Another reason for these peaks metals in autumn could be due to the extreme climatic conditions in Lombardy. The higher metal load in Fall could be explained by the dry weather conditions during the experimental study, with very high temperatures and scarce rains in autumn, in October the rainfall was only 1.5 mm, since rains and humidity reduce metal concentrations in honeybees (Lambert et al. Citation2012a; Zarić et al. Citation2017).
In general, the concentrations of Cd and Pb in air were moderate and below the target value of 5 ng·m−3 for Cd, and the limit value of 500 ng·m−3 for Pb, EEA Report 10/2019 Citation2019.
The linear regressions performed on data for each site, showed that atmospheric Cadmium was significantly predicted only in the case of the apiary located in Milan, Orti di via Padova, 1.65 km far from the municipal monitoring station. This result could be explained by the high biodiversity of this urban site, with flower and horticultural gardens, not far from Forlanini Park, a green area in Milan, able to guarantee to bees a nearby foraging area. The regression model on Cd values on bees reared in the other sites, characterised by scarce vegetal biodiversity, showed a lower accuracy in predicting atmospheric Cd, probably for the necessity of bees of a larger foraging area to pick up nutrients.
The linear regressions for Lead showed a good fitting for the beehives of Milan, Orti di via Padova towards the atmospheric concentration measured by the monitoring station of Milan, Città Studi (far 1.65 km) and for the beehive in Milan, Mercato Ittico site towards the atmospheric data measured by Milan, Città studi (2 km far) and Milan, Senato (2.5 km far).
The higher accuracy of bees to describe atmospheric impairment for Lead (the apiaries of Milan Orti di Via Padova and Mercato Ittico worked as excellent indicator for Pb atmospheric pollution of the surrounding, up to 2.5 km of distance) could be explained by the higher cadmium contents in the external parts of the bees (Leita et al. Citation1996), that can be lost during bees collection and makes it more “unstable” for analysis, while Lead accumulates mainly inside the body tissues of honey bees foraging in urban and industrial areas (Lambert et al. Citation2012 b). These considerations could explain the different correlation found between the weight of the mineralised bees and the two metals content: the correlation was inversely proportional for Cd and directly proportional for Pb. This difference can be due to Cd fixing on tissues of the body, and to Pb mainly depositing in the external part of the bees, as found by Sadowska et al. (Citation2019).
The use of mean atmospheric values of metals, measured the month before bees collection, validated previous findings (Costa et al. Citation2019), highlighting that bioaccumulation of Pb and Cd on bees occurs in, at least, 30 d, that corresponds to the working life of foragers.
Linear regression models highlighted the relation between Cadmium on bees and its atmospheric concentrations, revealing a limited foraging area up to 1.65 km from the beehive, in biodiverse sites.
Conclusions
This study, performed in different sites in Lombardy (Milano, Magenta, Lodi) highlighted the relationship between bee and atmospheric environment, confirming and quantifying the ability of bees to predict the environmental pollution by Cadmium and Lead, as alternative to atmospheric monitoring devices.
For the local-regional aspect of the study, further studies are needed at larger scale.
Author contributions
AC organised the trial, analysed and interpreted the data, wrote the manuscript; MV conducted the trial and collected bee samples; MB conducted chemical analyses, LC conducted chemical analyses and collected bees samples, FMT organised the trial, collaborated to write and revise the manuscript.
Disclosure statement
The present study was not funded in a specific project, funds were provided by the authors.
Data availability statements
The data that support the findings of this study are available on request from the corresponding author, AC.
References
- Al Naggar YA, Naiem ESA, Seif AI, Mona MH. 2013. Honey bees and their products as a bioindicator of environmental pollution with heavy metals. Mellifera. 13:1–20.
- Celli G, Maccagnani B. 2003. Honey bees as bioindicators of environmental pollution. Bull Insectol. 56:137–139.
- Cilia G, Sagona S, Giusti M, Jarmela dos Santos PE, Nanetti A, Felicioli A. 2019. Nosema ceranae infection in honeybee samples from Tuscanian Archipelago (Central Italy) investigated by two qPCR methods. Saudi J Biol Sci. 26(7):1553–1556.
- Costa A, Veca M, Barberis M, Tosti A, Notaro G, Nava S, Lazzari M, Agazzi A, Tangorra FM. 2019. Heavy metals on honeybees indicate their concentration in the atmosphere. It J Anim Sci. 18(1):309–315.
- Crane E. 1984. Bees, honey and pollen as indicators of metals in the environment. Bee World. 55:47–49.
- EEA (European Environment Agency) Report 10/2019 2019. Air quality in Europe — 2019 report. ISSN 1977-8449. Luxembourg: Publications Office of the European Union,
- Giglio A, Ammendola A, Battistella S Attilio Naccarato A, Pallavicini A, Simeon E, Tagarelli A, Giulianini PG. 2017. Apis mellifera ligustica, Spinola 1806 as bioindicator for detecting environmental contamination: a preliminary study of heavy metal pollution in Trieste, Italy. Environ Sci Pollut Res. 24:659–665.
- Goretti E, Pallottini M, Rossi R, La Porta G, Gardi T, Cenci Goga BT, Elia AC, Galletti M, Moroni BC, Petroselli C, et al. 2020. Heavy metal bioaccumulation in honey bee matrix, an indicator to assess the contamination level in terrestrial environments. Environ Pollut. 256 :113388.
- Goulson D, Nicholls E, Botías C, Rotheray EL. 2015. Bee declines driven by combined stress from parasites, pesticides, and lack of flowers. SciencExpress. Science. 347(6229):1255916–1255957.
- Hladun KR, Di N, Liu TX, Trumble JT. 2016. Metal contaminant accumulation in the hive: consequences for whole colony health and brood production in the honey bee (Apis mellifera L). Environ Toxicol Chem. 35(2):322–329.
- Ilijević K, Vujanović D, Snežana Orčić S, Jelena Purać J, Kojić D, Zarić N, Gržetić I, Blagojević DP, Tatjana V, Čelić TV. 2021. Anthropogenic influence on seasonal and spatial variation in bioelements and non-essential elements in honeybees and their hemolymph. Comparative Biochemistry and Physiology Part - C: Toxicology and Pharmacology. 239:108852.
- Kauffeld NM. 1980. Seasonal cycle of activities in honey bee colonies Beekeeping in the United States, Agriculture handbook 335 USDA. Washington DC: United States Department of Agriculture. p. 30–32.
- Lambers H, Chapin FS, III, Pons TL. 1998. Plant physiological ecology. New York: Springer.
- Lambert O, Piroux M, Puyo S, Thorin C, Larhantec M, Delbac F, Pouliquen H. 2012a. Bees, honey and pollen as sentinels for lead environmental contamination. Environ Pollut. 170:254–259.
- Lambert O, Veyrand B, Durand S, Marchand P, Le Bizec B, Piroux M, Puyo S, Thorin C, Delbac F, Pouliquen H. 2012b Polycyclic aromatic hydrocarbons: bees, honey and pollen as sentinels for environmental chemical contaminants. Chemosphere. 86:98–104.
- Leita L, Muhlbachova G, Cesco S, Barbattini R, Mondini C. 1996. Investigation of the use of honey bees and honey bee products to assess heavy metals contamination. Environ Monit Assess. 43:1–9.
- Negri I, Mavris C, Di Prisco G, Caprio E, Pellecchia M. 2015. Honey Bees (Apis mellifera, L.) as active samplers of airborne particulate matter. PLoS ONE. 10(7):e0132491.
- Neumann P, Carreck NL. 2010. Honey bee colony losses. J Apic Res. 49(1):1–6.
- Parikh G, Rawtani D, Khatri N. 2020. Insects as an indicator for environmental pollution. Environ Claims J. 161-181. https://doi.org/https://doi.org/10.1080/10406026.2020.1780698
- Perugini M, Manera M, Grotta L, Abete MC, Tarasco R, Amorena M. 2011. Heavy metal (Hg, Cr, Cd, and Pb) contamination in urban areas and wild life reserves: honey bees as bioindicators. Biol Trace Elem Res. 140:170–176.
- Sadowska M, Gogolewska H, Pawelec N, Sentkowska A, Krasnodębska-Ostręga B. 2019. Comparison of the contents of selected elements and pesticides in honey bees with regard to their habitat. Environ Sci Poll Res. 26:371–380.
- SAS Institute Inc. SAS/STAT Software, Version 9.4. Cary, NC. 2019.
- Singh N, Kumar GV, Kumar A, Sharma B. 2017. Synergistic Effects of Heavy Metals and Pesticides in Living Systems. Front Chem. 5:70.
- Smith KE, Weis D. 2020. Evaluating spatiotemporal resolution of trace element concentrations and pb isotopic compositions of honeybees and hive products as biomonitors for urban metal distribution. GeoHealth. 4(7):101029.
- Steen JJ, van der de Kraker J, Grotenhuis T. 2012. Spatial and temporal variation of metal concentrations in adult honeybees (Apis mellifera L.). Environ Monit Assess. 184(7):4119–4126.
- Steen Jvd, Kraker J. d, Grotenhuis T. 2015. Assessment of the potential of honeybees (Apis mellifera L) in biomonitoring of air pollution by cadmium, lead and vanadium. JEP. 06(02):96–102.
- Zarić NM, Deljanin I, Ilijević K, Stanisavljević L, Ristić M, Gržetić I. 2018b. Honeybees as sentinels of lead pollution: Spatio-temporal variations and source appointment using stable isotopes and Kohonen self-organizing maps. Sci Total Environ. 642:56–62.
- Zarić NM, Ilijević K, Stanisavljević L, Gržetić I. 2016. Metal concentrations around thermal power plants, rural and urban areas using honeybees (Apis mellifera L) as bioindicators. Int J Environ Sci Technol. 13(2):413–422.
- Zarić NM, Ilijević K, Stanisavljević L, Gržetić I. 2017. Use of honeybees (Apis mellifera L) as bioindicators for assessment and source appointment of metal pollution. Environ Sci Pollut Res. 24:25828–25838.
- Zarić NM, Ilijević K, Stanisavljević L, Gržetić I. 2018a. Use of honeybees (Apis mellifera L) as bioindicators of spatial variations and origin determination of metal pollution in Serbia. J Serb Chem Soc. 83(6):773–784.