
Abstract
This study aimed to evaluate the feasibility of mid-infrared (MIR; 5000–900 cm−1) and visible/near-infrared (Vis/NIR; 400–2500 nm) spectroscopy to discriminate organic (ORG) from conventional (CONV) bulk milk. Samples (n = 225) from 24 farms (ORG, n = 12; CONV, n = 12) located in the same area, mainly rearing Holstein-Friesian cows, under similar management conditions, except for ORG livestock spending a period of time on pasture, were collected from September 2019 to August 2020. Chemical composition of the lactation ration was similar between groups. Mid-infrared and Vis/NIR spectrum of each sample were collected. Principal component analysis (PCA) and partial least squares-discriminant analysis (PLS-DA) were done using R software. For the PLS-DA, records were divided in a train set (8 farms/group) and a test set (4 farms/group), and only wavelengths with VIP >1 were retained. The PCA was not able to discriminate both groups. The PLS-DA revealed an accuracy of the model in the test set of 54.1% and 62.9%, for MIR and Vis/NIR, respectively. In conclusion, both infrared regions performed similarly, and the moderate accuracy of the PLS-DA could be related to the similarity of the selected farms between both categories.
Infrared spectra from bulk milk samples of organic and conventional farms were similar.
Low accuracy using partial least squares-discriminant analysis.
Both MIR and Vis/NIR infrared regions performed similarly.
Highlights
Keywords:
Introduction
Organic (ORG) cow’s milk production has doubled since 2008, accounting in 2018 for 3.4% of the dairy cows’ production in the European Union (Willer et al. Citation2020). Consumers are willing to pay a premium price for socially responsible products, but the high price of ORG food is challenging and consumer’s trust has to be earned (Rana and Paul Citation2017; Rodríguez-Bermúdez et al. Citation2020). Consumers cannot directly verify its authenticity and they tend to distrust certification bodies (Rodríguez-Bermúdez et al. Citation2020). Most methods used to guarantee the quality standard requirements (e.g. raw materials origin and purity) are expensive and time-consuming (De Marchi et al. Citation2018). Thus, rapid, non-destructive and inexpensive analysis to verify the food compliance with its label description is important (Esteki et al. Citation2018).
Infrared spectroscopy offers a fast and affordable analysis, without destroying the products, which allows to verify food authenticity in raw material and finished food products (De Marchi et al. Citation2018; Esteki et al. Citation2018). Spectra patterns can be highlighted with principal component analysis (PCA) – unsupervised method – or partial least squares-discriminant analysis (PLS-DA) – supervised method – (Esteki et al. Citation2018). Nevertheless, there is still scarce information regarding the use of infrared spectroscopy to discriminate between ORG and conventional (CONV) milk. Most of these works are based on the premise that ORG and CONV milks differ in n3-fatty acids composition, affected by cows’ feeding (Aulrich and Molkentin Citation2009). Thus, this study aimed to evaluate the feasibility of mid-infrared (MIR) (5011.54–925.92 cm−1) and visible/near-infrared (Vis/NIR, 400–2500 nm) spectroscopy to discriminate ORG from CONV cow bulk milk through PCA and PLS-DA models.
Materials and methods
Farm characteristics and feeding
A total of 24 ORG (n = 12) and CONV (n = 12) farms were enrolled in the study from September 2019 to August 2020. Farms were recruited in the same area, close to each other, and rearing Holstein-Friesian as predominant breed. Farms were also selected to minimise management differences that are known to impact on milk composition such as access to external paddock, use of pasture, total mixed ration (TMR) ingredients and formulation of the lactating diets, and offspring management. All farms selected included maize (meal and/or silage) in the formulation of the TMR of the lactating diets.
Moreover, a sample of the TMR administered to the lactating cows was collected and analysed at the Laboratory of the Feed Analyses from the Department of Veterinary Science of the University of Parma (Parma, Italy) at the moment of the enrolment showing no differences (Table ). The TMR samples were pre-dried at 55 °C to constant weight then ground in a Cyclotec mill (Tecator, Herndon, VA) to pass 1 mm screen. Dry matter was determined by drying the samples at 103 °C overnight (European Commission Citation2009). Nitrogen was determined by dumas method (AOAC 992.23) by combustion digestion (Dumatherm®, Gerhardt GmbH & Co., Königswinter, Germany) and crude protein was calculated as percentage of N × 6.25. Ether extract and starch content were determined following European Commission Regulation No. 152/2009 (European Commission Citation2009) indication. The aNDFom, ADFom, and lignin (sa) were analysed according to Van Soest et al. (Citation1991) and Mertens (Citation2002) with the use of alpha amylase, without the use of sodium sulphite and corrected for ash. A semi-automated system was used for the boiling and filtering phase (FIWE Raw Fibre Extractor, VELP Scientifica, Usmate Velate, Italy).
Table 1. Total mixed ration composition (least square means ± standard error) administered to the cows during lactation.
Bulk milk samples and spectra collection
A total of 225 bulk milk samples (2 × 50 mL) were collected, 0.1 mL of azidiol preservative (Benedet et al. Citation2018) was added, and stored at 4 °C in the Central Laboratory of Granarolo S.p.A. until analysis (≤4 d). Due to COVID restrictions in 2020, we were not able to access the farms during March and April to collect the samples. One aliquot was analysed with an MIR spectrophotometer (5011.54–925.92 cm−1 every 3.85 cm−1; 1060 data points; MilkoScan FT6000; FOSS Electric A/S, Hillerød, Denmark) at the laboratory of the Breeders Association of the Veneto Region (Padova, Italy), and the other aliquot with a Vis/NIR spectrophotometer (400–2500 nm every 0.5 nm; DS2500; FOSS Electric A/S, Hillerød, Denmark) at the Department of Agronomy, Food, Natural resources, Animals and Environment of the University of Padova (Padova, Italy). Both instruments worked at room temperature and samples were warmed at 37 °C and homogenised by gently invert the samples five times before the analysis. For the MIR instrument, the absorbance was recorded as log(1/transmittance). For the Vis/NIR instrument, each spectrum was the average of 32 sub-spectra collected during the automatic rotation of the FOSS slurry cup (i.d. 4 cm) and the absorbance recorded as log(1/reflectance). MilkoScan FT6000 (FOSS Electric A/S, Hillerød, Denmark) spectra were collected using FOSS Integrator software (FOSS Electric A/S, Hillerød, Denmark), while ISIscan Nova software (FOSS Electric A/S, Hillerød, Denmark) was used for DS2500 (FOSS Electric A/S, Hillerød, Denmark).
In addition, MilkoScan FT6000 (FOSS Electric A/S, Hillerød, Denmark) also provided fat, protein, casein and lactose percentages of the milk samples, and a Fossomatic FC (FOSS Electric A/S, Hillerød, Denmark) was used to determine SCC. The SCC was then transformed to somatic cell score (SCS) following equation: SCS = 3 + log2 (SCC/100), where SCC was expressed as cells/μL (Wiggans and Shook Citation1987).
Chemometric and statistical analysis
For each instruments, the PCA was performed using statistics package of R version 4.0.3 (R Core Team Citation2020) and visualised with ‘ggbiplot’ package (Vu Citation2011). The PLS-DA was performed using the DiscriMiner package (Sanchez Citation2013) in R version 4.0.3 (R Core Team Citation2020), which also provides the variable importance in projection (VIP) score. For the PLS-DA, the dataset was divided into a train set (8 farms/group) and a test set (4 farms/group). The ORG test set included farms with and without lactating cows in the pasture. The CONV test set included farms with and without external paddock. Both test set included farms rearing also non-Holstein-Friesian cows. Before building the model, low signal-to-noise ratio spectral regions (MIR: 3690–2990 cm−1 and 1680–1580 cm−1; Vis/NIR: 1392–1535 nm) were discarded. Only wavelengths VIP score >1 were retained for the final model. The number of components (n = 2) retained for the final model was decided based on the improvement of error rate of the test set before applying the VIP selection criterion. Moreover, the same number of components were retained to build the final PLS-DA model in both instruments to be able to compare the results. The performance of the PLS-DA models was assessed by calculating error rate, accuracy, sensitivity, specificity, false positive rate and precision. Statistics for sensitivity and the specificity have been calculated using the test for one proportion of MedCalc statistical software considering the H0=50% (https://www.medcalc.org/calc/test_one_proportion.php).
Feed chemical composition was investigated through a PROC MIXED of SAS ver. 9.4 (SAS Institute Inc., Cary, NC) with type of production as fixed effect and farm nested within type of production as a random effect. Bulk milk chemical composition (fat, protein, casein, lactose) and SCS were investigated through a PROC MIXED of SAS ver. 9.4 (SAS Institute Inc., Cary, NC) with repeated measures. Month of sampling, type of production and their interaction as fixed effects, and farm nested within type of production as a random effect. Results are reported as least squares means (LS-means) and significance established as p<.05.
Results and discussion
Principal component analysis
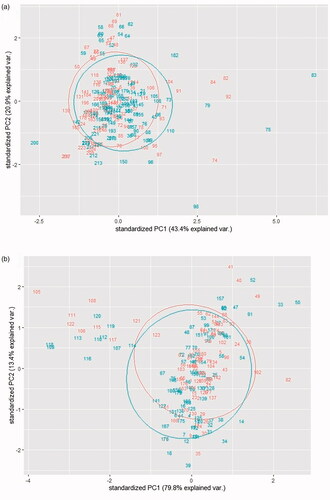
A 64.3% of the variance was explained using the MIR spectra (PC1 = 43.3%; PC2 = 20.9%). A greater proportion (93.2%) of the variance was explained using the Vis/NIR spectra (PC1 = 79.8%; PC2 = 13.4%). However, the plot revealed a poor ability to discriminate ORG from CONV under our management conditions (Figure ) which are in agreement with the few differences observed in milk composition. Milk from CONV farms showed a similar fat (3.93 ± 0.09%) and lactose (4.83 ± 0.02%) content, greater protein (3.37 ± 0.04%; p=.039) and casein (2.64 ± 0.03%; p=.050) content, and lower SCS (3.91 ± 0.10; p=.010) than milk from ORG farms (fat, 3.75 ± 0.09%; lactose, 4.81 ± 0.02%; protein, 3.25 ± 0.04%; casein, 2.53 ± 0.03%; SCS, 4.30 ± 0.10). In pasteurised retail milks (ORG and Non-ORG) collected from supermarkets in Netherlands, Liu et al. (Citation2018) indicated that a 92% and 35% of the total variance in portable NIR (pNIR) and Fourier-transform NIR (FT-NIR), respectively, were explained. As they suggested, the drop of the explained variance that we observed with MIR could be related to the wider wavelength range of MIR compared to Vis/NIR. They reported that a wider wavelength range do not guarantee more information that can help to separate both groups. In line with our results (Figure ), they evidenced the noise produced by Non-ORG pasture-based milk when trying to discriminate ORG milk. In our study, only seven out of 12 of the ORG farms used the pasture during lactation, which will be ORG non-pasture-based milk using Liu et al. (Citation2018) terminology, and the TMR formulation of the lactating diets of all the farms included maize.
Figure 1. Standardised principal component 1 (PC1) and principal component 2 (PC2) plot with a normal confidence ellipse (95% confidence level) for each category built: (a) using mid-infra-red spectroscopy and (b) using Vis/NIR spectroscopy. In green, conventional farms; in orange, organic farms. Graph created with R-software.
Partial least squares-discriminant analysis
Absorbance and VIP after removing the low signal-to-noise ratio wavelength for both instruments are shown in Figure . Absorbance in the MIR region did not reveal differences between both groups, being the two spectra overlapping (Figure ). Although several regions in the MIR spectra showed a VIP score between 1 and 2, those regions did not always correspond to peaks in the absorbance of the raw spectra (Figure ). The VIP peaks observed around 1045 cm−1 and 1076 cm−1 have been associated to lactose content (Grelet et al. Citation2015); around 1390 cm−1, 1743 cm−1, and between 2800 cm−1 and 3000 cm−1 to fat content (De Marchi et al. Citation2009; Grelet et al. Citation2015); between 1446 cm−1 and 1470 cm−1 to fat and protein content (Soyeurt et al. Citation2009; Grelet et al. Citation2015); and around 1550 cm−1, to protein content (De Marchi et al. Citation2009; Grelet et al. Citation2015).
Figure 2. Absorbance of organic (grey dots) and conventional (black dots) milk, and variable in projection (VIP) score (black) for two components after removing signal-to-noise ratio wavelength of the spectra collected using: (a) MIR spectroscopy and (b) Vis/NIR spectroscopy. Black dashed-line indicates the threshold value of 1 for VIP score.
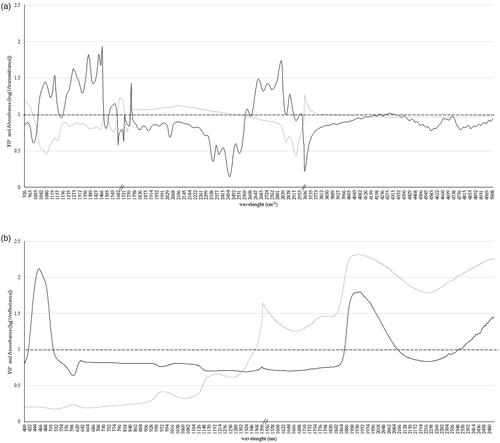
For Vis/NIR (Figure ), the absorbance was slightly greater in ORG than in CONV samples. Particularly, from 1613 nm to 1707 nm, from 1769 nm to 1836 nm and from 2192 nm to 2253 nm. Despite wavelengths in the visible region of the spectra provided more information to discriminate ORG from CONV milk (highest VIP ∼2.1), only a small wide peak in the absorbance was observed between 580 nm and 640 nm on the raw spectra. In the NIR region, the VIP was above 1 from 1878 nm to 2103 nm (highest VIP ∼1.7) and from 2366 nm to 2500 nm (highest VIP ∼1.4) (Figure ). Those wavelengths agreed with peaks observed in the absorbance of the raw spectra (Figure ). The VIP peak observed around 1,940 nm has been associated with water (Coppa et al. Citation2010); and around 2466 nm to protein (Núñez-Sánchez et al. Citation2016). Although ORG and CONV milk samples did not differ in their total fat content (p=.144) and slightly differ in their protein content (p=.039), the regions where VIP peaked suggested that both categories could differ in relation to their detailed protein and fat profile. Hein et al. (Citation2016) reported a higher saturated, polyunsaturated and short-chain fatty acids, C16:0 and C14:0 content in ORG than CONV, while monounsaturated and long-chain fatty acids, C18:1 and C18:0 were higher in CONV than ORG milk. Moreover, Benbrook et al. (Citation2013) reported 26% lower n6-fatty acids content and 62% greater n3-fatty acids content in retailed ORG than in CONV milk. However, those studies did not include ORG and CONV milk samples from cows reared under similar conditions.
The final PLS-DA models revealed a slightly higher error rate with MIR (Table ) than with Vis/NIR (Table ), being the accuracy of the model ∼50% and ∼60% in the test set, respectively. A greater capacity to correctly identify the CONV milk samples (specificity) than the ORG milk samples (sensitivity) was observed using MIR and Vis/NIR spectra. The specificity of the models was greater (p<.001) that 50% for both devices (MIR, 95% CI proportion 61.4–89.9%; Vis/NIR, 95% CI proportion 62.9–92.8%); while sensitivity was not (MIR, 95% CI proportion 16.1–47.3%; Vis/NIR, 95% CI proportion 27.2–63.8%). The false positive rate was slightly greater when using MIR than when using Vis/NIR spectra. The precision of the models, which was defined as the correctly ORG predicted among all ORG predicted, was greater when using Vis/NIR than MIR spectra.
Table 2. Confusion matrix and statistical measures of performance of the partial least squares-discriminant analysis model for two components for the classification of organic and conventional bulk milk in the MIR region.
Table 3. Confusion matrix and statistical measures of performance of the partial least squares-discriminant analysis model for two components for the classification of organic and conventional bulk milk in the Vis/NIR region.
Liu et al. (Citation2018) also reported a lower sensitivity and greater specificity with both devices, pNIR (sensitivity = 59%, p∼.551; specificity = 81%, p∼.016) and FT-NIR (sensitivity = 71%, p∼.164; specificity = 83%, p∼.029) when considering ORG and Non-ORG milk as we did with MIR and Vis/NIR (Tables and ). In Liu et al. (Citation2018), Non-ORG milk included CONV and Non-ORG pasture based milk which is similar to our design where the ORG group included some farms that declared not to having the lactating animals on the pasture. As highlighted when discussing the PCA models, the moderate accuracy of our models could be related to the similarity of management and the inclusion of maize in the lactation diets in both groups of farms. Bergamaschi et al. (Citation2020) have pointed that the capacity of infrared technologies to discriminate milk relies on the capacity to detect chemical modifications due to different dairy systems.
Although we conducted our study 5 years later than Schwendel et al. (Citation2015)’s review, we faced the same issues when trying to compare our results with the literature. The lack of control of most studies in the variables that influence milk composition do not allow us to attribute the results described by the literature unequivocally to ORG and CONV raising conditions. Schwendel et al. (Citation2015) also stated that markers used to distinguish ORG from CONV milk failed when the animal diets in both groups were similar; for example, when using the carbon stable isotope ratio (13C) in milk method, which is based on the fact that maize is a common used concentrate feed for CONV cows (Schwendel et al. Citation2015). Maize is a C4 plant which uses a different biosynthetic pathway to fix CO2 than other common feed plants, increasing 13C isotope in the plant and, therefore, in cow’s milk. However, if maize is used in both groups, ORG and CONV, as it was established in our experimental design, it is not possible to differentiate the 13C isotope of the maize included in the ORG group concentrate from the one used in the CONV group (Schwendel et al. Citation2015).
Conclusions
Our results showed that PCA was not able to separate both groups in order to identify ORG and CONV milk. Both instruments, MIR and Vis/NIR, showed a similar ability to discriminate ORG from CONV milk using PLS-DA. The sensibility of the models was quite low, but the specificity was slightly above the 50% chance. The similarities of the herds included in both groups (e.g. breed and inclusion of maize in the TMR) could explain the low accuracy of the discriminant models.
Acknowledgements
The authors thank Granarolo S.p.A. (Bologna, Italy) for providing the samples.
Disclosure statement
The authors declare no conflict of interest.
Data availability statement
The data presented in this study are available free of charge for any user upon reasonable request from the corresponding author (CLM).
Additional information
Funding
References
- Aulrich K, Molkentin J. 2009. Potential of near infrared spectroscopy for differentiation of organically and conventionally produced milk. Landbauforsch Volkenrode. 59:301–308.
- Benbrook CM, Butler G, Latif MA, Leifert C, Davis DR. 2013. Organic production enhances milk nutritional quality by shifting fatty acid composition: a United States-wide, 18-month study. PLOS One. 8(12):e82429.
- Benedet A, Manuelian CL, Penasa M, Cassandro M, Righi F, Sternieri M, Galimberti P. 2018. Factors associated with herd bulk milk composition and technological traits in the Italian dairy industry. J Dairy Sci. 101:1–10.
- Bergamaschi M, Cipolat-Gotet C, Cecchinato A, Schiavon S, Bittante G. 2020. Chemometric authentication of farming systems of origin of food (milk and ripened cheese) using infrared spectra, fatty acid profiles, flavor fingerprints, and sensory descriptions. Food Chem. 305:125480.
- Coppa M, Ferlay A, Leroux C, Jestin M, Chilliard Y, Martin B, Andueza D. 2010. Prediction of milk fatty acid composition by near infrared reflectance spectroscopy. Int Dairy J. 20(3):182–189.
- De Marchi M, Penasa M, Zidi A, Manuelian CL. 2018. Invited review: use of infrared technologies for the assessment of dairy products—applications and perspectives. J Dairy Sci. 101(12):10589–10604.
- De Marchi M, Fagan CC, O'Donnell CP, Cecchinato A, Dal Zotto R, Cassandro M, Penasa M, Bittante G. 2009. Prediction of coagulation properties, titratable acidity, and pH of bovine milk using mid-infrared spectroscopy. J Dairy Sci. 92(1):423–432.
- Esteki M, Simal-Gandara J, Shahsavari Z, Zandbaaf S, Dashtaki E, Vander Heyden Y. 2018. A review on the application of chromatographic methods, coupled to chemometrics, for food authentication. Food Control. 93:165–182.
- European Commission. 2009. Commission regulation (EC) no 152/2009 of 27 January 2009 laying down the methods of sampling and analysis for the official control of feed. Off J Eur Union. 54:1–130.
- Grelet C, Fernández Pierna JA, Dardenne P, Baeten V, Dehareng F. 2015. Standardization of milk mid-infrared spectra from a European dairy network. J Dairy Sci. 98(4):2150–2160.
- Hein L, Buitenhuis AJ, Gregersen SB, Larsen LB, Demirovic D, Warnecke S, Nielsen NH, Munk A, Sørensen LP, Pedersen J, Kargo M. 2016. Detailed milk fatty acid profiling of the Danish dairy cattle population. In: Proceedings of the 40th International Committee for Animal Recording (ICAR) Meeting; Puerto Varas, Chile.
- Liu N, Parra HA, Pustjens A, Hettinga K, Mongondry P, van Ruth SM. 2018. Evaluation of portable near-infrared spectroscopy for organic milk authentication. Talanta. 184:128–135.
- Mertens DR. 2002. Gravimetric determination of amylase-treated neutral detergent fiber in feeds with refluxing in beakers or crucibles: collaborative study. J AOAC Int. 85:1217–1240.
- Núñez-Sánchez N, Martínez-Marín ALL, Polvillo O, Fernández-Cabanás VMM, Carrizosa J, Urrutia B, Serradilla JMM. 2016. Near infrared spectroscopy (NIRS) for the determination of the milk fat fatty acid profile of goats. Food Chem. 190:244–252.
- R Core Team. 2020. R: a language and environment for statistical computing. Vienna, Austria: R Foundation for Statistical Computing.
- Rana J, Paul J. 2017. Consumer behavior and purchase intention for organic food: a review and research agenda. J Retail Consum Serv. 38:157–165.
- Rodríguez-Bermúdez R, Miranda M, Orjales I, Ginzo-Villamayor MJ, Al-Soufi W, López-Alonso M. 2020. Consumers’ perception of and attitudes towards organic food in Galicia (Northern Spain). Int J Consum Stud. 44(3):206–219.
- Sanchez G. 2013. DiscriMiner: tools of the trade for discriminant analysis. R package version 0.1-29. https://CRAN.R-project.org/package=DiscriMiner.
- Schwendel BH, Wester TJ, Morel PCH, Tavendale MH, Deadman C, Shadbolt NM, Otter DE. 2015. Invited review: organic and conventionally produced milk—an evaluation of factors influencing milk composition. J Dairy Sci. 98(2):721–746.
- Soyeurt H, Bruwier D, Romnee J-M, Gengler N, Bertozzi C, Veselko D, Dardenne P. 2009. Potential estimation of major mineral contents in cow milk using mid-infrared spectrometry. J Dairy Sci. 92(6):2444–2454.
- Van Soest PJ, Robertson JB, Lewis BA. 1991. Methods for dietary fiber, neutral detergent fiber, and nonstarch polysaccharides in relation to animal nutrition. J Dairy Sci. 74(10):3583–3597.
- Vu VQ. 2011. ggbiplot: a ggplot2 based biplot. R package version 0.55. http://github.com/vqv/ggbiplot.
- Wiggans GR, Shook GE. 1987. A lactation measure of somatic cell count. J Dairy Sci. 70(12):2666–2672.
- Willer H, Schlatter B, Trávnícek J, Kemper L, Lernoud J, editors. 2020. The world of organic agriculture: statistics and emerging trends 2020. 21st ed. Bonn, Germany: Research Institute of Organic Agriculture (FiBL), Frick, and IFOAM – Organics International.