
Abstract
Membranous (M) cells are believed to special gateways of the mucosal immune system because of sampling antigens from the gut lumen. However, little is known regarding the effect of diets on regulating M cells. So, we examined the ultrastructural characteristics of microfold (M) cells in rabbits fed different dietary fibre-to-starch ratios (I: 2.3, II: 1.9, III: 1.4, and IV: 1.0). Appendix tissues were obtained from rabbits at 52, 62, 72, and 82 d. Diet I had higher M cell area than diet IV (p < .01) during total experiment. Using electron microscope, we observed apparently intestinal damage and M cells apoptosis in diet I and IV compared to diet II and III (p < .001), except for 62d. By estimation of M cell deviations from normal structure and TNF-a mRNA expression in appendix from different diet treatments, it is apparent that degree of deviations from normal structure in diet I, IV was higher than diet II, III, except for 62 days. The appendix TNF-a mRNA levels were significantly (p < .01) increased in diet I, IV at 52, 62, 72, 82 days compared to diet II, III. These data elucidated that an imbalance dietary fibre-to-starch ratio induced the structural damage of M cell.
High fibre diet can increase M cell area compared to low fibre diet for rabbits.
High fibre or starch diets caused rabbits’ appendix mucosal damage and M cell apoptosis.
High fibre or starch diets significantly increased the appendix TNF-A mRNA levels.
Highlights
Introduction
Intestinal microfold (M) cells play a critical role in intestinal mucosal immune response by transporting bacteria, viruses, particles and antigens across the epithelium to immune cells located in Peyer’s patches and other mucosal sites (Rouch et al. Citation2016). The rabbit appendix contains many M cells and is often used to determine M cell-specific epitopes (Roy et al. Citation1987; Montcourrter et al. Citation1996). The M cell surface has short, widely spaced microvilli and deeply invaginated basolateral surfaces that form intraepithelial pockets which accommodate lymphoid cells and macrophages (Mantis et al. Citation2000; Zhong et al. Citation2007). Additionally, the intraepithelial pocket contains vimentin (Fujimura and Iida Citation2001; Jepson et al. Citation1992), a well-established marker of rabbit M cells (Gebert et al. Citation1992; Zhu et al. Citation2013).
The M cell apical cytoplasm contains an intracellular vesicular transport system that facilitates phagocytosis and transcellular particulate movement (Neutra and Kozlowski Citation2006). Ultrastructural studies have demonstrated that proteins infused into the lumen are incorporated into these vesicles, transported rapidly across the narrow apical cytoplasm, and released into the sequestered intraepithelial space by exocytosis (Gebert et al. Citation2000; Kucharzik, Lugering, Lugering, et al. Citation2000). Here, the proteins may be ingested by phagocytic cells or ‘sampled’ by lymphocytes (Rubas et al. Citation1990). Rabbit M cells constitute approximately 50% of follicle epithelial cells, enclose numerous intraepithelial leukocytes, and have high transport efficiency. Thus they are frequently used to study transepithelial antigen transport (Pappo et al. Citation1991; Ermak et al. Citation1995).
Efficient M-cell-mediated sampling of gut luminal antigens is important in the induction of mucosal immune responses (Hase et al. Citation2009; Wang et al. Citation2011; Kanaya et al. Citation2012; Lelouard et al. Citation2012). Even though specific nutrients are important in the development and function of the immune system (Schley and Field Citation2002; Anderson et al. Citation2009), little is known the effect of dietary fibre on M cell immune function. Dietary fibre decreases the incidence of bacterial translocation across the gut barrier, which suggests that this nutrient modulates immunity (Gómez-Conde et al. Citation2007; Van Hung and Suzuki Citation2016). Our previous study showed that dietary fibre regulates the number of M cells in gut-associated lymphoid tissue of rabbits including the appendix and sacculus rotundus (Zhu et al. Citation2013). However, there is little information on the effect of dietary fibre on the ultrastructure of M cells.
The aim of our study was to investigate the ultrastructure changes of M cells and appendix mucosa integrity with different dietary NDF levels. M cells were visualised by staining with a monoclonal antibody against vimentin (clone V9). Measurement of M cells area was performed by immunohistochemistry. Additionally, we examined M cells by transmission electron microscopy (TEM) and scanning electron microscopy (SEM).
Materials and methods
Animals, diets, and housing
We used 200 New Zealand weanling rabbits of both sexes (half/treatment; 35 d of age; 1,110 ± 35 g body weight). We prepared four diets (I, II, III, and IV) containing different NDF levels (34.65, 30.75, 28.63, 25.85%, respectively). The feeding trial had a seven-day adaptation period followed by a 40-day experimental period. There were 50 healthy rabbits per treatment group, and each group was assigned one experimental diet. Rabbits were individually housed in a cage (60 × 40 × 40 cm) at 15–25 °C in an environmentally semi-controlled building with ad libitum access to food and water.
Growth trail
All rabbits were weighed at the beginning (35 days) and the end (82 days) of the experimental period. The average daily gain (ADG) and mortality was recorded. The average daily intake (ADI) and feed to gain (F/G) ratio were calculated at the ending of whole experiment.
Chemical analyses of the experimental diets
The diets were formulated according to the values established by the National Research Council (NRC 1977) and the method of de Blas and Wiseman (Citation2010). Food was administered as pellets (4 mm diameter) (Table ). No antibiotics were used. Fibre levels in the experimental diets were analysed by Association of Official Analytical Chemists methods (National Standards Recommended Methods, China). Crude fibre was determined by the acid-base method; NDF and acid detergent fibre were determined according to Van Soest et al. (Citation1991).
Table 1. Composition and nutrient levels of the basal diet (air-dried, %).
Tissue isolation and immunohistochemistry
Five healthy rabbits per group were euthanized at 52, 62, 72, and 82 d of age to harvest the appendix. Representative tissue sections were fixed in 10% buffered formalin and embedded in paraffin. For routine microscopy, sections 5-µm thick were immunohistochemically stained using a PV-9002 Plink-2 plus polymer horseradish peroxidase (HRP) mouse primary antibody detection system (ZSGB-BIO, Beijing, China) and DAB detection kit. The antibodies included vimentin antibody V9 and polyclonal HRP-conjugated anti-mouse IgG (both from ZSGB-BIO). For anti-vimentin staining, rabbit kidney samples were used as positive controls. For the negative controls, goat serum was used instead of primary antibodies. The results were observed using an optical microscope.
M Cell area calculation and analysis
Tissue isolation and immunohistochemistry referenced previous research (Zhu et al. Citation2013). The area of randomly selected M cells was calculated using ImageJ (Version 1.47v, NIH, USA). The scale to calibrate ImageJ software was established by measuring a known distance. The mean cell area was calculated for each experimental group in at least five independent samples (n = 5) and in triplicate with a minimum of 60 M cells per condition. At least 960 M cells from different treatments (included four diets and four time periods) were analysed.
Histological observation of M cells by electron microscopy
The methods for preparation of electron microscopy referred to Kucharzik, Lügering, Rautenberg et al. (Citation2000) reported. For morphological studies, sections were contrasted with 5% UO2 (CH3COO)2 and 0.1% (C6H5O7)2Pb3 and examined under a JEM-1200EX transmission electron microscope.
For SEM, samples were fixed in phosphate-buffered 1.0% OsO4 (pH 7.4) for 2 h, then overnight in 1% tannic acid to improve image quality, then in 1.0% OsO4 for 1 h, before dehydration with a graded ethanol series. Sections were then subjected to critical-point drying and evaporation-coating with gold palladium and observed under a KYKY-1000B scanning electron microscope.
The observation of integrity in appendix mucosa
In order to evaluate the number of villi and severity of cell damage by SEM images, we have revised the method by Cassidy et al. (Citation1981) reported, and were randomly selected to be graded on the following scales by the degree of deviation from normal appearance: 1= apical damage of cell, disordered microvillar array; 2= loss of most microvilli and tears in the epithelial membrane; 3= loss of M cell microvilliar and apical mucus; 4= cavity of M cell. The experiment data were counted repeatedly and assessed by two microscopists, which agreement above 90% between two microscopists.
Real-time quantitative polymerase chain reaction (qPCR) for expression of TNF-a mRNA
Specimens (≈100 mg) were pulverised with separate, sterilised, and frozen mortar and pestles. RNA was extracted using phenol-based extraction methods, and specimens were aliquoted and refrigerated. The quantity and quality of RNA was assessed using a DU 640 spectrophotometer (Beckman Coulter, Brea, CA, USA). The RNA concentration was determined by measuring absorbance at 260 nm. The purity of the extracts was evaluated based on the ratio of the absorbance at 260 and 280 nm, and values between 1.8 and 2.0, respectively, were obtained. The TNF-a primer used in this work reported by Yang et al. (Citation2010), and using GAPDH primers reported by Xing et al. (Citation2013). Reverse transcription (RT) was done using a PrimeScript™ RT Reagent kit with gDNA Erase (Perfect Real Time; TaKaRa Bio, Shiga, Japan). qPCR was carried out using SYBR® Premix Ex Taq (RR420A; TaKaRa Bio). Each reaction contained: 10 μL of 2× SYBR Premix Ex Taq, 0.4 μL ROX Reference Dye II (50×) in the case of glyceraldehyde 3-phosphate dehydrogenase (GAPDH), TNF-a and 0.5 μL of PCR forward and reverse primers each in the case of 2 M (10 μM), 2.5 μL cDNA, and water to a final volume of 20 μL. Amplification was carried out in 0.2-mL real-time PCR tubes (Axygen™; Corning, Corning, NY, USA) placed in the 96-well rotor of a 7500 real-time PCR instrument (Applied Biosystems, Foster City, CA, USA). PCR parameters were initial denaturation at 95 °C for 2 min to activate Platinum Tag DNA Polymerase, followed by 40 cycles of 15 s at 95 °C, 15 s at 60 °C, with collection of the fluorescence signal at the end of each cycle. For melting-curve data, the temperature was increased by 1 °C from 65 to 95 °C. Data were collected and processed using an I7500 real-time detection system (Applied Biosystems). GAPDH was used as an internal control. All results were repeated in five independent experiments and performed in triplicate each time. The primers were as follows: TNF-a F-5′-GTGACGAGCCTCTAGCCCACGTAGT-3′, R-5′-GACCGCTGAAGAGAACCTGG-GAGTA-3′;GAPDH F-5′-TGCCACCCACTCCTCTACCTTCG-3′,R-5′-CCGGTGGTTTGAGGGCTCTTACT-3′.
Statistical analysis
The study had a completely randomised design with diets and animal age as the two main sources of variation. Data were analysed by ANOVA using the SAS 9.2 generalised linear model (SAS Inst. Inc., Cary, NC, USA). Statistical significance was set at p < .05.
Results
Growth performances
ADG, ADI, F/G and mortality are summarised in Table . ADG in Diet II, III groups were than that of Diet I (p < .05). Only ADI was not affected by diets. F/G was the lowest in Diet II compared with other diets (p < .05). However, mortality was lower with Diet I.
Table 2. Performances during the growth trail (42–82 days) depending on the diet (n = 50)c.
M Cell area in different diet groups
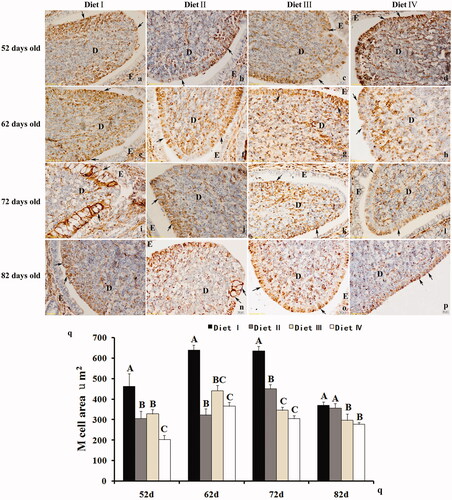
M cells of rabbit appendix were intensely stained by a specific antibody against vimentin. The vimentin-positive cells were present in the appendix dome area (Figure ). By analysing this section from different treatment groups, we observed significant changes of rabbits’ M cell area (µm2, mean ± SD) from same dietary treatment groups in of different ages. Shown in Figure , M cell area was the largest in the high fibre group (Diet I; 52 d, 62 d, 72 d; p < .01) comparing with other groups, except 82 days.
Figure 1. The comparison of M cells area among different dietary treatments (Diet I: 34.65% NDF; Diet II: 30.75% NDF; Diet III: 28.63% NDF; Diet IV: 25.85% NDF). M cell area were significantly increased in rabbits’ appendix feeding high NDF diet (Diet I) comparing with other diet groups in 52, 62, 72 days, except 82 days (Figure ), arrow, p < .01). Different capital letters represent significant (Figure , p < .01) differences in mean values.
Electron microscopy of M cells in inflamed rabbit appendix mucosa
The high fibre diet produced a significant increase in M cell area, therefore, we investigated M cell using SEM and TEM. Based on SEM results, appendix mucosa in Diet I showed fewer M cell numbers than were present in most of the other three diet groups (Figure ). This observation was in accordance with the results of above immunohistochemistry. However, the feeding different dietary NDF levels have significantly effect on the mucosal surface topography of the appendix (Figure ). In high fibre (Diet I) and low fibre (Diet IV) feeding animals there was an apparent damage which consisted of massive spaced holes and complete loss of microvilli clearly deviated from normal cell (Figure ). The evaluation of degree of cell damage shown that the appendix mucosa exhibited fewer cell damage in group I and IV on 52, 72, 82 d than diets II and III (p < .01, Figure ). However, the appendix mucosa of the feeding 28.63% NDF (Diet III) was also more intact than those of other groups animals during total experiment period (p < .01, Figure ), which has greater quantities of mucus and specific microvilli to cover on surface of M cell compared to other three groups (Figure ). Additionally, intestinal bacteria from these groups adhered to the microvilli of the M cell surface (Figure ).
Figure 2. Scanning electron microscopy of appendix tissue cells from different dietary treatments (Diet I: 34.65% NDF; Diet II: 30.75% NDF; Diet III: 28.63% NDF; Diet IV: 25.85% NDF). (a–d) M cell morphology in diets I, II, III and IV, respectively (bar, 50 µm). (e, f) Rod-shape bacteria associated with enterocytes and M cells in the appendix (bar, 5 µm in e and 1 µm in f). (g–j) Morphological features of M cells in Diet I (g and i) and Diet IV (h and j) (bar, 5 µm in g–i and 1 µm in j). There were damaged M cells, with large cavities and no microvilli (open arrows). The surface of some M cells was covered with mucous (k). Luminal bacteria located in the microvilli were visible (I) (bar: 5 µm in k and 1 µm in i).
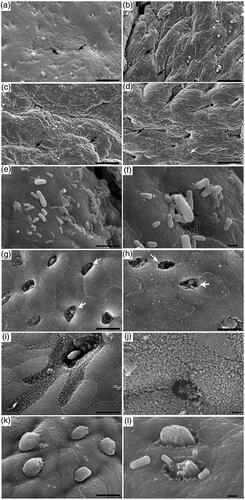
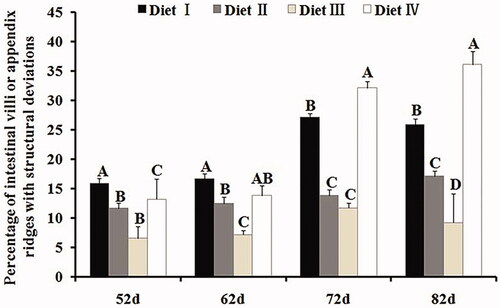
Figure 3. Effects of feeding different dietary NDF levels (Diet I: 34.65% NDF; Diet II: 30.75% NDF; Diet III: 28.63% NDF; Diet IV: 25.85% NDF) on appendix mucosal morphology. The histogram shows the number (mean ± SD for a minimum of 200 measurements per condition) of appendix microvilli or M cell which deviated from normal structure when degree of distortion was ranked from 0.0 to 4.0. Different capital letters represent significant (p < .01) differences in mean values. The experiment was performed using New Zealand rabbits.
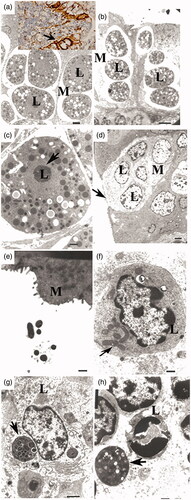
The TEM results revealed that the follicle-associated epithelium of rabbit appendix contained large numbers of M cells. Notably, M cell morphology of Diet I was different than that of other groups (Figure ). Normal M cells have broad apical surfaces, with short microfolds or microvilli (Figure ). However, the M cells of Diet I had an increased number of interstices between lymphoid cells, large vacuoles, and blebbing in the apical cytoplasm of M cells, which revealed increased transcytotic activity (Figure ), and condensed chromatin of the nucleus (Figure ). These morphological features are associated with apoptosis. The low fibre diet (Diet IV) induced similar lesions at 72–82 d. Even though we observed vesicles, vacuoles, and multivesicular bodies in M cell cytoplasm and underlying lymphocytes in diets II and III, the morphology of the M cells and the junctions of lymphocytes remained basic integrity.
Figure 4. Transmission electron microscopic features of M cells were shown during intestinal inflammation induced by high and low dietary fibre diets. M cells had characteristic features of apoptosis with an extremely thin cytoplasm and vacuole (open arrow) and chromatin condensation of the lymphocyte nucleus (L) in the M cell pocket (arrowhead) (bar, 2 µm in d). Insert: immunolabeling of vimentin results in the swelling of M cells. Higher magnification (c) shows the disruption of the chromatin of lymphocyte cells. M cells appear to be pushed close to the surface of the intestine (bar, 500 nm in e). f–h represent the lymphocyte cytoplasm in the M cell pocket vesicles (bar, 500 nm in f) and multivesicles (g, h; bar, 2 µm in g and 500 nm in h).
The estimation of deviations from normal structure and TNF-a mRNA expression in appendix from different diet treatments
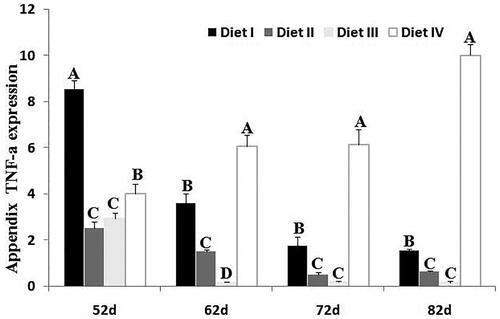
The deviations from normal structure were estimated quantitatively and the results are depicted in Figure . It is apparent that degree of deviations from normal structure in Diet I, IV was higher than Diet II, III, except for 62 days. As shown in Figure , appendix TNF-a mRNA levels were significantly (p < .01) increased in Diet I, IV at 52, 62, 72, 82 days compared to Diet II, III, which has a same trend above.
Figure 5. TNF-a mRNA levels in appendix. Histograms showed expression mRNA level in rabbits fed different dietary NDF levels (Diet I: 34.65% NDF; Diet II: 30.75% NDF; Diet III: 28.63% NDF; Diet IV: 25.85% NDF) at 52, 62, 72, 82 d (mean ± SD, n = 5). The mRNA expression profile of TNF-a was quantified by semi-quantitative RT-PCR using GAPDH as an internal control. The results in the lower panels were derived from scans of the upper panels. The capital letter represents p < .01 among groups.
Discussion
Dietary fibre prevents digestive disorders in growing rabbits (Gidenne Citation2003), and the appropriate dietary levels range between 160 and 185 g/kg ADF and between 320 and 350 g/kg NDF (De Blas Citation2013). In our experiment, ADG and F/G were best when the dietary fibre was moderate (28.63–30.75% NDF). The mortality increased with decreasing dietary fibre levels. M cells represent the ‘gateway’ for mucosal immune responses. However, little is known about the effects of different NDF levels on M cells. Our study findings showed that M cell area significantly increased (p < .01) in the high fibre diet (Diet I). Histochemical studies of appendix tissues revealed interesting correlations between diets and M cells.
To characterise the effects of dietary NDF levels on M cells, we used SEM and TEM. SEM results revealed the presence of damaged M cells with large cavities and protruded M cells into the gut lumen in Diet I. The high fibre diet stimulated M cell apoptosis. Interestingly, M cell number significantly increased (Zhu et al. Citation2013). So, a strong correlation between M cell number and dietary fibre levels was found. We suggest that exceeding dietary fibre has stimulated lymphoid follicles hyperplasia because of delayed intestinal transit time (Pierre et al. Citation1997; Field et al. Citation1999), which consequently resulted in a significant increase in M cell number. TEM results revealed the presence of large vacuoles, swollen mitochondria, blebbing in the cytoplasm of M cells, and ruptured apical tubulovesicular network in Diet I, which mean long-term fibre stimulation may aggravate the burden of intestinal mucosa and ultimately exceed the antigen transport capacity of M cells. M cells continually swallowed a lot of antigen from intestinal cavity to cause abnormal histology and possible damage to intestinal cells or even apoptosis. There is, therefore, a primary research hypothesis of this study was that higher dietary fibre levels would lead to M cell apoptosis. This phenomenon was due to release perforin by amount of lymphocytes within and underneath the bottom of M cells (Koizumi et al. Citation1991). Additionally, the morphological effects of M cells were partly due to the squeezing of lymphocytes in the pockets of M cells. On the other hand, the percentage of intestinal villi or appendix ridges with structural deviations from Diet I, on statistic analysis, was significant higher than others groups (p < .01) at 52, 72, 82 d. In addition, TNF-a is recognised as a sensitive biomarker of proinflammatory to causing to inflammation (Neurath et al. Citation1997; Yang et al. Citation2018). Our study revealed that Diet I (high fibre) and Diet IV (low fibre) induce the higher expression of inflammatory biomarker than Diets II and III in the rabbits’ appendix (p < .01). The result was inferred that excessive or low intake fibre resulted in inflammation damage in the appendix mucosa. The finding was consistent with past studies, which reported that M cell number increased in proportion to the degree of inflammation (Cuvelier et al. Citation1994; Kucharzik, Lügering, Rautenberg et al. Citation2000; Barreau et al. Citation2007). In conclusion, in the absence of diarrhoea, there is rupture of the follicle-associated epithelium of M cells. Moreover, our previous study suggested that increasing dietary fibre level improve mucosal immunity function at only earlier stage of rabbits’ growth (Zhu et al. Citation2013). Even though the pathophysiology remains unclear, one may speculate that an increase in M cell number during inflammation allows antigens to make closer contact with the mucosal immune system and induce an immune response (Kucharzik, Lügering, Rautenberg et al. Citation2000). Therefore, we can exclude entirely the possibility that these antigens from intestinal tract target the M cells and stimulate abnormal immunological responses. Moreover, Diet III (NDF: 8.63%) was sufficient to decrease the intestinal inflammation.
Conclusion
In conclusion, the present study showed higher and lower NDF diets results in appendix mucosal inflammation, and therefore caused M cellular damage of the morphology and ultrastructure. We believed that dietary NDF level is directly associated with M cell integrity.
Ethical approval
Animal experiments were all approved by the Institutional Animal Care and Use Committee of Shandong Agricultural University and performed per the Guidelines for Experimental Animals, Ministry of Science and Technology, China.
Acknowledgements
We would like to thank our anonymous reviewers and our colleagues from the Animal Nutrition Laboratory for their valuable critiques and suggestions.
Disclosure statement
No potential conflict of interest was reported by the author(s).
Data availability statement
All authors agreed that the raw data required to reproduce these findings cannot be shared at this time as the data also forms part of an ongoing study.
Additional information
Funding
References
- Anderson JW, Baird P, Davis RH, Ferreri S, Knudtson M, Koraym A, Waters V, Williams CL. 2009. Health benefits of dietary fiber. Nutr Rev. 67(4):188–205.
- Barreau F, Meinzer U, Chareyre F, Berrebi D, Niwa-Kawakita M, Dussaillant M, Foligne B, Ollendorff V, Heyman M, Bonacorsi S, et al. 2007. CARD15/NOD2 is required for Peyer's patches homeostasis in mice. PLOS One. 2(6):e523.
- Cassidy MM, Lightfoot FG, Grau LE, Story JA, Kritchevsky D, Vahouny GV. 1981. Effect of chronic intake of dietary fibers on the ultrastructural topography of rat jejunum and colon: a scanning electron microscopy study. Am J Clin Nutrit. 34(2):218–228.
- Cuvelier CA, Quatacker J, Mielants H, Vos MD, Veys E, Roels HJ. 1994. M-cells are damaged and increased in number in inflamed human ileal mucosa. Histopathology. 24(5):417–426.
- de Blas C, Mateos GG. 2010. Feed formulation. In: C. de Blas, C, Wiseman J, editors. The Nutrition of the Rabbit.2nd ed.USA(NY): CABI; p. 222–232.
- De Blas JC. 2013. Nutritional impact on health and performance in intensively reared rabbits. Animal. 7:102–111.
- Ermak TH, Dougherty EP, Bhagat HR, Kabok Z, Pappo J. 1995. Uptake and transport of copolymer biodegradable microspheres by rabbit Peyer's patch M cells. Cell Tissue Res. 279(2):433–436.
- Field CJ, McBurney MI, Massimino S, Hayek MG, Sunvold GD. 1999. The fermentable fiber content of the diet alters the function and composition of canine gut associated lymphoid tissue. Vet Immunol Immunop. 72(3–4):325–341.
- Fujimura Y, Iida M. 2001. A new marker for cup cells in the rabbit small intestine: expression of vimentin intermediate filament protein. Med Electron Microsc. 34(4):223–229.
- Gebert A, Hach G, Bartels H. 1992. Co-localization of vimentin and cytokeratins in M cells of rabbit gut-associated lymphoid tissue (GALT). Cell Tissue Res. 269:331–340.
- Gebert A, Göke M, Rothkötter HJ, Dietrich CF. 2000. The mechanisms of antigen uptake in the small and large intestines: the roll of the M cells for the initiation of immune responses. Z Gastroenterol. 38(10):855–872.
- Gidenne T. 2003. Fibres in rabbit feeding for digestive troubles prevention: respective role of low-digested and digestible fibre. Livest Prod Sci. 81:05–117.
- Gómez-Conde MS, García J, Chamorro S, Eiras P, Rebollar PG, Pérez de Rozas A, Badiola I, de Blas C, Carabaño R. 2007. Neutral detergent-soluble fiber improves gut barrier function in twenty-five-day-old weaned rabbits. J Anim Sci. 85(12):3313–3321.
- Hase K, Kawano K, Nochi T, Pontes GS, Fukuda S, Ebisawa M, Kadokura K, Tobe T, Fujimura Y, Kawano S, et al. 2009. Uptake through glycoprotein 2 of FimH(+) bacteria by M cells initiates mucosal immune response. Nature. 462(7270):226–231.
- Jepson MA, Mason CM, Bennett MK, Simmons NL, Hirst BH. 1992. Co-expression of vimentin and cytokeratins in M cells of rabbit intestinal lymphoid follicle-associated epithelium. Histochem J. 24(1):33–39.
- Kanaya T, Hase K, Takahashi D, Fukuda S, Hoshino K, Sasaki I, Hemmi H, Knoop KA, Kumar N, Sato M, et al. 2012. The Ets transcription factor Spi-B is essential for the differentiation of intestinal microfold cells. Nat Immunol. 13(8):729–736.
- Koizumi H, Liu CC, Zheng LM, Joag SV, Bayne NK, Holoshitz J, Young JD. 1991. Expression of perforin and serine esterases by human gamma/delta T cells. J Exp Med. 173(2):499–502.
- Kucharzik T, Lugering A, Lugering N, Rautenberg K, Linnepe M, Cichon C, Reichelt R, Stoll R, Schmidt MA, Domschke W. 2000. Characterization of M cell development during indomethacin-induced ileitis in rats. Aliment Pharm Ther. 14:247–256.
- Kucharzik T, Lügering N, Rautenberg K, Lügering A, Schmidt MA, Stoll R, Domschke W. 2000. Role of M cells in intestinal barrier function. Ann N Y Acad Sci. 915:171–183.
- Lelouard H, Fallet M, de Bovis B, Méresse S, Gorvel JP. 2012. Peyer's patch dendritic cells sample antigens by extending dendrites through M cell-specific transcellular pores. Gastroenterology. 142(3):592–601.
- Mantis NJ, Frey A, Neutra MR. 2000. Accessibility of glycolipid and oligosaccharide epitopes on rabbit villus and follicle-associated epithelium. Am J Physiol Gastrointest Liver Physiol. 278(6):G915–G923.
- Montcourrter P, Lelouard H, Maury J, Mangeat P, Reggio H. 1996. Apical membranes from M-cells and enterocytes have different carbohydrate expression and are recognized by different monoclonal antibodies in rabbit appendix and Peyer's patches. Mol Biol Cell. 88(1–2):78–78.
- Neurath MF, Fuss I, Pasparakis M, Alexopoulou L, Haralambous S, Zum Büschenfelde KHM, Strober W, Kollias G. 1997. Predominant pathogenic role of tumor necrosis factor in experimental colitis in mice. Eur J Immunol. 27(7):1743–1750.
- Neutra MR, Kozlowski PA. 2006. Mucosal vaccines: the promise and the challenge. Nat Rev Immunol. 6(2):148–158.
- NRC. 1977. Nutrient requirements of domestic animals. No. 9. Nutrient requirements of rabbits. 2nd revised ed. Washington, DC: National Academy of Sciences–National Research Council.
- Pappo J, Ermak TH, Steger HJ. 1991. Monoclonal antibody-directed targeting of fluorescent polystyrene microspheres to Peyer's patch M cells. Immunology. 73:277–280.
- Pierre F, Perrin P, Champ M, Bornet F, Meflah K, Menanteau J. 1997. Short-chain fructo-oligosaccharides reduce the occurrence of colon tumors and develop gut-associated lymphoid tissue in Min mice. Cancer Res. 57:225–228.
- Rouch JD, Scott A, Lei NY, Solorzano-Vargas RS, Wang J, Hanson EM, Kobayashi M, Lewis M, Stelzner MG, Dunn JCY, et al. 2016. Development of functional microfold (M) cells from intestinal stem cells in primary human enteroids. PLOS One. 11(1):e0148216.
- Roy MJ, Ruiz A, Varvayanis M. 1987. A novel antigen is common to the dome epithelium of gut- and bronchus-associated lymphoid tissues. Cell Tissue Res. 248(3):635–644.
- Rubas W, Banerjea AC, Gallati H, Speiser PP, Joklik WK. 1990. Incorporation of the reovirus M cell attachment protein into small unilamellar vesicles: incorporation efficiency and binding capability to L929 cells in vitro. J Microencapsul. 7(3):385–395.
- Schley PD, Field CJ. 2002. The immune-enhancing effects of dietary fibres and prebiotics. Brit J Nutr. 87:S221–S230.
- Van Hung T, Suzuki T. 2016. Dietary fermentable fiber reduces intestinal barrier defects and inflammation in colitic mice. J Nutr. 146(10):1970–1979.
- Van Soest PJ, Robertson JB, Lewis BA. 1991. Methods for dietary fiber, neutral detergent fiber, and nonstarch polysaccharides in relation to animal nutrition. J Dairy Sci. 74(10):3583–3597.
- Wang J, Gusti V, Saraswati A, Lo DD. 2011. Convergent and divergent development among M cell lineages in mouse mucosal epithelium. J Immunol. 187(10):5277–5285.
- Xing J, Jing W, Jiang Y. 2013. Molecular characterization and expression analysis of fat mass and obesity-associated gene in rabbit. J Genet. 92(3):481–488.
- Yang Q, Chen C, Wu S, Zhang Y, Mao X, Wang W. 2010. Advanced glycation end products downregulates peroxisome proliferator-activated receptor γ expression in cultured rabbit chondrocyte through MAPK pathway. Eur J Pharmacol. 649(1–3):108–114.
- Yang Y, Yin F, Hang Q, Dong X, Chen J, Li L, Cao P, Yin Z, Luo L. 2018. Regulation of endothelial permeability by glutathione S-transferase Pi against actin polymerization. Cell Physiol Biochem. 45(1):406–418.
- Zhong X, Liu H, Pu A, Xia X, Zhou X. 2007. M cells are involved in pathogenesis of human contact lens-associated giant papillary conjunctivitis. Arch Immunol Ther Exp. 55(3):173–177.
- Zhu YL, Wang CY, Wang XP, Li B, Sun LZ, Li FC. 2013. Effects of dietary fiber and starch levels on the non-specific immune response of growing rabbits. Livest Sci. 155(2–3):285–293.