
 ?Mathematical formulae have been encoded as MathML and are displayed in this HTML version using MathJax in order to improve their display. Uncheck the box to turn MathJax off. This feature requires Javascript. Click on a formula to zoom.
Abstract
The overall fish welfare in sea-caged European sea bass (Dicentrarchus labrax) was quantitatively assessed by adapting the Salmon Welfare Index Model (SWIM 1.0). In the model, a total of 16 operational welfare indicators in three segments (i) individual fish-based; (ii) fish-group specific; and (iii) sea cage environment-specific indicators were evaluated. In this study, the welfare indicators for salmon aquaculture which are incompatible with the characteristics of European sea bass were modified. Differently from SWIM 1.0, the welfare indicators of smoltification and salinity were eliminated; however, gill integrity and pH were added in the modified model of this study while the water temperature attributes were also changed in the model proposed. The modified model was tested for two sea cage farms of European sea bass (Farm A and Farm B) in two different locations of Mediterranean Sea for the first time. The overall welfare scores were expressed by a scale from 0-poor to 1-good welfare. The overall welfare assessment calculated by the model yielded the value of 1.0 and 0.81 for Farm A and Farm B, respectively. Based on the scores, Farm A represented the conditions of ‘good welfare’ while Farm B gave fair warning about welfare status. The methodology developed in the SWIM 1.0 model can be applied to European sea bass in Mediterranean aquaculture with small modifications.
Salmon Welfare Index Model (SWIM 1.0) was utilised for E. sea bass welfare evaluation
SWIM 1.0 was tested in sea-caged fish from two farms located in Mediterranean Sea
SWIM 1.0 model can be applied to E. sea bass with small modifications
HIGHLIGHTS
Introduction
Fish welfare has been considered as an important element of the sustainable aquaculture industry, particularly for economic and environmental reasons (World Organisation for Animal Health [OIE] Citation2019). The concern for fish welfare has also been increasing for ethical reasons. Public and aquaculture industry concerns provide a basis for producing agreed standards on fish welfare (Huntingford and Kadri Citation2009). The European Union (EU) has adopted progressive body of legislation on fish welfare with the regulations of Council Directive 98/58/EC, Regulation (EC) 882/2004, Regulation (EC) 1/2005, Council Directive 2006/88/EC, Regulation (EC) 710/2009, and Regulation (EC) 1099/2009. The rules on organic aquaculture animal production (Regulation (EC) 710/2009), also can be referred in the context of fish welfare concerning some specific requirements such as stocking density, feeding characteristics and farm management. The European Food Safety Agency (EFSA) and the OIE have issued recommendations on fish welfare, particularly for transport, stunning and killing of farmed fish. Nevertheless, current regulations and recommendations on fish welfare do not impose any specific requirements on the farming conditions, transport, or slaughter of farmed fish (Segner et al. Citation2019). Toni et al. (Citation2019) noted that the absence of ‘optimal’ environmental conditions in Directive 2010/63/EU is a big problem for monitoring welfare of fish.
Fish welfare is a complex and multidimensional topic, leading to difficulties in the overall assesment requiring a multicriteria evaluation (Huntingford et al. Citation2006). Currently, there is no gold standard for fish welfare assessment. In fact, the degree to which animals have or experience the Five freedoms [Freedom from (a) hunger or thirst; (b) discomfort; (c) pain, injury or disease; (d) behavioural restrictions; (e) fear and distress] can barely be assessed quantitatively on a common welfare scale (Capdeville and Veissier Citation2001). Even though it has reached a deep understanding, the assessment of fish welfare in various aquaculture conditions is challenging. It is hard to turn the available qualitative information of welfare status into the quantitative data.
Scientific determination of welfare can be a powerful tool in welfare assessment for fish. However, this type of assessment in laboratory requires time-consuming procedures and high costs. In particular, the evaluation of fish’s physiological status through scientific measures such as hormonal levels is impractical to use in farm conditions, hence operational indicators for fish have been outlined to assess the fish welfare. Operational welfare indicators provide an acceptable reflection of welfare with advantages of repetitive and inexpensive procedures and convenience to measure on a farm condition (Noble et al. Citation2018; Segner et al. Citation2012, Citation2019).
In aquaculture, there is a limited number of studies using a model associated with operational welfare indicators to assess fish welfare. One of the most reasonable fish welfare assessment methods is the Salmon Welfare Index Model (SWIM) 1.0, developed by Stien et al. (Citation2013) for salmon. SWIM 1.0 model is based on Bracke’s algorithm (Bracke, Metz, et al. Citation1999; Bracke et al. Citation1999a, Citation1999b) and provides semantic modelling using operational welfare indicators. The model is technically convenient because it uses operational welfare indicators and reflects most of the welfare needs.
The production of European sea bass and gilthead sea bream represents more than 95% of the total fish production in the Mediterranean region (EUMOFA Citation2017). The welfare of European sea bass in sea cages was not numerically evaluated until now. The lack of computational welfare assessment may be related to the absence of strategy aiming at achieving OIE standards in E. sea bass aquaculture.
The aim of the present study was to test the semantic model previously developed for salmon (SWIM 1.0) to assess the quantitative welfare status in E. sea bass (D. labrax).
Material and methods
The study was adhered to Directive 98/58/EC on protection of animals kept for farming purposes and EU publication on common practices at slaughter.
Operational welfare indicators
A total of 16 operational welfare indicators were analysed in three segments: fish-based; fish-group specific, and sea cage environment-specific indicators. Fish-based indicators were: condition factor, emaciation state, visible parasites, gill, skin and fin condition, and vertebral deformity. Fish group-specific indicators were monthly mortality ratio and appetite. The sea cage environment-specific indicators were water temperature, pH, oxygen level, water current, stocking density, lighting, and disturbances.
Characteristics of the farms
Two different E. sea bass farms (Farm A and Farm B) located in the Mediterranean Sea were studied to evaluate welfare status of fish in sea cages. The exact locations or the names of the farms were not given due to some commercial concerns. The studied period was October 2019. Sea cages of both farms were under natural lighting conditions. The net volume of the circular cages was 35.000 m3 in both farms. Stocking densities in sea cages were 15 kg/m3 in Farm A and 12.05 kg/m3 in Farm B. In both farms, fish feed in the form of pellets was provided with automatic feeders at a ratio ranging between 0.7 and 1.2% body weight based on the age/size of fish. The commercial feed contained 43.0% crude protein, 17.0% crude fat, 2.7% crude fibre, 8.5% moisture and 8.2% ashes.
Farm characteristics for environment-based indicators
Environmental parameters were monitored in the farms and water temperature (T), dissolved oxygen (DO), and pH were measured manually on a daily base.
In Farm A, the water temperature values were 24.19 °C at the surface, 24.12 °C at 6 m depth and 24.10 °C at 8 m depth. The oxygen saturation was 80% at the surface and 81% at 6 and 8 m depth. The current velocity values were 15 cm/s at the surface and 10–12 cm/s below 10 m.
In Farm B, the water temperature values were 23.30 °C at the surface, 23.18 °C at 6 m depth and 23.10 °C at 8 m depth. The oxygen saturation was 70% at the surface and 72% at 6 and 8 m depth. The current velocity values were 8 cm/s at the surface and 5 cm/s below 10 m.
The necessary data were obtained from farm records.
Fish for individual-based indicators
Fish sampling
Fish sampling and examination were performed immediately after harvesting. Harvested fish from the sea cages were directly put on ice in the transfer tanks. The period between harvesting and fish examination was about 1 hour. Individual fish samples of each farm (N = 20) were randomly selected among the harvested batch from one cage. The representative sample size was 20, i.e. more than 10 fish as applied in the model of SWIM 1.0. Before analysing the welfare indicators in individual fish samples, at the harvesting time, the fish schools in the sea cages were observed using an underwater camera (Fyssalis V4.5-1/2.7” CMOS in Farm A and 3rd Eye-MCV8-LED in Farm B) at least for an hour and the video were recorded for monitoring of the fish later.
Fish characteristics
The mean weight of E. sea bass in Farm A was 651 ± 39 g (min 439–max 711 g) and the mean length 38.26 ± 0.77 cm (min 31.5–max 47 cm) and in Farm B mean weight was 327.73 ± 9.28 g (min 290–max 390 g) and mean length 31.60 ± 0.42 cm (min 29–max 33 cm).
The Fulton’s condition factor was determined using the formula:
where W is the weight (g) and L is the total length (cm) of a fish.
The condition factor ranged from 0.98 to 1.31 for European sea bass from Farm A and from 1.10 to 1.40 for those from Farm B. Feed conversion ratio (FCR) was around 1.9 in Farm A and 2.05 in Farm B.
SWIM 1.0 model
Semantic modelling of overall animal welfare was originally developed by Bracke (Bracke, Metz, et al. Citation1999; Bracke et al. Citation1999a, Citation1999b) and adapted for Salmon by Stien et al. (Citation2013). In the SWIM 1.0 model overall welfare scores are calculated using weighted scores to each indicator, where the weighting is based on each welfare indicator negative or positive contribution to a set of weighting markers (Table ; see Stien et al. Citation2013 for details). In SWIM 1.0, welfare status (from best to worst) associated with the scientific explanation is ranked for each operational welfare indicator (WI) as indicated in Table .
Table 1. Fish welfare markers, weighting categories and ranges of weighting scores used in semantic modelling (adapted from Stien et al. Citation2013).
The given level represents the status of each welfare indicator. In the model, a weighting factor to each WI is attributed. A weighting factor (WF) depending on the levels and an ordinal indicator score (IS) for each WI level is specified. ISs are ranked from the best (1) to the worst (0). Some WI levels under minimum requirements representing poor welfare (such as tissue loss in fish) take the value 0. This level is expressed as knockout levels which are not included in the calculations of the overall welfare index (OWI). The OWI is the sum of the indicator welfare scores (IWS) (Table ). Thus, the other two components involved in the calculations of OWI are the relative weighting factor (RWF) and the indicator welfare score (IWS). The following three formulas were used for RWF, IWS, and OWI (Stien et al. Citation2013; Folkedal et al. Citation2016).
where m is the total number of welfare indicators; WF (i) and WF (j) are the weighting factors for the indicator i and j
Table 2. Welfare indicators (WI), the levels for each indicator, and the corresponding indicator level score (IS), the calculated weighting factor (WF), and the relative weighting factor (RWF).
IS is the indicator score given for WI (see Tables and ).
The total OWI (OWItotal) score is based on calculated OWIs of three segments: 1. sea cage environment-specific OWI (temperature, pH, oxygen level, water current, stocking density, lighting, and disturbances); 2. fish-group specific OWIs (monthly mortality ratio and appetite); 3. individual-based OWI (condition factor, emaciation state, visible parasites, gill, skin and fin condition, vertebral deformity).
The Total OWI (OWItotal) was calculated using the formula below (Stien et al. Citation2013; Folkedal et al. Citation2016):
As an example of WF calculation for gill condition, WI was divided into four categories ranging from normal appearance to disease signs, and the calculated WF was 20 (Table ) and RWF was 0.21 (see formula A).
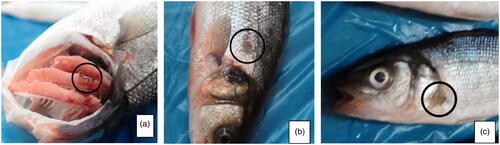
The OWI for individual fish-specific indicators was assessed on the representative samples of fish from the sea cages. Fish gets an OWI of 1.0 when all measured indicators were in the normal range (Figure ). In case the indicators were considered out of the range of normal, OWI gets lower values. For example, E. sea bass gets OWI of 0.88 in relation to IWS of 0 due to the visible parasites in the gills or loss of any fin although other indicators were normal. Another example is OWI of 0.93 and IWS of 0.10 because of scale loss (Figure ). The OWI of 1.0 represents the best welfare score and 0.0 the worst score.
Figure 1. Image of European sea bass with OWI of 1.0, showing normal individual-specific welfare indicators.
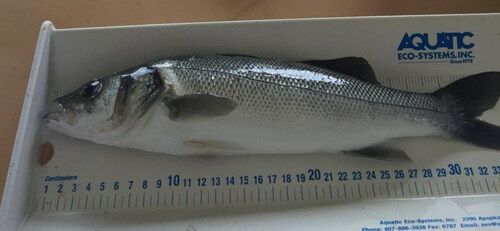
Figure 2. European sea bass examples with lower OWI values. (a) OWI of 0.88 (IWS for parasite presence = 0 due to the visible copepod parasites in the gills); (b) OWI of 0.93 (IWS for skin condition = 0.10 due to scale loss; (c) OWI of 0.88 (IWS for fin condition = 0 due to loss of pectoral fin).
This study is the first to benchmarking of overall sea bass welfare in sea cages. The efficacy of the model application can be increased by frequent fish sampling.
Adaptation of model to European sea bass
The model is flexible in terms of WIs to be included (Folkedal et al. Citation2016). In fitting of the indicators to E. sea bass, we removed the indicators of smoltification status and salinity due to specific characteristics of E. sea bass and added pH as an environment-based indicator and gill appearance as the indvidual-based one. Gill appearance was considered since the gills, with their large surface area, are in direct contact with water and can be sensitive indicator to water quality. Information regarding the indicators and their scoring levels were based on SWIM 1.0 forms used for salmon, developed by Stien et al. (Citation2013). However, in scoring levels and weighting of changed indicators, in this study, the existing knowledge for E. sea bass in the literature was considered (Makridis et al. Citation2018).
Results and discussion
In SWIM 1.0 the central theme of on-farm assessment is the application of indicators of physical health and welfare of individuals and groups of fish as well as cage environment and related management practices. Segner et al. (Citation2019) stated that the monitoring and assessment of the welfare of cultured fish could not be evaluated with the observation of a single parameter, hence, to assess the welfare status correctly it necessitates the integration of more parameters. For practical work, operational welfare indicators should be set to merge several environmental aspects of the culture conditions in a fish farm and fish well-being indicators. In this study, a total of 16 non-invasive indicators (seven individual-based, two fish group-specific, and seven environmental indicators) were utilised to estimate the fish welfare status of E. sea bass reared in sea cages, in line with SWIM 1.0.
The median OWI of E. sea bass was 1.0 for Farm A and 0.88 for Farm B (Tables S1 and S2). OWI for sea cages was scored 1 for Farm A and 0.76 for Farm B (Table ).
Table 3. Indicator welfare scores (IWS) and overall welfare index (OWI) for cage specific indicators.
The overall welfare index evaluated with fish, fish group, and sea cage based indicators were 1.0 for Farm A and 0.81 for farm B (Table ). Total OWI was the combination of the scores of sea cage and fish group and median score of fish.
Table 4. Total overall welfare index (OWI) for E. sea bass from farm A and farm B.
The overall welfare assessment showed the value of 1.0 for Farm A, corresponding to the score that represents ‘good welfare.’ However, the value of 0.81 for Farm B indicated an alert on the welfare status. The score in Farm B was clearly due to the lower OWI of oxygen saturation and water current in environmental indicators and visible parasites indexes in individual-based indicators.
In relation to the model adaptation, the technologies and practices utilised for on-growing salmon are the same as those used for E. sea bass, however, salmon has differences in biology from that of sea bass. The main difference is related to the smoltification (a complex series of physiological changes for young salmon from the freshwater life stage to the seawater life stages) of salmon. Since European sea bass has no smoltification phase in its life cycle, in the model, we modified several parameters to fit the European sea bass characteristics which are not similar to salmon aquaculture. The indicators related to the smoltification were removed from the welfare indicators. We added gill integrity and appearance as an OWI, considering the fact that gills with their large surface area are in direct contact with water and can be sensitive to water quality. We also removed salinity from OWI for the cage environment as E. sea bass is euryhaline (Mancera et al. Citation1994; Vandeputte et al. Citation2019). Due to eurythermal features of the European sea bass we arranged the water temperature attributes accordingly.
Because there is no gold standard for fish welfare measurement, the validity of assessment methods is highly problematic to control. The main challenge of the method is the scoring of the welfare indicators as the scoring may be subjective. Another issue is the stability of the results. Frequent fish samplings and farm visits, at regular intervals, may provide more consistent results. Despite these constrations, the approach in SWIM 1.0 integrating the welfare indicators of individual fish, fish-group and environment can be used to identify risks to fish welfare and the reasons for poor welfare so that improvement strategies can be implemented. Exposing the acquired data from single sampling to the SWIM 1.0 calculations provided feedback about the welfare status of E. sea bass in sea cages in Mediterranean Sea. This is the first quantitative model for overall welfare assessment in European sea bass in cage aquaculture. The model seemed functional to evaluate the welfare level of that species on-farm conditions.
Conclusion
A semantic model (SWIM 1.0) for overall welfare assessment of E. sea bass in Mediterranean aquaculture has been empirically validated for the first time. Operational welfare indicators organised in three categories: (i) individual-based; (ii) fish group-specific; and (iii) environmental indicators appeared feasible to assess on-farm condition the welfare of this species. SWIM 1.0 developed for salmon can be applied for aquaculture of sea bass with some modifications in relation to its specific characteristics. Further studies on the versatility of modelling and harmonised standard to assess fish welfare are required.
Supplemental Material
Download MS Word (22 KB)Disclosure statement
No potential conflict of interest was reported by the author(s).
Additional information
Funding
References
- Bracke MBM, Metz JHM, Spruijt BM. 1999. Overall animal welfare reviewed. Part 2: assessment tables and schemes. NJAS. 47:293–305.
- Bracke MBM, Spruijt BM, Metz JHM. 1999a. Overall animal welfare assessment reviewed. Part 1: is it possible? NJAS. 47:279–291.
- Bracke MBM, Spruijt BM, Metz JHM. 1999b. Overall animal welfare reviewed. Part 3: welfare assessment based on needs and supported by expert opinion. NJAS. 47:307–322.
- Capdeville J, Veissier I. 2001. A method of assessing welfare in loose housed dairy cows at farm level, Focusing on animal observations. Acta Agriculturae Scandinavica A. 51(sup030):62–68..
- EUMOFA. 2017. The EU fish market. https://www.eumofa.eu/documents/20178/108446/The+EU+fish+market+2017.pdf.
- Folkedal O, Pettersen JM, Bracke MBM, Stien LH, Nilsson J, Martins C, Breck O, Midtlyng PJ, Kristiansen T. 2016. On-farm evaluation of the Salmon Welfare Index Model (SWIM 1.0): theoretical and practical considerations. Anim Welf. 25(1):135–149..
- Huntingford FA, Adams C, Braithwaite FA, Kadri S, Pottinger TG, Sandøe P, Turnbull JF. 2006. Current issues in fish welfare. J Fish Biol. 68(2):332–372.
- Huntingford FA, Kadri S. 2009. Taking account of fish welfare: lessons from aquaculture. J Fish Biol. 75(10):2862–2867..
- Makridis P, Mente E, Grundvig H, Gausen M, Koutsikopoulos C, Bergheim A. 2018. Monitoring of oxygen fluctuations in seabass cages (Dicentrarchus labrax L.) in a commercial fish farm in Greece. Aquac Res. 49(2):684–691..
- Mancera JM, Pérez-Fígares JM, Fernández-Llebrez P. 1994. Effect of cortisol on brackish water adaptation in the euryhaline gilthead sea bream (Sparus aurata). Comp Biochem Physiol. 107(2):397–402.
- Noble C, Gismervik K, Iversen MH, Kolarevic J, Nilsson J, Stien LH, Turnbull JF. 2018. Welfare Indicators for farmed Atlantic salmon: tools for assessing fish welfare. www.nofima.no/fishwell/english.
- Segner H, Reiser S, Ruane N, Rösch R, Steinhagen D, Vehanen T. 2019. Welfare of fishes in aquaculture. FAO Fisheries and Aquaculture Circular No. 1189. Budapest: FAO.
- Segner H, Sundh H, Buchmann K, Douxfils J, Sundell KS, Mathieu C, Ruane N, Jutfelt F, Toften H, Vaughan L. 2012. Health of farmed fish: its relation to fish welfare and its utility as welfare indicator. Fish Physiol Biochem. 38(1):85–105..
- Stien LH, Bracke MBM, Folkedal O, Nilsson J, Oppedal F, Torgersen T, Kittilsen S, Midtlyng PJ, Vindas MA, Øverli Ø, et al. 2013. Salmon Welfare Index Model (SWIM 1.0): a semantic model for overall welfare assessment of caged Atlantic salmon: review of the selected welfare indicators and model presentation. Rev Aquac. 5(1):33–57..
- Toni M, Manciocco A, Angiulli E, Alleva E, Cioni C, Malavasi S. 2019. Review: Assessing fish welfare in research and aquaculture, with a focus on European directives. Animal. 13(1):161–170. Epub 2018 May 2. PMID: 29717679.
- Vandeputte M, Gagnaire PA, Allal F. 2019. The European sea bass: a key marine fish model in the wild and in aquaculture. Anim Genet. 50(3):195–206..
- World Organisation for Animal Health [OIE]. 2019. Welfare of farmed fish. Aquatic Animal Health Code 29/08/2019. https://www.oie.int/en/standard-setting/aquatic-code/access-online/?htmfile=chapitre_welfare_introduction.htm.