
Abstract
Determining the best level of forage inclusion in diets for optimal performance of weaned calves will benefit the dairy industry greatly. This study evaluated the effect of feeding different forage to concentrate ratios on performance, behaviour, and metabolic responses of Holstein weaned calves. Forty-five Holstein female calves (70 d of age and 71.7 ± 4.4 kg body weight at trial initiation) were balanced for birth BW and randomly assigned to 1 of 3 treatments: (1) forage-to-concentrate ratio of 50:50, (2) forage-to-concentrate ratio of 35:65 and (3) forage-to-concentrate ratio of 20:80. Alfalfa hay was the sole dietary forage source. Calves were kept in individual pens until 120 d of age. Decreasing dietary forage concentration linearly increased dry matter and energy intake, and average daily gain. Body weight at d 95 and 120 linearly increased as alfalfa hay was replaced with concentrate. Ruminal pH at d 120 of age linearly decreased with greater inclusion of concentrate. Final heart girth, withers height and hip height linearly increased and final hip width tended to increase as concentrate was substituted for alfalfa hay. Plasma glucose concentration at d 95 of age linearly increased with greater concentrate levels, but the opposite was observed for β-hydroxybutyrate concentration. Increasing concentrate increased lying behaviour linearly, but decreased rumination behaviour. The results of this study indicated that feeding diets with a 20:80 forage to concentrate ratio enhanced feed intake, growth performance, and some skeletal growth parameters in the post-weaning period and increased lying behaviour and decreased rumination behaviour.
Determining the best level of forage inclusion in diets for optimal performance of weaned calves will benefit the dairy industry greatly.
Decreasing dietary forage concentration linearly increased dry matter intake, body weight and withers height.
Feeding diets with a 20:80 forage to concentrate ratio enhanced performance in the postweaning period of dairy calves.
HIGHLIGHTS
Introduction
The cost of rearing dairy replacement heifers is dependent on growth rates and thereby, early breeding and time to first calving. Therefore, providing adequate nutrition to sustain rapid growth rates during the initial 4 mo of age promotes a more efficient and effective heifer rearing. Intake of solid feeds is vital to the calf for transitioning from a pre-ruminant animal to a functional ruminant (Heinrichs Citation1993), but a wide range of starter and grower feeds are commonly fed to dairy calves less than 4 mo of age worldwide. Thus, to elucidate optimal feeding strategies for calves at weaning transition or early post-weaning periods are crucial areas of research to improve dairy profitability.
Moreover, the price of cereal grains and traditionally fed protein concentrates (e.g. soybean meal) has risen steadily, increasing the cost of animal feeding. Consequently, finding adequate replacements for these feed ingredients have become a priority for livestock producers. And the use of greater levels of home-grown forages, such as alfalfa, could aid to offset these costs if proper growth rates are sustained. As such, there is a current trend to feed weaned calves with low cereal but high fibre diets. Although this type of formulation strategy has been used in the field, few research-based information about its nutritive value is available and research is warranted. Because forages and concentrates differ greatly in rates and extents of ruminal digestion, their ability to support microbial growth in the rumen also differs (Ramos et al. Citation2009), with potential effects on rumen development.
Forage consumption promotes muscular development of the rumen (Beiranvand et al. Citation2014) and stimulates rumination and flow of saliva into the rumen (Nemati et al. Citation2015). However, forages are less energy dense and digestible compared with starter feeds, and could, therefore, delay rumen epithelial development and suppress the growth of young ruminant animals (Stobo et al. Citation1966; Hill et al. Citation2008). Furthermore, forages may not promote sufficient production of rumen VFA, required for optimal papillae development compared with concentrate feeds. However, concentrate feeds may promote keratinisation of the papillae in calves (Lesmeister and Heinrichs Citation2004; Khan et al. Citation2008). Thus, the prevention of digestive disorders is also of utmost importance. Early intake of high concentrate diets may cause a rapid accumulation of ruminal VFA and lactic acid accompanied by a decrease in pH (Anderson et al. Citation1987; Beharka et al. Citation1998) and rumen motility (Owens et al. Citation1998), keratinisation of the rumen papillae (Bull et al. Citation1965), and hence decreased VFA absorption (Hinders and Owen Citation1965). Moreover, forages have greater NDF and lower NFC than concentrate feeds potentially affecting the rumen development of calves. Most recently, Xue et al. (Citation2019) reported that the ratio of NFC to NDF affected the development of rumen papillae, particularly length and width, in Charolais bull calves.
Thus, finding the optimum balance between forages and concentrates to ensure adequate rumen development while ensuring rumen health is key for incorporating more home-grown forages to the diet. The optimum dietary forage requirements for weaned calves (2–4 mo of age), however, is unclear as trials investigating the forage level in diets of weaned calves had inconsistent results. Some investigators concluded that decreasing forage level of the diet increased DM intake (Hill et al. Citation2010; Dong et al. Citation2019; Aragona et al. Citation2020), while others have seen no advantage (Rotger et al. Citation2005). Overall, there is a discrepancy in the literature and hence finding an appropriate forage to concentrate ratio in weaned dairy calves could ensure adequate rumen health and development while improving performance.
Determining the proper level of forage inclusion in diets for optimal calf growth will benefit the dairy industry greatly. Few research trials have been conducted on the effects of forage level on the performance of weaned calves; furthermore, data on rumination behaviour are still lacking in the literature. Therefore, the objective of this study was to determine the effect of the inclusion of incremental levels of forage on growth, digestibility, behaviour, and blood parameters of weaned calves (between 70 and 120 d of age). We hypothesised that calves fed lower forage level would have greater performance from d 70 to 120 of age compared with calves fed a higher proportion of forage.
Materials and methods
The present experiment was carried out at Emdad Sepahan Goldasht Agriculture and Animal Husbandry Co. (Isfahan, Iran). Animal procedures were performed in accordance with protocol no. IRN-19293, approved by the Iranian Council of Animal Care (Citation1995).
Animal, management and treatments
Forty-five 70-d-old Holstein female calves were weighed (mean BW = 71.7 ± 4.4 kg), and moved to individual pens (1 × 3 m), bedded with sand daily. Calves were balanced for birth BW and randomly assigned to one of three treatments (15 calves per treatment) as follows: 1) forage-to-concentrate ratio of 50:50 (F50–C50); 2) forage-to-concentrate ratio of 35:65 (F35–C65); and 3) forage-to-concentrate ratio of 20:80 (F20–C80). The diet contained chopped alfalfa hay as the sole forage source and concentrate feeds (ground barley and corn (3-mm screen), soybean meal, and wheat bran; Table ). Particle size distribution of alfalfa hay (DM basis) was determined using the Penn State Particle Separator (Kononoff et al. Citation2003) and averaged 26.3% long, 32.9% medium, 24.1% short, and 16.7% fine particles and the geometric mean of particle size was 7.31 mm. All diets were formulated according to the Cornell Net Carbohydrate and Protein System version 5.1. All calves had free access to fresh water and feed intake (targeted for 5–10% refusals after 24 h), and feed refusal from each individual calf was collected before 0800 h. Animals were fed at 0830, 1600, and 2400 h. As shown in Table , a combination of corn grain (from 18% to 31% of DM), barley grain (from 10% to 18% of DM), soybean meal (from 13% to 16% of DM), and wheat bran (from 5% to 12% of DM) replaced alfalfa hay (from 50% to 20% of DM) as the concentrate level increased in the diets. Concentrate composition was modified for each diet as an attempt to keep the same concentration of CP.
Table 1. Ingredients, chemical composition and particle size of treatments.
Before the experiment, all calves had similar management and nutrition practices. Immediately after birth, calves were separated from their dams, weighed, and moved to individual pens (1 × 3 m) bedded with sand daily. Calves consumed 10% of their body weight of colostrum within 1 h of life and 3.5 L of colostrum 9 h after the first feeding. The step-up/step-down method was used for milk feeding. All calves were fed 4 L/d of milk from d 2 to 30 of age and then 7 L/d from d 31 to 45; and 5 L/d from d 46 to 55 and 2 L/d from d 56 to 60. The calves were weaned at d 60 of age. All calves were fed pasteurised whole milk (3.62 ± 0.11% fat, 3.18 ± 0.02% CP, 5.25 ± 0.11% lactose, and 12.35 ± 0.38% total solids) in steel buckets. Calf health was checked daily by a veterinarian and sick calves were treated by a veterinarian as required. Starter feed with ground physical form (without forage) was fed ad libitum until 20 d of age. After that, calves fed ground starter with 10% alfalfa hay until d 70 of age. All calves had free access to clean drinking water from a bucket throughout the experimental period.
Sampling and laboratory analyses
Dry matter intake was determined daily. Individual body weights were recorded at d 70, 95, and 120 of age before morning feeding. First (from d 70 to 95 of age), second (from d 96 to 120 of age), and overall (from d 70 to 120 of age) means of average daily gain (ADG), feed efficiency (kg of BW gain/kg of DMI), and energy to gain ratio (energy intake/ADG) were calculated. Feed samples were collected every week throughout the study and stored at −20 °C until chemical analysis. Subsamples of feeds were mixed thoroughly, dried in a forced-air oven at 60 °C for 48 h, ground to pass through a 1-mm screen, and analysed for DM (method 925.40; AOAC, Citation2002), CP (method 2001.11; AOAC 2002), ether extract (method 920.39; AOAC Citation2002), ash (method 942.05; AOAC Citation2002), and NDF using heat-resistant alpha-amylase and sodium sulphite (Van Soest et al. Citation1991) with the Ankom Fibre Analyser system (Ankom Technology, Macedon, NY). Starch was hydrolysed to glucose using a modified glucoamylase method as described by Zhu et al. (Citation2016), and glucose concentration was analysed using an enzymatic-colorimetric method. Non-fibre carbohydrates (NFC) were calculated as: NFC = 100 – (NDF + CP + EE + Ash; all values as a % of DM).
Particle size distributions of representative sub-samples of feed were determined (in triplicate) on an as-fed basis using the Penn State Particle Separator (PSPS; NASCO, Fort Atkinson, WI) equipped with 3 sieves (19, 8, and 1.18 mm) and a bottom pan. The DM retained on each sieve of the PSPS was determined by oven drying at 60 °C for 48 h and the physical effectiveness factor (pef) was determined as the proportion of DM retained on the top 2 sieves (8 + 19 mm; pef8; Lammers et al. Citation1996) and on 3 sieves (1.18 + 8 + 19 mm; pef1.18; Kononoff et al. Citation2003) of the PSPS. The peNDF8 and peNDF1.18 concentrations were calculated by multiplying the NDF concentration of the feed (% of DM) by pef8 and pef1.18, respectively. The geometric mean of particle size (GMPS) was calculated according to the ASABE (Citation2003; method S319.3) procedure. Ingredient, nutrient compositions, and particle size distribution of the diets are in Table .
Health and faecal scores were recorded daily at 0800 h while calves were in individual pens and were averaged by week. Faecal scoring was conducted using the procedure of Khan, Lee, Lee, Kim, Kim, et al. (Citation2007) as follows: 1 = normal, 2 = soft, 3 = runny, and 4 = watery. Health score was conducted using the procedure of Roth et al. (Citation2009) as follows: 1 = normal, alert and no incidence of cough; 2 = slightly impaired, sporadic coughing, lop-eared, watery discharge or dry nose, slight watering eyes, swollen and without discharge navel; 3 = severely impaired, repeated coughing, purulent discharge nose, swollen and with discharge navel.
Body measurements including withers height (distance from base of the front feet to the withers), heart girth (circumference of the chest), abdominal girth (circumference of the belly before feeding), hip height (distance from base of the rear feet to hook bones) and hip width (distance between the points of hook bones) of each calf were measured according to Khan, Lee, Lee, Kim, Ki, et al. (Citation2007) at the start of the experiment (d 70), d 95 and the end of the study (d 120).
Data on behavioural parameters including lying (no chewing activity), standing (no chewing activity), eating feed, ruminating (either lying or standing), and nonnutritive oral behaviour (when the animal licked any surface or tongue rolled) monitored according to Terre et al. (Citation2013) by direct observations of each animal on d 119 of age. Calves were observed for 8 h after offering the solid feed at 0800 until before the solid feed offer at 1600.
On d 95 and 120 of age, rumen fluid samples were collected from 10 calves with a stomach tube 4 h after morning feeding; the first 50 mL was discarded to avoid saliva contamination. The pH of the original rumen fluid sample was immediately measured with a hand-held calibrated pH metre (HI 8318; Hanna Instruments, Cluj-Napoca, Romania).
On d 95 and 120 of age, 5 mL of blood samples were collected into vacutainer tubes (Becton Dickinson, Franklin Lakes, NJ) from the jugular vein of eight random calves per treatment at 3 h after morning feeding. Plasma was collected from samples after centrifugation at 3000 × g at 4 °C for 20 min and 2 aliquots of separated plasma stored at −20 °C until subsequent assays were conducted. Plasma glucose [glucose oxidase-phenol 4-aminoantipyrine peroxidase (GODPAP) method], cholesterol [cholesterol oxidase-phenol 4-aminoantipyrine peroxidase (CHOD-PAP) method], urea (Berthelot method), albumin (bromocresol green method), and total protein concentrations (Biuret method) were determined using commercially available kits (Pars Azmoon Company, Tehran, Iran) according to the manufacturer’s instructions by using standard test kits on an ALCYON 300i automatic analyser (Abbott Laboratories Ltd., Chicago, IL). Plasma globulin was determined by subtraction of albumin from total serum protein. Concentrations of β-hydroxybutyrate (BHB) in plasma samples were determined with a commercial colorimetric kit (kit number RB1007, Randox Laboratories Ltd., Ardmore, UK).
Faecal grab samples were collected directly from the rectum of those calves used for blood sample collection after morning and evening feedings for the last 4 days of the experiment to determine nutrient digestibility. Samples were frozen (−20 °C) until analysis. These samples were dried in a forced-air oven at 60 °C for 72 h, ground to pass through a 1-mm screen, and analysed for nutrients, as described above. Apparent total-tract digestibility of nutrients was determined using acid-insoluble ash as an internal marker (Van Keulen and Young Citation1977). The calculation of DM digestibility was as follows: DM digestibility (%) = 1 – (A/B) × 100; where A and B were the AIA concentrations in the feed and faeces, respectively. The nutrient digestibilities (X) were calculated as: X digestibility (%) = [1 – (A/B) × (XB/XA)] × 100; where XA and XB were the nutrient concentrations in the feed and faeces, respectively.
Statistical analyses
Statistical analyses were performed using PROC MIXED in SAS (Citation2002) (version 9.3; SAS Inst. Inc., Cary, NC), with calf as the experimental unit. Data were analysed separately for the first (from d 70 to 95 of the age) and second (from d 96 to 120 of the age) periods. For each period, model for feed and energy intakes included the fixed effect of the treatments, days of study as a repeated variable, and their interaction. For growth parameters model included the effects of treatments and initial data as a covariate variable. For the overall (from d 70 to 120) period, model consisted of treatments, days of study, interaction between treatments and days of study and initial values as covariate variables. Before analyses, all data were screened for normality using the UNIVARIATE procedure of SAS. An autoregressive (order 1) covariance structure was chosen based on the Akaike and Bayesian information criteria. Categorical data such as health data (faecal score, days with scours) were analysed using a multivariable logistic mixed model (GLIMMIX procedure of SAS). Polynomial orthogonal contrasts were used to test the linear and quadratic models. Significant differences and tendencies were stated at p < .05 and .05 ≤ p < .10, respectively.
Results
As shown in Table , dietary NDF decreased whereas NFC increased with an increase in concentrate level. The physical characteristics of the diets are shown in Table . The proportion of particles retained on the 19- and 8-mm sieves of the PSPS decreased, while the proportion of particles retained on the 1.18-mm and pan increased with greater concentrate proportion in the diet. Consequently, peNDF and GMPS were reduced as forage was replaced with concentrate.
Dry matter and energy intakes, ADG, and feed efficiency results are presented in Table . The DM (Figure ) and energy intakes increased linearly (p < .05) with increasing concentrate levels in the first, second, and overall periods. The ADG also increased linearly as forage was replaced with concentrate (p < .05). Furthermore, increasing concentrate in the diets linearly increased gain to feed ratio in first (p = .01) and overall (p = .02) periods. However, the treatments had no effect on the energy to gain ratio. The BW at d 95 (p = .005) and 120 (p = .0001) of age increased linearly as alfalfa hay was replaced with concentrate. Health score (p = .02) and days with score ≥ 2 (p = .01) were greater in calves fed F35 than other treatments.
Figure 1. Mean dry matter (DM) intake (kg) in calves (15 per treatment) fed diets with different forage to concentrate ratio. Error bars represent the standard error of the mean at each time point. Values are shown separately for Holstein calves fed diet forage-to-concentrate ratio of 50:50 (F50; ●); forage-to-concentrate ratio of 35:65 (F35; ^), and forage-to-concentrate ratio of 20:80 (F20; ▼). During the study, p-values for the linear effects of treatments, day and interaction between treatments and day were .008, < .0001 and .89, respectively and SEM was .050.
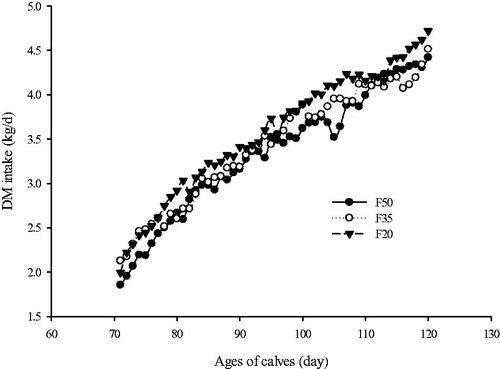
Table 2. Dry matter intake, energy intake, body weight (BW), average daily gain (ADG), and feed conversion ratio for weaned Holstein heifers (n = 15 per treatment) fed diets with different forage to concentrate ratio.
A quadratic effect was observed for ruminal pH (p = .005) at d 95 with greater values for F35 fed calves than F50 and F20 fed calves (6.95, 6.62 and 6.42, respectively). However, ruminal pH decreased linearly (p = .004) at d 120 with increasing concentrate levels (Table ). Quadratic effects were observed for DM (p = .03), and ADF (p = .002) digestibilities and a tendency for a quadratic response was observed for NDF (p = .05) digestibility, with lower values of DM (72.5 vs 79.5%), NDF (60.7 vs 65.8%), and ADF (50.1 vs 60.2%) digestibilities for F35 calves than the F50 and F20 animals.
Table 3. Ruminal pH (n = 15 per treatment) and total tract nutrient digestibility (n = 8 per treatment) for weaned Holstein heifers fed diets with different forage to concentrate ratio.
Final heart girth (p = .001) and hip height (p = .04) increased and final hip width tended to increase (p = .08) linearly with concentrate inclusion levels (Table ). Also, the withers height at d 95 (p = .02) and 120 (p = .001) increased linearly as alfalfa hay was replaced with concentrate. However, abdominal girth was unaffected by treatments.
Table 4. Structural parameters for weaned Holstein heifers (n = 15 per treatment) fed diets with different forage to concentrate ratio.
As shown in Table , blood urea nitrogen (BUN) decreased at d 95 (p = .01) and tended to decrease at d 120 (p = .09) linearly with increasing concentrate levels, without any treatment effects on total protein, albumin, and globulin. Glucose increased (p = .006) whereas BHB decreased (p = .001) linearly at d 95 with decreasing forage levels.
Table 5. Plasma metabolites for weaned Holstein heifers (n = 8 per treatment) fed diets with different forage to concentrate ratio.
Lying behaviour (p = .04) increased linearly as concentrate was replaced for alfalfa hay (Table ). However, rumination activity decreased linearly (p = .002). Treatments tended to have a quadratic effect on nonnutritive oral behaviour (p = .08) with higher values observed for F35 than F50 and F20 calves (37.7, 27.3, and 30.2 min, respectively).
Table 6. Total time devoted to performing different behaviours during 8 h of observation for weaned Holstein heifers (n = 15 per treatment) fed diets with different forage to concentrate ratio.
Discussion
In agreement with our results, increasing dietary concentrate levels and NFC/NDF ratio enhanced intake of DM in previous studies (Hill et al. Citation2010; Dong et al. Citation2019). Aragona et al. (Citation2020) showed in calves with 2–4 months of age that DMI was greater for calves fed limited chopped versus free choice long hay diets. It is well documented that DMI of ruminants is limited by physical distension of the gastrointestinal tract and due to the positive association between forage NDF and bulk density of the diet, increasing forage to concentrate ratio generally decreases feed intake (Allen Citation2000). Jahn et al. (Citation1970) reported that gut fill increased linearly, from approximately 10% to 24% of BW, as ADF increased from 5% to 34% of DM. Strozinski and Chandler (Citation1971) reported that gut fill linearly increased, from approximately 8% to 20% of BW, as ADF increased from 3% to 26% of DM. In the current trial, the ADF increased from 10.9% to 18.5% of DM, and possibly limited consumption of DM due to gut fill.
Particle retention time in the rumen also affects performance. Vazquez-Anon et al. (Citation1993) reported mean retention of particles in the rumen increases from 22 h at 7 wk of age to 44 h at 13 wk of age in calves fed diets consisting of 15% chopped grass hay and 85% concentrate when weaned at 5 wk of age. This implies that greater rumen digestion occurs as the calf ages and suggests that forages such as alfalfa hay may be better suited for older calves. Younger calves should be fed diets with digestible ingredients that support rumen development and provide adequate particle size to prevent hyper-keratinisation of papillae to achieve optimal performance (NRC Citation2001). Differences in intake in the current trial indicate that rumen fill was likely restricting intake of the high forage treatment group. For high-producing dairy cows, it was previously established that diets containing more than 32% NDF could limit DMI (Zebeli et al. Citation2008). However, a similar dietary NDF and NFC/NDF ratio guideline for 2–4 month-old calves has not been reported and deserves further investigation.
In the current trial, energy intake, ADG, and BW followed a similar pattern to DMI. Consequently, greater ADG was achieved in the current study as a combination of higher energy density and increased feed intake with greater dietary concentrate levels. Restricted intake, combined with a presumed lower energy intake of hay versus concentrate could lessen growth rates of calves fed high forage diets (Hill et al. Citation2019). Similar to our findings, Hill et al. (Citation2010), Dong et al. (Citation2019), and Aragona et al. (Citation2020) reported that ADG increased with increasing concentrate levels and NFC/NDF ratio in the diet. High starch and NFC/NDF ratio diets have been shown to improve growth in calves with more than 8 wk of age compared with low starch and NFC/NDF ratio diets (Hill et al. Citation2008, Citation2012, Citation2016). In contrast, increasing the forage level reduced the growth of calves (Hill et al. Citation2010, Citation2012). Most recently, Aragona et al. (Citation2020) observed that calves fed high starch diet or limited chopped hay diet had greater feed efficiency, ADG, and BW than calves fed low starch diet or a diet with free choice of long hay. In the current study, increasing the concentrate level had increased starch level in diets and improved DMI and ADG in calves.
Gain to feed ratio linearly increased with greater concentrate level, however, energy to gain ratio was similar between treatments. These findings suggest that the increased ADG in calves consuming lower forage diets was likely related to greater DM and energy intake. These results indicated that energy is the most important factor for weaned calves and diets with higher energy content improve performance and growth. It was reported that ADG/DMI increased linearly (p < .001; R2 = 0.83) as starch concentration of dry feed increased (Hu et al. Citation2018).
Total-tract digestibility of DM, NDF, and ADF were lowest for calves fed the F35 diet. We are uncertain of what caused these results, but F35-fed calves had greater rumen pH at d 95 than other treatments, suggesting lower digestibility and VFA accumulation in the rumen. Moreover, these calves tended to have greater non-nutritive oral behaviour (min) and health scores than other treatments. Non-nutritive oral behaviours are often considered as an index of poor welfare as these are thought to be related to frustrated feeding activity (Redbo and Nordblad Citation1997).
Although the concentrate level in the offered diets was different (50–80% of DM), average ruminal pH was higher than the recommended range of 6.2 ± 0.5 (Van Soest Citation1994) throughout the trial indicating physiological ruminal fermentation patterns in all treatments. Rumen pH linearly decreased with increasing concentrate and NFC/NDF ratio in diets as a response to greater amounts of rapidly fermentable starch and NFC but reduced peNDF and NDF. Lascano et al. (Citation2016) and Kljak et al. (Citation2017) observed a similar rumen pH response. Increasing dietary fibre through the inclusion of forages increases peNDF, which has been associated with increased chewing activity and rumination (Mertens Citation1997). Furthermore, it increases salivary secretion and rumen buffering capacity in the ruminant animal, explaining the effect in ruminal pH observed in the present study. Moreover, Zebeli et al. (Citation2008) indicated ruminal pH was positively affected by NDF but negatively by NFC and NFC:NDF ratio in the diet.
We expected calves fed F20 have rumen pH below 6, because of low peNDF intake and high NFC/NDF ratio. But despite the high levels of concentrate in the F20 diet, no clinical signs of acidosis were observed in any animal. These results agree with Rotger et al. (Citation2005), who reported high pH data (6.4) with heifers fed high-concentrate diets (88% and 70% of DM). Moreover, Beauchemin et al. (Citation2003) observed that when steers were changed from a high-forage to a high-concentrate diet, the risk of acidosis decreased as time progressed. Therefore, it is likely that animals receiving the same high-concentrate diet from weaning were probably adapted to the high-concentrate intake and the risk of acidosis was minimised.
Typically, high DMI (Zanton and Heinrichs Citation2009) and high fibre concentration (Porter et al. Citation2007) compromise diet digestibility. However, in the present study, the digestibility of nutrients was similar among treatments. This is consistent with the results reported by Dong et al. (Citation2019), which reported no effects of forage to concentrate ratio on DM and OM digestibilities. In contrast to our findings, Lascano et al. (Citation2016) reported total-tract digestibility of DM, OM, NDF, and ADF were reduced when heifers were fed 90% forage diets in comparison with 45% forage diets. In addition, Moody et al. (Citation2007) reported that heifers fed low forage (33% corn silage) had greater apparent DM digestibility but lower NDF digestibility than heifers fed high forage (77% corn silage) diet. The reduced total tract NDF digestibility observed in low forage diets may, therefore, be due to the faster rate of passage of concentrate compared with forages. Differences in forage source, quantity, and particle size are possible reasons underlying these discrepancies observed among studies. For example, corn silage was the forage source fed in some experiments (Moody et al. Citation2007; Lascano et al. Citation2016), but only alfalfa hay was fed to calves in the present study.
In our trial, changes in ADG among treatments followed a similar pattern to hip width and hip height, indicating that a portion of the observed ADG was structural. In line with our findings, Hill et al. (Citation2010) reported hip width decreased linearly as forage was increased in diets. Furthermore, Aragona et al. (Citation2020) showed final hip width and change in hip width were greater for calves fed limited chopped versus free choice long hay diets. In addition, Hu et al. (Citation2018) reported the calves had greater hip width change (p < .001; R2 = 0.75) with increasing starch concentration in the diet. Our results demonstrated that decreasing forage level coincides with increasing starch concentration and NFC/NDF ratio of dry feed not only improved ADG but also increased frame size in Holstein calves up to 120 d of age. Alternatively, Stamey et al. (Citation2012) reported that greater protein intake from dry feed supports lean tissue and structural growth in the calves. Although dietary protein level was similar between treatments in the current study, DMI (hence protein intake) increased linearly as concentrate increased, which contributes to the structural growth of calves.
Plasma glucose concentration at d 95 increased linearly with decreasing forage level and NFC/NDF ratio. In agreement with our results, Stobo et al. (Citation1966) reported higher glucose concentration in calves fed a high-concentrate diet than the mean value found in calves fed a high-roughage diet. Moreover, increased glucose levels with lower forage inclusion could be due to greater feed intake. This effect on glucose levels may be related to higher energy availability, as confirmed by ADG responses.
In the present study, BUN decreased linearly as concentrate was incorporated into diets. Urea level can be influenced by dietary energy availability, as reported by Abeni (Citation2000). In agreement with previous studies (Nemati et al. Citation2016), plasma BHB concentrations decreased linearly as concentrate levels increased in diets. It is well established that VFA are absorbed from the rumen, but not all the VFA appears in peripheral blood. Stobo et al. (Citation1966) established that rumen epithelial cells metabolised butyrate and produced an increase in the concentration of BHB in the portal blood.
There are very few studies that evaluated the effects of forage level on the behaviour of weaned calves. In the present study, time devoted to rumination decreased and to lying increased with a reduction of the forage level in diets. Thus, when the forage level was increased, calves spent more time ruminating as the NDF concentration increased in the forage. The benefits of forage supplementation on stimulating rumination have been previously demonstrated (Castells et al Citation2012; Nemati et al. Citation2015). Rumination time decreased linearly as concentrate replaced forage, and it was likely related to the decreased need for particle size reduction (Beauchemin Citation2001). Intake of peNDF is the main contributing factor to rumination time (Mertens Citation1997), and higher intake of peNDF in calves fed high forage diets likely caused the longer rumination time than calves fed low forage diets. The results of the current experiment showed that intake of peNDF, similar to lactating cows, probably are the main contributing factors to rumination time in weaned calves. Furthermore, calves spent more time lying in the current study when fed greater levels of concentrate, suggesting that these calves were less active. Differences in lying behaviour among treatments could be explained by calves fed high-forage diets spending more time ruminating, which occurs primarily while lying. In addition, results of the present study showed a tendency for quadratic effect of forage level on the non-nutritive oral behaviour, with higher values observed for F35 than F50 and F20 calves, which might be related to digestive health issues and animal discomfort (Leruste et al. Citation2014). Therefore, greater faecal score in these calves could be partially attributed to higher non-nutritive oral behaviour, possibly due to lower fibre digestibility and numerically poor energy utilisation efficiency. In confirmation of our results, it has been shown that cross-sucking in calves as a non- nutritive oral behaviour was associated with reduced BW at weaning (Mahmoud et al. Citation2016). Moreover, there was a lesser amount of time devoted to lying in calves fed F35 diets. Sufficient resting is particularly important for growing animals, and lying behaviour might be an important indicator of calf comfort (Bonk et al. Citation2013). Therefore, behaviour responses of calves in F35 group might be indicative of their poor welfare status. However, more detailed research is needed to understand the effects of weaned calves’ behaviour on performance and energy utilisation efficiency during grower phase and their future lactation performance.
Conclusion
Our results indicate that lower forage to concentrate and NDF to NFC ratio in diets adjusted for protein concentration improved the performance of dairy calves after weaning. This study supports that high-concentrate diets with high NFC/NDF ratio given to weaned calves at 70 d of age promoted faster growth than high-forage diets, and forage should be fed at a restricted level to calves from 70 to 120 d of age to achieve optimal growth. Moreover, high concentrate diet increased lying behaviour and decreased rumination behaviour.
Ethical Approval
Animal procedures were performed in accordance with protocol no. IRN-19293, approved by the Iranian Council of Animal Care (1995).
Acknowledgements
The authors thank the staff of the Dairy Research and Teaching Unit of Isfahan University of Technology for the technical assistance. The authors express their appreciation to the managers and staff of Emdad Sepahan Goldasht Agriculture and Animal Husbandry Co. (Isfahan, Iran) for their kind assistance and diligent animal care.
Data availability statement
The data that support the findings of this study are available from the corresponding author, [F. Hashemzadeh], upon reasonable request.
Additional information
Funding
References
- Abeni F, Calamari L, Stefanini L, Pirlo G. 2000. Effects of daily gain in pre- and postpubertal replacement dairy heifers on body condition score, body size, metabolic profile, and future milk production. J Dairy Sci. 83(7):1468–1478.
- Allen MS. 2000. Effects of diet on short-term regulation of feed intake by lactating dairy cattle. J Dairy Sci. 83(7):1598–1624.
- Anderson KL, Nagaraja TG, Morrill JL. 1987. Ruminal metabolic development in calves weaned conventionally or early. J Dairy Sci. 70(5):1000–1005.
- AOAC. 2002. Association of Official Analytical Chemists Publ. 17th ed. 1st rev. Gaithersburg (MD): AOAC.
- Aragona KM, Suarez-Mena FX, Dennis TS, Quigley JD, Hu W, Hill TM, Schlotterbeck RL. 2020. Effect of starter form, starch concentration, and amount of forage fed on Holstein calf growth from 2 to 4 months of age. J Dairy Sci. 103(3):2324–2332.
- ASABE. 2003. Methods of determining and expressing fineness of feed materials by sieving. Standard No. S319.3. St. Joseph (MI): American Society of Agricultural and Biological Engineers; p. 202–205.
- Beauchemin KA, Yang WZ, Morgavi DP, Ghorbani GR, Kautz W, Leedle JAZ. 2003. Effects of bacterial direct-fed microbials and yeast on site and extent of digestion, blood chemistry, and subclinical acidosis in feedlot cattle. J Anim Sci. 81(6):1628–1640.
- Beauchemin K, Yang W, Rode L. 2001. Effects of barley grain processing on the site and extent of digestion of beef feedlot finishing diets. J Anim Sci. 79(7):1925–1936.
- Beharka AA, Nagaraja TG, Morrill JL, Kennedy GA, Klemm RD. 1998. Effects of form of the diet on anatomical, microbial, and fermentative development of the rumen of neonatal calves. J Dairy Sci. 81(7):1946–1955.
- Beiranvand H, Ghorbani GR, Khorvash M, Nabipour A, Dehghan-Banadaky M, Homayouni A, Kargar S. 2014. Interactions of alfalfa hay and sodium propionate on dairy calf performance and rumen development. J Dairy Sci. 97(4):2270–2280.
- Bonk S, Burfeind O, Suthar VS, Heuwieser W. 2013. Technical note: Evaluation of data loggers for measuring lying behavior in dairy calves. J Dairy Sci. 96(5):3265–3271.
- Bull LS, Bush LJ, Friend JD, Harris B, Jones EW. 1965. Incidence of ruminal parakeratosis in calves fed different rations and its relation to volatile fatty acid absorption. J Dairy Sci. 48(11):1459–1466.
- Castells L, Bach A, Araujo G, Montoro C, Terré M. 2012. Effect of different forage sources on performance and feeding behavior of Holstein calves. J Dairy Sci. 95(1):286–293.
- Dong L, Li B, Diao Q. 2019. Effects of dietary forage proportion on feed intake, growth performance, nutrient digestibility, and enteric methane emissions of Holstein heifers at various growth stages. Animals. 9:725–739.
- Heinrichs AJ. 1993. Raising dairy replacements to meet the needs of the 21st century. J Dairy Sci. 76(10):3179–3187.
- Hill TM, Bateman HG, Aldrich JM, Schlotterbeck RL. 2010. Roughage amount, source, and processing for diets fed to weaned dairy calves. Prof Anim Sci. 26(2):181–187.
- Hill TM, Bateman HG, Aldrich JM, Schlotterbeck RL. 2012. High-starch, coarse-grain, low-fiber diets maximize growth of weaned dairy calves less than 4 months of age. Prof Anim Sci. 28(3):325–331.
- Hill TM, Bateman HG, Aldrich JM, Schlotterbeck RL. 2008. Effects of the amount of chopped hay or cottonseed hulls in a textured calf starter on young calf performance. J Dairy Sci. 91(7):2684–2693.
- Hill TM, Quigley JD, Bateman HG, Aldrich JM, Schlotterbeck RL. 2016. Source of carbohydrate and metabolizable lysine and methionine in the diet of recently weaned dairy calves on digestion and growth. J Dairy Sci. 99(4):2788–2796.
- Hill TM, Suarez-Mena FX, Dennis TS, Quigley JD, Schlotterbeck RL. 2019. Effects of free-choice hay on intake and growth of Holstein calves fed a textured starter to 2 months of age. Appl Anim Sci. 35(2):161–168.
- Hinders RG, Owen FG. 1965. Relation of ruminal parakeratosis development to volatile fatty acid absorption. J Dairy Sci. 48(8):1069–1073.
- Hu W, Hill TM, Dennis TS, Suarez-Mena FX, Quigley JD, Knapp JR, Schlotterbeck RL. 2018. Relationships between starch concentration of dry feed, diet digestibility, and growth of dairy calves up to 16 weeks of age. J Dairy Sci. 101:1–9.
- Iranian Council of Animal Care. 1995. Guide to the care and use of experimental animals. Vol. 1. Isfahan (Iran): Isfahan University of Technology.
- Jahn E, Chandler PT, Polan CE. 1970. Effects of fiber and ratio of starch to sugar on performance of ruminating calves. J Dairy Sci. 53(4):466–474.
- Khan MA, Lee HJ, Lee WS, Kim HS, Ki KS, Hur TY, Suh GH, Kang SJ, Choi YJ. 2007. Structural growth, rumen development, and metabolic and immune responses of Holstein male calves fed milk through step-down and conventional methods. J Dairy Sci. 90(7):3376–3387.
- Khan MA, Lee HJ, Lee WS, Kim HS, Kim SB, Ki KS, Ha JK, Lee HG, Choi YJ. 2007. Pre- and postweaning performance of Holstein female calves fed milk through step-down and conventional methods. J Dairy Sci. 90(2):876–885.
- Khan MA, Lee HJ, Lee WS, Kim HS, Kim SB, Park SB, Baek KS, Ha JK, Choi YJ. 2008. Starch source evaluation in calf starter: II. Ruminal parameters, rumen development, nutrient digestibilities, and nitrogen utilization in Holstein calves. J Dairy Sci. 91(3):1140–1149.
- Kljak K, Pino F, Heinrichs AJ. 2017. Effect of forage to concentrate ratio with sorghum silage as a source of forage on rumen fermentation, N balance, and purine derivative excretion in limit-fed dairy heifers. J Dairy Sci. 100(1):213–223.
- Kononoff PJ, Heinrichs AJ, Buckmaster DR. 2003. Modification of the Penn State forage and total mixed ration particle separator and the effects of moisture content on its measurements. J Dairy Sci. 86(5):1858–1863.
- Lammers BP, Buckmaster DR, Heinrichs AJ. 1996. A simple method for the analysis of particle sizes of forage and total mixed rations. J Dairy Sci. 79(5):922–928.
- Lascano GJ, Koch LE, Heinrichs AJ. 2016. Precision-feeding dairy heifers a high rumen-degradable protein diet with different proportions of dietary fiber and forage-to-concentrate ratios. J Dairy Sci. 99(9):7175–7190.
- Leruste H, Brscic M, Cozzi G, Kemp B, Wolthuis-Fillerup M, Lensink BJ, Bokkers EAM, van Reenen CG. 2014. Prevalence and potential influencing factors of non-nutritive oral behaviors of veal calves on commercial farms. J Dairy Sci. 97(11):7021–7030.
- Lesmeister KE, Heinrichs AJ. 2004. Effects of corn processing on growth characteristics, rumen development, and rumen parameters in neonatal dairy calves. J Dairy Sci. 87(10):3439–3450.
- Mahmoud ME, Mahmoud FA, Ahmed AE. 2016. Impacts of self- and cross-sucking on cattle health and performance. Vet World. 9(9):922–928.
- Mertens DR. 1997. Creating a system for meeting the fiber requirements of dairy cows. J Dairy Sci. 80(7):1463–1481.
- Moody ML, Zanton GI, Daubert JM, Heinrichs AJ. 2007. Nutrient utilization of differing forage-to-concentrate ratios by growing Holstein heifers. J Dairy Sci. 90(12):5580–5586.
- Nemati M, Amanlou H, Khorvash M, Mirzaei M, Moshiri B, Ghaffari MH. 2016. Effect of different alfalfa hay levels on growth performance, rumen fermentation, and structural growth of Holstein dairy calves. J Anim Sci. 94:1–8.
- Nemati M, Amanlou H, Khorvash M, Moshiri B, Mirzaei M, Khan MA, Ghaffari MH. 2015. Rumen fermentation, blood metabolites, and growth performance of calves during transition from liquid to solid feed: effects of dietary level and particle size of alfalfa hay. J Dairy Sci. 98(10):7131–7141.
- NRC. 2001. Nutrient requirements of dairy cattle. 7th rev. ed. Washington (DC): National Academy of Sciences.
- Owens FN, Secrist DS, Hill WJ, Gill DR. 1998. Acidosis in cattle: a review. J Anim Sci. 76(1):275–286.
- Porter JC, Warner RG, Kertz AF. 2007. Effect of fiber level and physical form of starter on growth and development of dairy calves fed no forage. Prof Anim Sci. 23(4):395–400.
- Ramos S, Tejido ML, Martínez ME, Ranilla MJ, Carro MD. 2009. Microbial protein synthesis, ruminal digestion, microbial populations, and nitrogen balance in sheep fed diets varying in forage-to-concentrate ratio and type of forage. J Anim Sci. 87(9):2924–2934.
- Redbo I, Nordblad A. 1997. Stereotypies in heifers are affected by feeding regime. Appl Anim Behav Sci. 53(3):193–202.
- Rotger A, Ferret A, Calsamiglia S, Manteca X. 2005. Changes in ruminal fermentation and protein degradation in growing Holstein heifers from 80 to 250 kg fed high-concentrate diets with different forage-to-concentrate ratios. J Anim Sci. 83(7):1616–1624.
- Roth BA, Keil NM, Gygax L, Hillmann E. 2009. Influence of weaning method on health status and rumen development in dairy calves. J Dairy Sci. 92(2):645–656.
- SAS. 2002. User’s guide: statistics. Version 9.1. Cary (NC): SAS Inst. Inc.
- Stamey JA, Janovick NA, Kertz AF, Drackley JK. 2012. Influence of starter protein content on growth of dairy calves in an enhanced early nutrition program. J Dairy Sci. 95(6):3327–3336.
- Stobo IJ, Roy JH, Gaston HJ. 1966. Rumen development in the calf. 2. The effect of diets containing different proportions of concentrates to hay on digestive efficiency. Br J Nutr. 20(2):189–215.
- Strozinski LL, Chandler PT. 1971. Effect of dietary fiber and acid detergent lignin on body fill of ruminating calves. J Dairy Sci. 54(10):1491–1495.
- Terre M, Pedrals E, Dalmau A, Bach A. 2013. What do preweaned and weaned calves need in the diet: a high fiber content or a forage source. J Dairy Sci. 96(8):5217–5225.
- Van Keulen V, Young BH. 1977. Evaluation of acid-insoluble ash as natural marker in ruminant digestibility studies. J Anim Sci. 26:119–135.
- Van Soest PJ. 1994. Nutritional ecology of the ruminant. 2nd ed. Ithaca (NY): Comstock Publishing Associates.
- Van Soest PJ, Robertson JB, Lewis BA. 1991. Methods for dietary fiber, neutral detergent fiber, and nonstarch polysaccharides in relation to animal nutrition. J Dairy Sci. 74(10):3583–3597.
- Vazquez-Anon M, Heinrichs AJ, Aldrich JM, Varga GA. 1993. Effect of postweaning age on rate of in situ protein disappearance in calves weaned at 5 weeks of age. J Dairy Sci. 76(9):2749–2757.
- Xue M, Wang K, Wang A, Li R, Wang Y, Sun S, Yan D, Song G, Xu H, Sun G, et al. 2019. MicroRNA sequencing reveals the effect of different levels of non-fibrous carbohydrate/neutral detergent fiber on rumen development in calves. Animals. 9:496–510.
- Zanton GI, Heinrichs AJ. 2009. Limit feeding with altered forage to concentrate levels in dairy heifer diets. Prof Anim Sci. 25(4):393–403.
- Zebeli Q, Dijkstra J, Tafaj M, Steingass H, Ametaj BN, Drochner W. 2008. Modeling the adequacy of dietary fiber in dairy cows based on the response of ruminal pH and milk fat production to composition of the diet. J Dairy Sci. 91(5):2046–2066.
- Zhu L, Jones C, Guo Q, Lewis L, Stark CR, Alavi S. 2016. An evaluation of total starch and starch gelatinization methodologies in pelleted animal feed. J Anim Sci. 94(4):1501–1507.