
Abstract
An unsupervised machine learning approach (ML) of rumination time (RT) data was used to evaluate metabolic and lactation performance in a cohort of Simmental dairy cows (29) around parturition. The k-means clustering (unsupervised ML) was used to generate clusters based on RT (Hr-Tags; SCR by Allflex) over 24 h from 1 to 7-d post-calving. Two large clusters were obtained: high (High-RT, n = 13) and low (Low-RT, n = 12). Milk production was recorded until 42 d in lactation and milk samples collected weekly. Blood samples were collected from −21 to +28 d relative to calving. Data were subjected to PROC MIXED of SAS. Compared with Low-RT, High-RT cows had lower plasma BHB (3, 7, and 14 d), haptoglobin (3 and 7 d), and non-esterified fatty acids (1 and 3 d). High-RT cows had greater tocopherol from 3 to 28 d, fructosamine and albumin at 7 d, and retinol at 3 and 7 d after calving than Low-RT cows. Compared with multiparous Low-RT, milk production was greater in multiparous High-RT cows, but no differences were detected for primiparous. Only for multiparous, High-RT cows displayed a greater LFI than Low-Rt cows. The close relationship between RT and the physiological state at the onset of lactation supports the use of RT as an indicator of metabolic and inflammatory adaptations to the negative energy balance of cows after parturition. At the farm level, these outcomes provide information to farmers that can be helpful in management decisions for cow health, complementing traditional methods.
The unsupervised ML applied was able to group cows with different RT increase rates after calving based on differences in plasma biomarkers of energy metabolism, inflammatory response, and liver functionality, particularly in multiparous cows.
A quicker increase in RT after calving was associated with a lower inflammatory response, lower lipid mobilisation, and greater milk production.
At the farm level, the fine-tuning of specific algorithm in the actual sensors considering the rate of increase of RT after calving can be helpful in management decisions for cow health, complementing traditional methods to better monitor early lactation dairy cows.
HIGHLIGHTS
Introduction
Rumination time (RT) in dairy cows has been estimated at approximately 7 h/d (Beauchemin Citation1991, Citation2018; White et al. Citation2017) but can vary broadly, for example, 2.5 to 10.5 h/d. This high variability depends on several factors including chemical and physical characteristics of the diet such as NDF intake, particle size, the resistance of feed to chewing, and indigestibility of the fibre (Beauchemin Citation2018). Furthermore, RT is influenced by acute stress (Herskin et al. Citation2004), health status (Calamari et al. Citation2014; Liboreiro et al. Citation2015; Kaufman et al. Citation2018a), and environmental factors such as climatic conditions (Soriani et al. Citation2013).
Rumination behaviour can be evaluated and measured directly by visual observation taken either live or from a video recording of cows. Indirect methods for monitoring RT have recently been proposed. These systems perform automatic RT measurements and allow researchers to easily observe the behaviour of dairy cows through large-scale studies. In this regard, some authors investigated the use of RT monitoring for early detection of health problems in the transition period. Soriani et al. (Citation2012) reported that cows with reduced RT before calving maintained reduced RT also after parturition and had a higher incidence of clinical diseases (mastitis, lameness, ketosis, and displacement abomasum). Indeed, RT observed during the first days of lactation was correlated with blood markers of inflammation during the first month of lactation, where a slower increase of RT in the first week of lactation was associated with a severe inflammation status around parturition and a greater risk of health problems during early lactation (Calamari et al. Citation2014). This condition can result in lower milk production (McArt et al. Citation2012; Kaufman et al. Citation2018) and reduced reproductive performance (Walsh et al. Citation2007).
Despite the clear benefit, these monitoring systems generate large and complex data sets. Machine learning (MT) algorithms could be a potential approach to provide actionable knowledge from large data sets. Indeed, ML approaches are becoming of interest as a systems biology tool to improve metabolic profiling endeavours (Loor et al. Citation2005a; Ghaffari et al. Citation2019). Unsupervised learning techniques can be used to uncover patterns or intrinsic structures in unlabelled data. Clustering techniques, for example, are frequently used for exploratory data analysis to uncover hidden patterns or groupings in data (Brotzman et al. Citation2015; Adamczyk et al. Citation2017).
Since there is inherent between-animal variation at herd level in time spent ruminating, we hypothesised that machine-learning methods approach on rumination data in the first week after calving would indicate a typical physiological state and milk performance throughout the very early lactation. Thus, the objective of the current study was to apply a cluster-analytic approach (defined as a ML application) on RT data recorded by Hr-Tags in the first week after calving to detect differences in metabolic state and lactation performance among Simmental dairy cows in early lactation.
Materials and methods
Animal management and treatment
The trial was carried out in accordance with Italian laws on animal experimentation (DL n. 26, 04/03/2014) and received an institutional approval from the Ethical Animal Care and Use Committee of the Magna Graecia University of Catanzaro (Protocol No. 302-5/5/2017). The farm owner was previously informed and the consent for animal use was obtained in compliance with the purposes and methods of the research.
During winter season, a total of 29 Simmental dairy cows [17 multiparous (Mu) and 12 primiparous (Pr)] in a commercial dairy farm in Southern Italy (Calabria) were monitored for rumination behaviour across the transition period (from −21 ± 4 to 30 d relative to parturition). Average temperature-humidity-index (Ingraham et al. Citation1979) during the trial was 53.4 (range: 41.0 − 65.7; Supplemental Figure S1). During the dry period and until parturition, cows were housed in a free-walking straw barn. After parturition cows were moved to a lactation-free-walking barn bedded with straw. Cows were fed a TMR once daily (0700 and 0800 h for lactating and dry cows, respectively), and diet composition used in close-up and early lactation periods are reported in Table . After parturition, lactating cows were milked twice daily (at 0500 and 1700 h) in a herringbone milking parlour with 8 units. Cows in this study were examined daily for health-related problems by visual observation, temperature check, and monitoring milk yield.
Figure 1. Workflow overview of the experimental setup for on farm data collection to unsupervised ML algorithm (k-means) analysis to cluster Simmental cows according to rumination time (RT) recorded in the first week after parturition (from 1 to 7 d) by Hr-Tags rumination loggers (Hr-LD; SCR by Allflex).
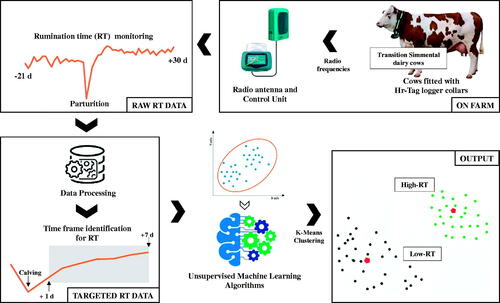
Table 1. Ingredient and nutrient composition of close-up (from −21 to parturition) and early lactation (from parturition to 30 d of lactation) diets fed to Simmental dairy cows.
Rumination behaviour monitoring
Throughout the entire experimental period, cows were fitted with Hr-Tag loggers and a counterweight (size = 70 × 70 × 30 mm; weight = 540 g) attached to the neck collar.
The Hr-Tag rumination monitoring system (SCR by Allflex, Netanya, Israel) consisted of rumination and activity loggers (Hr-LD version), stationary readers, and software for processing the electronic data (Heatime® system, SCR Engineers Ltd.). A neck collar was used to keep the tag behind the left ear in the upper third of the neck. The tag contains an accelerometer to detect activity and a microphone that recognises and records the distinctive sounds of regurgitation and rumination. Each time a bolus is regurgitated, re-masticated, and swallowed, the tag can determine the total time spent ruminating during each 2-h interval throughout the day. This information is then transferred to the control unit via radio frequency. Data were backed up from the control unit and downloaded weekly. The twelve 2-h interval each day were summed to determine the total time spent ruminating per cow per day (Calamari et al. Citation2014; Lopreiato et al. Citation2018, Citation2020).
Milk yield, sample collection, and analysis
Milk production was recorded at 0, 1, 3, 7, 15, 21, 30, and 42 d in lactation from consecutive morning and evening milking at each time point by collecting in the milking bucket all the milk produced and then weighted. Milk samples were collected at 7, 15, 21, 30, and 42 d in lactation in the morning and evening and analysed separately for protein, fat, lactose, casein, BHB, and urea by mid-infrared procedures using Milkoscan FT+ (Foss Electric A/S, 3400 Hillerød, Denmark) at Magna Graecia University of Catanzaro.
Blood sample collection and biomarker analysis
Blood samples were obtained before TMR was delivered in the morning at −21 ± 4, −7 ± 2, 1, 3, 7, 14, and 28 d relative to parturition. Blood samples were collected from the jugular vein using an 18-gauge Vacutest Kima needle (Vacutest Kima srl, Arzergrande, Italy) into 9-mL vacutainers test tubes (Vacutest Kima srl, Arzergrande, PD, Italy) containing lithium heparin, and immediately cooled in an ice-water bath. After collection, blood samples were centrifuged at 1900 × g for 16 min at 4 °C. Plasma obtained was aliquoted and stored at −20 °C until metabolites analysis.
Plasma metabolites were analysed at 37 °C by an automated clinical analyser (ILAB 650, Instrumentation Laboratory Company, Lexington, MA, USA). Commercial kits were used to measure glucose, total cholesterol, triglycerides, urea, calcium, inorganic phosphorus, magnesium, total protein, albumin, total bilirubin, and creatinine (Instrumentation Laboratory SpA, Milan, Italy), non-esterified fatty acids (NEFA), and zinc (Wako, Chemicals GmbH, Neuss, Germany), and β-hydroxybutyric acid (BHB, kit Ranbut, Randox Laboratories Ltd, Crumlin, Co Antrim, United Kingdom). Electrolytes (Na+, K+, and Cl−) were detected by the potentiometer method (Ion Selective Electrode connected to ILAB 650). The total globulin fraction was determined by subtracting the albumin from the total protein. Haptoglobin and ceruloplasmin concentrations were measured using methods proposed by Bertoni et al. (Citation2008a) adapted to ILAB 650 conditions. Plasma paraoxonase (PON, 3.1.8.1) activity was assessed by adapting the method of Ferré et al. (Citation2002) to the ILAB 650. The concentration of Fructosamine was determined using the commercial kit Fructosamine (Randox) according to Caré et al. (Citation2018a). Oxidative stress was evaluated via total reactive oxygen metabolites (ROM) as described by Bionaz et al. (Citation2007); myeloperoxidase (MPO, EC 1.11.2.2) as described by Bionaz et al. (Citation2007), via colorimetry based on the reaction of MPO contained in the plasma sample with hydrogen peroxide, which forms H2O and O-; the o-dianisidine dihydrochloride, and electron donor, reacts with the O-, releasing H2O and a coloured compound; ferric reducing antioxidant power (FRAP) using the colorimetric method of Benzie and Strain (Citation1996), and advanced oxidation protein products (AOPP) as described by Hanasand et al. (Citation2012). Plasma thiol groups (SHp) were determined by titration with 5,5-dithiobis-2-nitrobenzoic acid using a commercial kit (Diacron, Italy). Plasma retinol, tocopherol, and β-carotene were extracted with hexane and analysed by reverse-phase HPLC using Spherisorb ODS-2, 3 μm, in a 150 × 4.6 mm column (Alltech, Deerfield, IL); a UV detector set at 325 (for retinol), 290 (for tocopherol), or 460 nm (for β-carotene) and 80:20 methanol: tetrahydrofuran as the mobile phase.
Albumin, cholesterol and bilirubin data were used to determine the liver functionality index (LFI) according to Trevisi et al. (Citation2011). This index considers changes in albumin, lipoproteins (measured as total cholesterol), and total bilirubin occurring between 3 and 28 d after calving.
Statistical analysis
The k-means clustering procedure in SAS (PROC FASTCLUS; SAS Institute Inc., Cary, NC) was used to generate clusters. The mean, median, maximum, and standard deviation of RT during the whole day (from 0:00 to 22:00) from d 1 to 7 after calving were included as main features for the clustering analysis. For clustering validation, the estimation of the optimal number of clusters for K-means clustering was done based on examining the between-cluster separation and the within-cluster homogeneity (similarity) and the Elbow method. Two large clusters were obtained: High-RT (n = 13; Mu = 8 and Pr = 5) and Low-RT (n = 12; Mu = 7 and Pr = 5) (Figure ). A small cluster (n = 4) was also identified but not included for further statistical analysis due to the small cluster size.
After identifying cluster groups, a repeated-measures model was fitted to data using the PROC MIXED procedure of SAS (version 9.4; SAS Institute Inc., Cary, NC). A covariance structure was chosen based on the best Akaike Information Criterion (AIC) and Bayesian information criteria (BIC) indexes. Before analysis, all data were tested for normality of distribution by evaluating the Shapiro–Wilk statistic using the univariate procedure of SAS, and where appropriate, they were transformed using a log10 transformation. The model included rumination time (Cluster; High- and Low-RT cows), time from calving (Day), parity (Mu and Pr), and their interaction (Cluster × Day, Cluster × Parity, and Cluster × Parity × Day) as fixed effects, and cows as the random effect. Data were considered significant at p ≤ .05, using the PDIFF statement in SAS. In addition, when a significant interaction was identified, LSMEANS statement in SAS was used to compare means at each time point.
Results
Health status
Disease incidence were recorded during close-up (from −21 d to parturition) and early lactation (from 1 to 42 d in lactation) periods. During the close-up, only 1 lameness case occurred in the High-RT group. During early lactation, 2 lameness, 1 mastitis, and 1 metritis occurrence were detected in the High-RT group, whereas in the Low-RT group 1 mastitis, 3 retained placenta, and 2 sub-clinical ketosis (BHB between 1.2 and 2.0 mmol/L in the first 2 wk after calving) cases were recorded.
Rumination behaviour
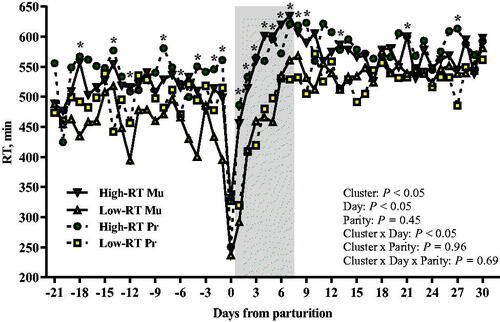
Cows were clustered into two groups according to RT between 1 and 7 d after calving. Overall, the RT was not affected by parity (p = .45) or interactions with parity (Cluster × Parity, p = .96; Cluster × Day × Parity, p = .69). High-RT and Low-RT groups had an average of 551 ± 11.78 min/day and 497 ± 12.04 min/d of RT (LSM ± SEM), respectively, across the transition period from −21 to 30 d relative to calving. Overall, daily RT in the first week postpartum was 467 ± 15.15 min/d, with a difference of approximately 100 min/d (p < .05) between High-RT and Low-RT groups (518 ± 22.54 min/d and 417 ± 23.15 min/d, respectively; Figure ).
Figure 2. Daily pattern of rumination time (LSM) from −30 to 30 d from parturition in Simmental primiparous and multiparous dairy cows categorised by k-means clustering analysis according to rumination time (RT) recorded between 1 and 7 d after parturition. Asterisks (*) represent differences at p ≤ 0.05 between High-RT and Low-RT cows within each time point across the transition period (−21 to 30 d relative to calving).
Milk performance
Milk yield and quality data are reported in Table for the main effects of Cluster, Parity, Day, and their interaction. Furthermore, Supplemental Table S1 reports changes over time (regardless of Cluster, Parity, or their interactions) for milk quality components from 7 to 42 d of lactation. Overall, milk yield was on average 20.64 ± 0.01 kg/d (LSM ± SEM) between parturition and 42 d in lactation (Figure ). As expected, there was an effect of parity (p < .05), with Mu cows having greater milk yield (23.26 ± 0.62 kg/d) compared with Pr cows (18.02 ± 0.73 kg/d). Overall, differences were detected between High-RT and Low-RT cows (Cluster, p < .05). High-RT cows had greater milk production (21.80 ± 0.68 kg/d) compared with Low-RT cows (19.48 ± 0.68 kg/d). The interaction Cluster × Parity affected milk yield (p < .05). Indeed, compared with Low-RT Mu (21.06 ± 0.87 kg/d), High-RT Mu had greater milk production (25.45 ± 0.88 kg/d), whereas no differences were detected between High-RT Pr and Low-RT Pr (18.15 ± 1.03 vs 17.90 ± 1.03 kg/d, respectively; p = .87).
Figure 3. Milk yield in the first 42 d of lactation of Simmental primiparous (High-RT Pr and Low-RT Pr) and multiparous (High-RT Mu and Low-RT Mu) dairy cows categorised by k-means clustering analysis according to rumination time (RT) recorded between 1 and 7 d after calving.
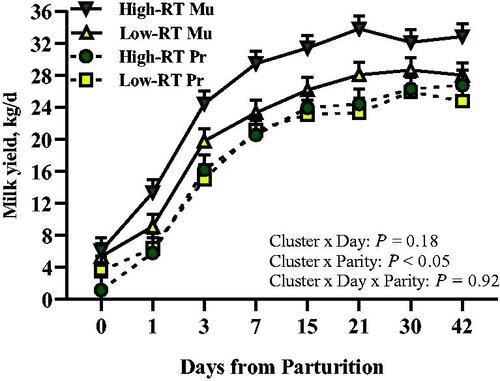
Table 2. LSM of Milk yield (0 to 42 d) and quality (7 to 42 d) from Simmental primiparous (n = 10) and multiparous (n = 15) dairy cows categorised by k-means clustering analysis (unsupervised ML algorithm) according to rumination time (RT) between 1 and 7 d after parturition.
Cluster affected milk urea level, being greater in the High-RT compared with Low-RT group (27.98 ± 0.94 mg/dL and 24.15 ± 0.99 mg/dL, respectively; p < .05). Regardless of Cluster, Pr cows had greater (p < .05) milk lactose (4.89 ± 0.03%) than Mu cows (4.48 ± 0.03%). The interaction Cluster × Day was significant for fat content (p < .05; Figure ), where at 7 d after calving the Low-RT compared with High-RT group had greater content.
Figure 4. Effect of Cluster (High-RT vs Low-RT) on milk fat percentage (A), and effect of Cluster × Parity × Day on milk BHB (B) in the first 42 d of lactation of Simmental primiparous (High-RT Pr and Low-RT Pr) and multiparous (High-RT Mu and Low-RT Mu) dairy cows categorised by k-means clustering analysis according to rumination time (RT) recorded between 1 and 7 d after calving. Asterisks (*) represent differences at p ≤ 0.05 between High-RT and Low-RT cows within each time point. Different letters (a–c) indicate significant differences among groups within each time point (p ≤ 0.05).
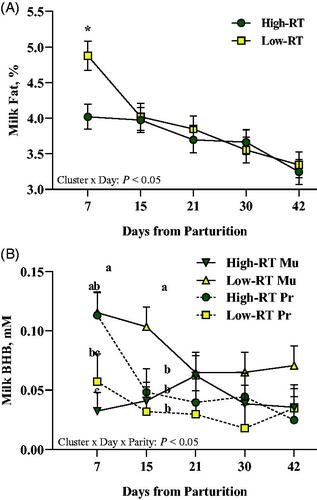
Concerning milk BHB concentration, it was affected by the interaction Cluster × Parity and by the interaction Cluster × Parity × Day. Overall, Low-RT Mu had greater milk BHB concentration (p < .05) compared with High-RT Mu and Low-RT Pr, but similar concentration compared with High-RT Pr (p = .10). In addition, for Pr cows, no differences were detected between High-RT and Low-RT (p = .31). Compared with High-RT Mu and Low-RT Pr cows, Low-RT Mu cows also had greater milk BHB concentration at 7 and 15 d after calving (p < .05; Figure ), whereas only at 15 d compared with High-RT Pr cows.
Blood biomarkers
Except FRAP, all plasma biomarkers were affected by Day (p < .05; Supplemental Table S2). Differences between Pr and Mu were observed for BHB, glucose, PON, haptoglobin, bilirubin, and P (p ≤ .05). Overall, Pr had a greater concentration of glucose, PON and P compared with Mu, whereas the latter had a greater concentration of BHB, haptoglobin, and bilirubin compared with Pr. Overall, the main effect of Cluster affected tocopherol, Mg and AOPP (p < .05), where High-RT cows had greater concentration compared with Low-RT cows.
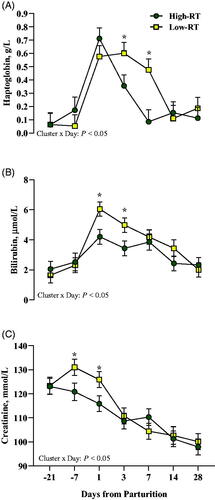
Compared with Low-RT cows, the High-RT group had lower plasma BHB at 3, 7, and 14 d (Cluster × Day, p < .05; Figure ), lower NEFA at 1, 3, and 14 d (Cluster × Day, p < .05; Figure ), and greater fructosamine at 7 d after calving (Cluster × Day, p < .05; Figure ). At 3 and 7 d after calving, High-RT cows had lower levels of haptoglobin (Cluster × Day, p < .05; Figure ) compared with Low-RT cows. Lower levels of bilirubin at 1 and 3 d (Cluster × Day, p < .05; Figure ), and creatinine at −21 and −7 d (Cluster × Day, p < .05; Figure ) relative to parturition were observed in High-RT compared with Low-RT cows.
Figure 5. Effect of Cluster (High-RT vs Low-RT) on plasma haptglobin (A), bilirubin (B), and creatinine (C) across the transition period (from −21 to 28 d relative to parturition) in Simmental dairy cows categorised by k-means clustering analysis according to rumination time (RT) recorded between 1 and 7 d after calving. Asterisks (*) represent differences at p ≤ 0.05 between High-RT and Low-RT cows within each time point.
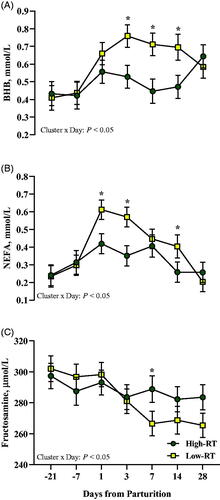
Figure 6. Effect of Cluster (High-RT vs Low-RT) on plasma BHB (A), NEFA (B), and fructosamine (C) across the transition period (from −21 to 28 d relative to parturition) in Simmental dairy cows categorised by k-means clustering analysis according to rumination time (RT) recorded between 1 and 7 d after calving. Asterisks (*) represent differences at P ≤ 0.05 between High-RT and Low-RT cows within each time point.
After calving, compared with Low-RT cows, High-RT cows had greater albumin at 7 d (Cluster × Day, p < .05; Figure ), greater retinol at 3 and 14 d (Cluster × Day, p < .05; Figure ), and greater tocopherol at 3, 7, 14, and 28 d (Cluster × Day, p < .05; Figure ). Overall, differences were observed in multiparous cows, where Low-RT had greater BHB compared with High-RT cows (Cluster × Parity, p < .05; Table ).
Figure 7. Effect of Cluster (High-RT vs Low-RT) on plasma albumin (A), retinol (B), and tocopherol (C) across the transition period (from −21 to 28 d relative to parturition) in Simmental dairy cows categorised by k-means clustering analysis according to rumination time (RT) recorded between 1 and 7 d after calving. Asterisks (*) represent differences at p ≤ 0.05 between High-RT and Low-RT cows within each time point.
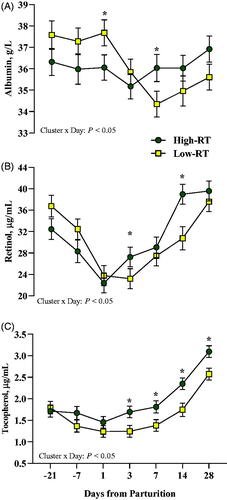
Table 3. Plasma biomarkers (LSM) during the close-up (from −21 d to parturition) and fresh (from 1 to 28 d after calving) periods in Simmental primiparous (n = 10) and multiparous (n = 15) dairy cows categorised by k-means clustering analysis (unsupervised ML algorithm) according to rumination time (RT) between 1 and 7 d after parturition.
Overall, data indicated that High-RT Mu had greater levels of retinol compared with Low-RT Mu (Cluster × Parity, p < .05; Table ), whereas no differences were detected between High-RT Pr and Low-RT Pr (Cluster × Parity, p = .11; Table ).
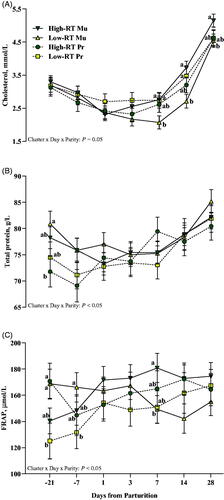
Interestingly, compared with Low-RT Mu (Cluster × Parity × Day, p < .05; Figure ), High-RT Mu cows had greater cholesterol levels from 7 to 28 d after calving, whereas no differences were detected between High-RT Pr and Low-RT Pr (Cluster × Parity × Day, p > .05; Figure ). The interaction Cluster × Parity × Day also affected total protein (Figure ) and FRAP (Figure ). Compared with High-RT Mu (p < .05), Low-RT Mu cows had greater total protein at −21 d from calving, whereas there was no difference between High-RT and Low-RT Pr (p = .51). Regarding FRAP, a greater concentration was observed at −21 d from calving for High-RT Pr compared with Low-RT Pr cows (p < .05), whereas after calving, at 7 d, a difference was observed between High-RT Mu and Low-RT Mu, where High-RT had greater concentration (p < .05).
Figure 8. Effect of Cluster × Parity × Day on plasma cholesterol (A), total protein (B), and FRAP (C) across the transition period (from −21 to 28 d relative to parturition) in Simmental primiparous (High-RT Pr and Low-RT Pr) and multiparous (High-RT Mu and Low-RT Mu) dairy cows categorised by k-means clustering analysis according to rumination time (RT) recorded between 1 and 7 d after calving. Different letters (a–b) indicate significant differences among groups within each time point (p ≤ 0.05).
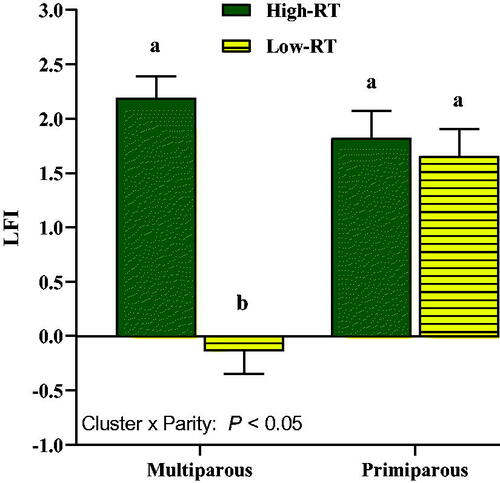
The LFI was affected by Cluster × Parity (p < .05; Figure ), with greater values in the High-RT Mu compared with the Low-RT Mu group (2.19 ± 0.20 vs −0.14 ± 0.21, respectively; p < .05), whereas it did not differ between High-RT Pr and Low-RT Pr (1.82 ± 0.26 vs 1.65 ± 0.25, respectively; p = .64).
Figure 9. Effect of Cluster × Parity on liver functionality index (LFI) calculated with data obtained at 3 and 28 d after calving for albumin, cholesterol, and bilirubin in Simmental primiparous (High-RT Pr and Low-RT Pr) and multiparous (High-RT Mu and Low-RT Mu) dairy cows categorised by k-means clustering analysis according to rumination time (RT) recorded between 1 and 7 d after calving. Different letters (a–b) indicate significant differences among groups (p ≤ 0.05).
Discussion
Monitoring rumination behaviour by visual observation or video recording of loose-housed cattle or in commercial farms is impractical. The greatest challenges of both visual and video observations are the labour intensiveness and time-consuming nature, requiring trained personnel to observe activity of individual cows at a predetermined interval. In the last two decades, various sensors have been developed that accurately estimate jaw movements in dairy cows (Schirmann et al. Citation2009a; Beauchemin Citation2018; Werner et al. Citation2019; Knight Citation2020). Besides the simple measurement of rumination and chewing activity, these sensors are able to record and summarise data using software which in turn process data in order to easily and quickly interpret them in commercial facilities (sounding alarms when abnormal behaviours are recognized) and research settings (Adin et al. Citation2009a; Soriani et al. Citation2012; Kaufman et al. Citation2016; Stangaferro et al. Citation2016).
As it has been widely established, parturition in dairy cattle not only leads to impairment of metabolic status and immune response (Lopreiato et al. Citation2019; Minuti et al., Citation2020), but also to changes in rumination, activity, and lying behaviour in a time frame of 4 − 6 weeks around parturition (Calamari et al. Citation2014; Schirmann et al. Citation2016; Stangaferro et al. Citation2016; Cattaneo et al. Citation2020). The Hr-Tag rumination monitoring system (SCR by Allflex, Netanya, Israel) adopted in the current study was previously described, validated, and used in several studies in both research and commercial farms (Adin et al. Citation2009b; Schirmann et al. Citation2009b; Calamari et al. Citation2014; Kaufman et al. Citation2018b). Unlike previous studies from our group (Soriani et al. Citation2012; Calamari et al. Citation2014), herein, we aimed to propose a novel approach through k-means clustering. Clustering analysis facilitates defining groups objectively based on phenotypic observations. Particularly, the unsupervised clustering method (i.e. k-means) is extensively used for the analysis of large datasets (Huang Citation1998). Several studies in the field of dairy science have applied the k-means method to classify dairy cows according to genetic status and health status based on transcriptome profiles, peak milk yield, milk components, and blood properties (Loor et al. Citation2005b; Savegnago et al. Citation2016; De Koster et al. Citation2019; Grelet et al. Citation2019).
The greater milk production in multiparous cows in the High-RT cluster compared with Low-RT can likely be ascribed to the overall better metabolic conditions of those cows as demonstrated also by the LFI index. Indeed, in the present study, the difference for LFI was not observed in primiparous cows. Moreover, clustering animals in High and Low RT in the first week of lactation highlighted the different milk performance and metabolic adaptation in the early lactation between multiparous and primiparous cows. In our opinion, this outcome seems particularly relevant, indicating that in primiparous cows the association between metabolic biomarkers (and even the LFI index) and rumination behaviour after calving is weak. Likely, this might be explained by the lower milk production in primiparous cows. Primiparous cows produced less milk and there was not any difference in milk yield between RT clusters in these cows. In support of our data, recently the study of Peiter et al. (Citation2021) highlighted the relationship between RT at the onset of lactation and milk production in multiparous cows but not in primiparous. Thus, the lack of differences in LFI values primiparous High-RT cows might be ascribed to this fact. Furthermore, to support the relevance of the LFI index to explain the milk yield response, in the study of Trevisi et al. (Citation2012) multiparous cows grouped as high LFI produced approximately 5 kg on average of milk/d more than low LFI cows in the first month of lactation. Differences in the response of milk yield between cows clustered as High and Low RT were reported previously by Calamari et al. (Citation2014), supporting the differences between High-RT multiparous and Low-RT multiparous cows along with the first 42 d of lactation. In addition, a moderate positive relationship between milk yield and RT in early lactation of high-yielding Holstein dairy cows was also found in other studies (Soriani et al. Citation2012; Liboreiro et al. Citation2015; Stone et al. Citation2017; Kaufman et al. Citation2018b). A noticeable relationship between LFI and health status and performance of dairy cows has been observed previously (Trevisi et al. Citation2010, Citation2012). In those studies, cows with low LFI had an increased frequency of clinical problems, greater loss of body reserves, lower feed intake in the first month of lactation, and lower milk yield. Hence, a certain degree of inflammation around parturition (e.g. low LFI) is associated with worsening of health status (clinical or subclinical problems) and may cause a deviation from the normal feeding behaviour such as reduction of feed intake and less time spent ruminating. In the study of Calamari et al. (Citation2014), LFI was highly related to RT in the first week of lactation (r = 0.75), highlighting its utility for early detection of cows at a high risk of developing diseases. Liboreiro et al. (Citation2015) observed a decrease in RT during the first week after calving in cows that developed diseases such as subclinical ketosis, retained placenta, metritis, and hypocalcaemia. It is noteworthy to remark that only multiparous cows had a difference of LFI between those clustered as High- and Low-RT. This suggested that a faster increase of RT after calving was related to a smooth transition from dry to the onset of lactation (greater energy demands for milk production). We are aware that DMI is a key driver of the metabolic adaptation and milk performance after parturition, and the positive association between milk yield and RT could be indirectly related to DMI (Beauchemin Citation2018). Despite the lack of association between DMI and RT reported in previous similar studied (Schirmann et al. Citation2012; Clément et al. Citation2014), the absence of DMI data might have been a limitation in the present study. However, monitoring DMI in commercial dairy farms is unfeasible and the possibility of identifying metabolically stressed cows based only on easily available data such as RT might be useful.
The greater milk fat percentage at 7 d after calving in Low-RT compared with High-RT cows was in accordance with greater blood NEFA in Low-RT than High-RT cows. According to Kaufman et al. (Citation2018b), a negative relationship between milk fat percentage and RT in early lactation can occur regardless of the health status of cows (in particular subclinical ketosis).
The typical metabolic adaptation in early lactation is characterised by lower glucose levels together with elevated concentrations of NEFA and BHB (Drackley Citation1999; Minuti et al. Citation2020). Excessive amounts of blood NEFA, released during adipose depots lipolysis, are transferred to milk in the form of long-chain FA such as C16:0, C18:0, and C18:1 cis-9 (Hostens et al. Citation2012; Jorjong et al. Citation2014). In addition, considering multiparous cows only, milk BHB followed the trend of blood BHB where Low-RT multiparous compared with High-RT multiparous cows had greater milk BHB at 7 and 15 d after calving. On this basis, Low-RT cows likely developed a deeper NEB associated with the slower increase of RT after calving.
As pointed out above, blood BHB and NEFA biomarkers provide relevant information on energy balance and the rate of adipose depot lipolysis. It is plausible that High-RT cows underwent to a less lipolysis degree of adipose depots leading to a reduced release of BHB, but we cannot exclude also that High-RT cows were able to metabolise circulating NEFA more efficiently in the liver with their complete oxidation. Fructosamine has recently been used as a biomarker to help evaluate the degree of NEB or undernutrition in dairy cows (Roche et al. Citation2013a; Caré et al. Citation2018b). Its concentrations were previously reported to reflect plasma albumin concentrations (Roche et al. Citation2013b), consistent with our results where both fructosamine and albumin concentrations displayed similar trends. On this basis and taking together BHB, NEFA, and fructosamine, cows with a slower increase of RT in the first week after calving are likely in a deeper state of NEB (Calamari et al. Citation2014; Mammi et al. Citation2021). In addition, this condition was greatly exacerbated in multiparous cows, where High-RT had lower levels of BHB than Low-RT overall, despite their greater milk yield. The latter together with the LFI outcome, agree closely with results of Trevisi et al. (Citation2013) where cows with high liver activity index produced more milk and had lower postpartum BHB levels compared with cows ranked in the low liver activity index group.
Concerning biomarkers of liver functionality in combination with those that reflect systemic inflammation, the greater plasma concentration of albumin and lower haptoglobin in High-RT cows was suggestive of less pronounced inflammatory status around parturition. Indeed, haptoglobin has been used as a marker of systemic inflammation in transition dairy cows increasing during the immediate postpartum period (Bertoni et al. Citation2008a; Huzzey et al. Citation2009). Even though a rapid and marked increase was evident in both High-RT and Low-RT cows immediately after calving, High-RT displayed a greater drop of haptoglobin within a week of lactation and reached values below 0.2 g/L compared with Low-RT, a threshold considered acceptable to indicate a lack of an inflammatory response (Bertoni et al. Citation2008a). These results are consistent with those of Calamari et al. (Citation2014), underscoring a close link between the RT and the trend of metabolic-related biomarkers after calving. In fact, a quicker increase of RT is associated with a greater response of the liver to maintain and/or increase quicker the production of negative acute-phase proteins (such as albumin) and to reduce the production of positive acute-phase proteins (such as haptoglobin) as a consequence of the inflammatory response resolution in a shorter timeframe after parturition. Therefore, the fact that even retinol was greater at 3 and 14 d after calving in High-RT cows compared with Low-RT cows supports the latter association. Retinol reflects the synthesis of the retinol-binding protein in the liver and is classified as a negative acute-phase protein (Berry and Noy Citation2012).
The greater plasma tocopherol in High-RT compared with Low-RT cows for the entire postpartum period was indicative of an improved lipid and lipoprotein metabolism in the liver. Tocopherol is preferentially incorporated into nascent VLDL in dairy cows (Mudron et al. Citation1997) and other animals (Dutta-Roy et al. Citation1994). We speculate that the increased plasma tocopherol levels in High-RT cows might have been due to the promotion of VLDL formation, supported also by the faster increase in cholesterol concentration after parturition especially in multiparous cows. In addition, differences in cholesterol only in multiparous but not primiparous cows between High- and Low-RT was indicative of a positive association between greater time spent ruminating in the first week after calving and better liver function only in multiparous cows. Loor et al. (Citation2007) reported that feed restriction and ketosis early postpartum are associated with downregulation of hepatic molecular pathways controlling cholesterol synthesis and fatty acid desaturation. Furthermore, the authors pointed out that lower de novo synthesis of cholesterol might be the limiting component of VLDL synthesis, which in turn are exported from liver to bloodstream facilitating the export of NEFA (esterified to triacylglycerols) during NEB (Drackley Citation1999).
Inflammatory events occurring in cows during early lactation are associated with physiologically stressful conditions and metabolic overload on the liver to meet nutrient requirements for maintenance and milk synthesis (Trevisi and Minuti Citation2018). Oxidative stress, due to an imbalance of antioxidants in presence of phenomena that increase the production of potent pro-oxidant molecules, can then contribute to dysregulated inflammatory responses and dyslipidaemia (Bernabucci et al. Citation2005; Sordillo and Aitken Citation2009). Determination of FRAP concentrations provides basic information on the antioxidant status of animals. Total FRAP contributes to individual plasma antioxidants (uric acid, ascorbic acid, vitamin E, bilirubin, albumin, and others). Plasma concentrations of these antioxidants depend on both dietary intake and the synthetic capacity of specific organs, in particular the liver (Benzie and Strain Citation1996). In agreement with earlier studies (Benzie and Strain 1996; Trevisi et al. Citation2011), the greater concentration of FRAP together with greater concentration of tocopherol would be positively associated with improved antioxidant activity. These data reinforce the conclusion that cows experiencing a quicker increase of RT, indicative of better adaptation to the onset of lactation, are prone to a less pronounced oxidant state, especially in multiparous cows. Monitoring RT in the first days of lactation might help farmers identifying cows in worse metabolic condition, without more time-consuming investigations, such as blood sampling. Cows in overall good shape in this critical phase usually have better productive and reproductive performance and have a reduced culling risk (Bionaz et al. Citation2007; Bertoni et al. Citation2008b). It was interesting to obtain that the time it took to reach a more stable RT in the early postpartum period was not associated with milk production and the immunometabolic condition for primiparous cows, likely due to the lower milk production level that characterised primiparous compared with multiparous cows in the present study.
Conclusion
Our data provide valuable information about the rumination behaviour as a proxy to evaluate the metabolic footprint of periparturient Simmental dairy cows. The unsupervised ML k-means approach applied to RT data for the first week of lactation was able to group cows with a different increase rate of RT after calving, which in turn contributed to identifying different metabolic states associated with plasma biomarkers of energy metabolism, inflammatory response, and liver functionality, along with production outcomes. Thus, our results support the use of RT as a physiological state indicator in early postpartal cows. At the farm level, the addition of these outcomes as a specific algorithm in the actual sensors and software to process data can provide information to farmers that can be helpful in management decisions for cow health, complementing traditional methods for monitoring early lactation dairy cows.
Ethical approval
The trial was carried out in accordance with Italian laws on animal experimentation (DL n. 26, 04/03/2014) and received an institutional approval from the Ethical Animal Care and Use Committee of the Magna Graecia University of Catanzaro (Protocol No. 302-5/5/2017).
Supplemental Material
Download MS Word (121.4 KB)Acknowledgments
This project was supported by “Romeo ed Enrica Invernizzi foundation” (Milan, Italy). The authors thanks Annarita Ferrari and Giorgia Lovotti (DIANA, Università Cattolica del Sacro Cuore, Piacenza, Italy) for the technical assistance in the blood assessment. Thanks to Fattoria Demetra for providing animals and the Hr-Tag rumination monitoring system. A special thanks to Fortunato Lopreiato for his daily assistance with animals.
Disclosure statement
The authors declare that they have no conflicts of interest. The animal husbandry practices of the farms simulated were approved by Italian veterinarians.
Data availability statement
Data available on request from the authors.
Additional information
Funding
References
- Adamczyk K, Cywicka D, Herbut P, Trześniowska E. 2017. The application of cluster analysis methods in assessment of daily physical activity of dairy cows milked in the Voluntary Milking System. Comput Electron Agric. 141:65–72.
- Adin G, Solomon R, Nikbachat M, Zenou A, Yosef E, Brosh A, Shabtay A, Mabjeesh SJJ, Halachmi I, Miron J. 2009a. Effect of feeding cows in early lactation with diets differing in roughage-neutral detergent fiber content on intake behavior, rumination, and milk production. J Dairy Sci. 92(7):3364–3373.
- Adin G, Solomon R, Nikbachat M, Zenou A, Yosef E, Brosh A, Shabtay A, Mabjeesh SJJ, Halachmi I, Miron J. 2009b. Effect of feeding cows in early lactation with diets differing in roughage-neutral detergent fiber content on intake behavior, rumination, and milk production. J Dairy Sci. 92(7):3364–3373.
- Beauchemin KA. 1991. Ingestion and mastication of feed by dairy cattle. The veterinary clinics of North America. Vet Clin North Am Food Anim Pract. 7(2):439–463.
- Beauchemin KA. 2018. Invited review: current perspectives on eating and rumination activity in dairy cows. J Dairy Sci. 101(6):4762–4784.
- Benzie IFF, Strain JJ. 1996. The ferric reducing ability of plasma (FRAP) as a measure of “antioxidant power”: the FRAP assay. Anal Biochem. 239(1):70–76.
- Bernabucci U, Ronchi B, Lacetera N, Nardone A. 2005. Influence of body condition score on relationships between metabolic status and oxidative stress in periparturient dairy cows. J Dairy Sci. 88(6):2017–2026.
- Berry DC, Noy N. 2012. Signaling by vitamin A and retinol-binding protein in regulation of insulin responses and lipid homeostasis. Biochim Biophys Acta. 1821(1):168–176.
- Bertoni G, Trevisi E, Han X, Bionaz M. 2008a. Effects of inflammatory conditions on liver activity in puerperium period and consequences for performance in dairy cows. J Dairy Sci. 91(9):3300–3310.
- Bertoni G, Trevisi E, Han X, Bionaz M. 2008b. Effects of inflammatory conditions on liver activity in puerperium period and consequences for performance in dairy cows. J Dairy Sci. 91(9):3300–3310.
- Bionaz M, Trevisi E, Calamari L, Librandi F, Ferrari a, Bertoni G. 2007. Plasma paraoxonase, health, inflammatory conditions, and liver function in transition dairy cows. J Dairy Sci. 90(4):1740–1750.
- Brotzman RL, Döpfer D, Foy MR, Hess JP, Nordlund KV, Bennett TB, Cook NB. 2015. Survey of facility and management characteristics of large, Upper Midwest dairy herds clustered by Dairy Herd Improvement records. J Dairy Sci. 98(11):8245–8261.
- Calamari L, Soriani N, Panella G, Petrera F, Minuti A, Trevisi E. 2014. Rumination time around calving: an early signal to detect cows at greater risk of disease. J Dairy Sci. 97(6):3635–3647.
- Caré S, Trevisi E, Minuti A, Ferrari A, Loor JJ, Calamari L. 2018a. Plasma fructosamine during the transition period and its relationship with energy metabolism and inflammation biomarkers in dairy cows. Livestock Sci. 216:138–147.
- Caré S, Trevisi E, Minuti A, Ferrari A, Loor JJ, Calamari L. 2018b. Plasma fructosamine during the transition period and its relationship with energy metabolism and inflammation biomarkers in dairy cows. Livestock Sci. 216:138–147.
- Cattaneo L, Lopreiato V, Trevisi E, Minuti A. 2020. Association of postpartum uterine diseases with lying time and metabolic profiles of multiparous Holstein dairy cows in the transition period. Vet J. 263:105533.
- Clément P, Guatteo R, Delaby L, Rouillé B, Chanvallon A, Philipot JM, Bareille N. 2014. Short communication: added value of rumination time for the prediction of dry matter intake in lactating dairy cows. J Dairy Sci. 97(10):6531–6535.
- De Koster J, Salavati M, Grelet C, Crowe MA, Matthews E, O'Flaherty R, Opsomer G, Foldager L, Hostens M. 2019. Prediction of metabolic clusters in early-lactation dairy cows using models based on milk biomarkers. J Dairy Sci. 102(3):2631–2644.
- Drackley JK. 1999. Biology of dairy cows during the transition period: the final frontier? J Dairy Sci. 82(11):2259–2273.
- Dutta-Roy AK, Gordon MJ, Campbell FM, Duthie GG, James WPT. 1994. Vitamin E requirements, transport, and metabolism: role of α-tocopherol-binding proteins. J Nutr Biochem. 5(12):562–570.
- Ferré N, Camps J, Prats E, Vilella E, Paul A, Figuera L, Joven J. 2002. Serum paraoxonase activity: a new additional test for the improved evaluation of chronic liver damage. Clin Chem. 48(2):261–268.
- Ghaffari MH, Jahanbekam A, Sadri H, Schuh K, Dusel G, Prehn C, Adamski J, Koch C, Sauerwein H. 2019. Metabolomics meets machine learning: longitudinal metabolite profiling in serum of normal versus overconditioned cows and pathway analysis. J Dairy Sci. 102(12):11561–11585.
- Grelet C, Vanlierde A, Hostens M, Foldager L, Salavati M, Ingvartsen KL, Crowe M, Sorensen MT, Froidmont E, Ferris CP, et al. 2019. Potential of milk mid-IR spectra to predict metabolic status of cows through blood components and an innovative clustering approach. Animal. 13(3):649–658.
- Hanasand M, Omdal R, Norheim KB, Gøransson LG, Brede C, Jonsson G. 2012. Improved detection of advanced oxidation protein products in plasma. Clin Chim Acta. 413(9–10):901–906.
- Herskin M, Munksgaard L, Ladewig J. 2004. Effects of acute stressors on nociception, adrenocortical responses and behavior of dairy cows. Physiol Behav. 83(3):411–420.
- Hostens M, Fievez V, Leroy JLMR, Van Ranst J, Vlaeminck B, Opsomer G. 2012. The fatty acid profile of subcutaneous and abdominal fat in dairy cows with left displacement of the abomasum. J Dairy Sci. 95(7):3756–3765.
- Huang Z. 1998. Extensions to the k-means algorithm for clustering large data sets with categorical values. Data Mining Knowledge Discov. 2(3):283–304.
- Huzzey JM, Duffield TF, LeBlanc SJ, Veira DM, Weary DM, von Keyserlingk MAG. 2009. Short communication: haptoglobin as an early indicator of metritis. J Dairy Sci. 92(2):621–625.
- Ingraham RH, Stanley RW, Wagner WC. 1979. Seasonal effects of tropical climate on shaded and nonshaded cows as measured by rectal temperature, adrenal cortex hormones, thyroid hormone, and milk production. Am J Vet Res. 40(12):1792–1797.
- Jorjong S, van Knegsel ATM, Verwaeren J, Lahoz MV, Bruckmaier RM, De Baets B, Kemp B, Fievez V. 2014. Milk fatty acids as possible biomarkers to early diagnose elevated concentrations of blood plasma nonesterified fatty acids in dairy cows. J Dairy Sci. 97(11):7054–7064.
- Kaufman EI, LeBlanc SJ, McBride BW, Duffield TF, DeVries TJ. 2016. Association of rumination time with subclinical ketosis in transition dairy cows. J Dairy Sci. 99(7):5604–5618.
- Kaufman EI, Asselstine VH, LeBlanc SJ, Duffield TF, DeVries TJ. 2018a. Association of rumination time and health status with milk yield and composition in early-lactation dairy cows. J Dairy Sci. 101(1):462–471.
- Kaufman EI, Asselstine VH, LeBlanc SJ, Duffield TF, DeVries TJ. 2018b. Association of rumination time and health status with milk yield and composition in early-lactation dairy cows. J Dairy Sci. 101(1):462–471.
- Knight CH. 2020. Review: sensor techniques in ruminants: more than fitness trackers. Animal. 14(S1):s187–s195.
- Liboreiro DN, Machado KS, Silva PRB, Maturana MM, Nishimura TK, Brandão AP, Endres MI, Chebel RC. 2015. Characterization of peripartum rumination and activity of cows diagnosed with metabolic and uterine diseases. J Dairy Sci. 98(10):6812–6827.
- Loor JJ, Dann HM, Everts RE, Oliveira R, Green CA, Janovick Guretzky NA, Rodriguez-Zas SL, Lewin HA, Drackley JK. 2005a. Temporal gene expression profiling of liver from periparturient dairy cows reveals complex adaptive mechanisms in hepatic function. Physiol Genomics. 23(2):217–226.
- Loor JJ, Dann HM, Everts RE, Oliveira R, Green CA, Janovick Guretzky NA, Rodriguez-Zas SL, Lewin HA, Drackley JK. 2005b. Temporal gene expression profiling of liver from periparturient dairy cows reveals complex adaptive mechanisms in hepatic function. Physiol Genomics. 23(2):217–226.
- Loor JJ, Everts RE, Bionaz M, Dann HM, Morin DE, Oliveira R, Rodriguez-Zas SL, Drackley JK, Lewin HA. 2007. Nutrition-induced ketosis alters metabolic and signaling gene networks in liver of periparturient dairy cows. Physiol Genomics. 32(1):105–116.
- Lopreiato V, Minuti A, Trimboli F, Britti D, Morittu VM, Cappelli FP, Loor JJ, Trevisi E. 2019. Immunometabolic status and productive performance differences between periparturient Simmental and Holstein dairy cows in response to pegbovigrastim. J Dairy Sci. 102(10):9312–9327.
- Lopreiato V, Minuti A, Cappelli FP, Vailati-Riboni M, Britti D, Trevisi E, Morittu VM. 2018. Daily rumination pattern recorded by an automatic rumination-monitoring system in pre-weaned calves fed whole bulk milk and ad libitum calf starter. Livestock Sci. 212:127–130.
- Lopreiato V, Vailati-Riboni M, Morittu VM, Britti D, Piccioli-Cappelli F, Trevisi E, Minuti A. 2020. Post-weaning rumen fermentation of Simmental calves in response to weaning age and relationship with rumination time measured by the Hr-Tag rumination-monitoring system. Livestock Sci. 232:103918.
- Mammi LME, Cavallini D, Fustini M, Fusaro I, Giammarco M, Formigoni A, Palmonari A. 2021. Calving difficulty influences rumination time and inflammatory profile in Holstein dairy cows. J Dairy Sci. 104(1):750–761.
- McArt JAA, Nydam DV, Oetzel GR. 2012. Epidemiology of subclinical ketosis in early lactation dairy cattle. J Dairy Sci. 95(9):5056–5066.
- Minuti A, Jahan N, Lopreiato V, Piccioli-Cappelli F, Bomba L, Capomaccio S, Loor JJ, Ajmone-Marsan P, Trevisi E. 2020. Evaluation of circulating leukocyte transcriptome and its relationship with immune function and blood markers in dairy cows during the transition period. Funct Integr Genomics. 20(2):293–305.
- Mudron P, Rehage J, Sallmann HP, Mertens M, Scholz H, Kovac G. 1997. Plasma and liver α-tocopherol in dairy cows with left abomasal displacement and fatty liver. J Vet Med A: Physiol Pathol Clin Med. 44(1–10):91–97.
- Peiter M, Phillips HN, Endres MI. 2021. Association between early postpartum rumination time and peak milk yield in dairy cows. J Dairy Sci. 104(5):5898–5908.
- Roche JR, Macdonald KA, Schütz KE, Matthews LR, Verkerk GA, Meier S, Loor JJ, Rogers AR, McGowan J, Morgan SR, et al. 2013a. Calving body condition score affects indicators of health in grazing dairy cows. J Dairy Sci. 96(9):5811–5825.
- Roche JR, Macdonald KA, Schütz KE, Matthews LR, Verkerk GA, Meier S, Loor JJ, Rogers AR, McGowan J, Morgan SR, et al. 2013b. Calving body condition score affects indicators of health in grazing dairy cows. J Dairy Sci. 96(9):5811–5825.
- Savegnago RP, do Nascimento GB, de G, Rosa JM, de Carneiro RLR, Sesana RC, Faro LE, Munari DP. 2016. Cluster analyses to explore the genetic curve pattern for milk yield of Holstein. Livestock Sci. 183:28–32.
- Schirmann K, Weary DM, Heuwieser W, Chapinal N, Cerri RLA, von Keyserlingk MAG. 2016. Short communication: rumination and feeding behaviors differ between healthy and sick dairy cows during the transition period. J Dairy Sci. 99(12):9917–9924.
- Schirmann K, von Keyserlingk M. a G, Weary DM, Veira DM, Heuwieser W. 2009a. Technical note: validation of a system for monitoring rumination in dairy cows. J Dairy Sci. 92(12):6052–6055.
- Schirmann K, von Keyserlingk M. a G, Weary DM, Veira DM, Heuwieser W. 2009b. Technical note: validation of a system for monitoring rumination in dairy cows. J Dairy Sci. 92(12):6052–6055.
- Schirmann K, Chapinal N, Weary DM, Heuwieser W, von Keyserlingk MAG. 2012. Rumination and its relationship to feeding and lying behavior in Holstein dairy cows. J Dairy Sci. 95(6):3212–3217.
- Sordillo LM, Aitken SL. 2009. Impact of oxidative stress on the health and immune function of dairy cattle. Vet Immunol Immunopathol. 128(1-3):104–109.
- Soriani N, Trevisi E, Calamari L. 2012. Relationships between rumination time, metabolic conditions, and health status in dairy cows during the transition period. J Anim Sci. 90(12):4544–4554.
- Soriani N, Panella G, Calamari L. 2013. Rumination time during the summer season and its relationships with metabolic conditions and milk production. J Dairy Sci. 96(8):5082–5094.
- Stangaferro ML, Wijma R, Caixeta LS, Al-Abri MA, Giordano JO. 2016. Use of rumination and activity monitoring for the identification of dairy cows with health disorders: part III. Metritis. J Dairy Sci. 99(9):7422–7433.
- Stone AE, Jones BW, Becker CA, Bewley JM. 2017. Influence of breed, milk yield, and temperature-humidity index on dairy cow lying time, neck activity, reticulorumen temperature, and rumination behavior. J Dairy Sci. 100(3):2395–2403.
- Trevisi E, Minuti A. 2018. Assessment of the innate immune response in the periparturient cow. Res Vet Sci. 116:47–54.
- Trevisi E, Zecconi A, Bertoni G, Piccinini R. 2010. Blood and milk immune and inflammatory profiles in periparturient dairy cows showing a different liver activity index. J Dairy Res. 77(3):310–317.
- Trevisi E, Bertoni G, Lombardelli R, Minuti A. 2013. Relation of inflammation and liver function with the plasma cortisol response to adrenocorticotropin in early lactating dairy cows. J Dairy Sci. 96(9):5712–5722.
- Trevisi E, Amadori M, Archetti I, Lacetera N, Bertoni G. 2011.Inflammatory response and acute phase proteins in the transition period of high-yielding dairy cows. Acute Phase Proteins as Early Non-Specific Biomarkers of Human and Veterinary Diseases. In F. Veas, editor. InTech open.
- Trevisi E, Amadori M, Cogrossi S, Razzuoli E, Bertoni G. 2012. Metabolic stress and inflammatory response in high-yielding, periparturient dairy cows. Res Vet Sci. 93(2):695–704.
- Walsh RB, Walton JS, Kelton DF, LeBlanc SJ, Leslie KE, Duffield TF. 2007. The effect of subclinical ketosis in early lactation on reproductive performance of postpartum dairy cows. J Dairy Sci. 90(6):2788–2796.
- Werner J, Umstatter C, Leso L, Kennedy E, Geoghegan A, Shalloo L, Schick M, O'Brien B. 2019. Evaluation and application potential of an accelerometer-based collar device for measuring grazing behavior of dairy cows. Animal. 13(9):2070–2079.
- White RR, Hall MB, Firkins JL, Kononoff PJ. 2017. Physically adjusted neutral detergent fiber system for lactating dairy cow rations. I: deriving equations that identify factors that influence effectiveness of fiber. J Dairy Sci. 100(12):9551–9568.