
Abstract
Movements of livestock across the Member States is monitored using the Trade Control and Expert System (TRACES), a web-based veterinarian certification tool. This study aimed to evaluate the criticalities of this tracing system and the most frequent non-conformities in their compilation. TRACES of cattle (n = 320) departed from France and arriving or transiting across Puglia (Italy) in 2019 (n = 199) and 2020 (n = 121) were analysed. The distribution arriving in Italy and Greece did not vary between the 2 years. The majority of the bovine (53.4%) were medium-sized cattle transported for fattening with a median body weight of 410 kg. However, almost half of the TRACES did not report correctly the total expected loaded weight or the available space, so for them, it was impossible to calculate and double-check whether the minimal space allowance was respected. Long journeys must include a resting stop after the first 14 h, however, 20.9% of the examined and declared stops did not comply with it. Finally, comparing the expected declared journey duration with a calculated one (dividing travel distance by an average speed of 70 km/h, adding 1 h for loading and unloading, and 1 h or 24 h for resting stops), we found that only 30.6% of the journey durations were congruent. The irregularities resulted associated with consignors and transporters (p < .05). Overall, the proportion of mistakes and non-compliance suggest that there is a need to improve the current practice to enhance animal welfare during transportation.
TRACES (n = 320) of cattle transported from France in 2019 and 2022 were analysed.
Almost half of the TRACES were not filled correctly.
TRACES should be implemented and double-checked carefully to ensure animal welfare.
HIGHLIGHTS
Introduction
Millions of animals are transported daily all over the world. However, transportation may be stressful for animals and it is a welfare concern (Broom Citation2008; Padalino et al. Citation2021). Weight loss, traumatic lesions or (in extreme cases) death can indeed be a consequence of inadequate management concerning transport (Knowles et al. Citation1993, Citation1994). Loading methods, stocking density, journey duration, driving skills, and road conditions have been identified as risk factors for poor animal welfare (EFSA Citation2011; Miranda-de la Lama et al. Citation2014; Schwartzkopf-Genswein et al. Citation2016). To limit risk, specific laws and codes aiming at safeguarding the welfare of the travelling animals regulate live animal movements worldwide.
The European Council Regulation (EC) No. 1/2005 regulates animal transportation with different requirement depending on journey length (less or more than 8 h) and transported species (minimum loading density, maximum journey duration) (Council of the European Union Citation2005). Each species has indeed different physiological requirements and needs according to transport conditions, means of transport used, and climatic zones (Marahrens et al. Citation2011; Schwartzkopf-Genswein et al. Citation2016). For cattle, the maximum journey duration in compliance with the EC1/2005 is 29 h. However, always according to the law, those 29 h cannot be continued, and stops for resting and watering the animals must be scheduled. Consequently, after 14 h of travel, there is a compulsory stop of at least 1 hour for watering and feeding, and a possible continuation of another 14 h of travel. If the expected journey duration exceeds 29 h, cattle must be unloaded and rest for at least 24 h in an approved control post and then loaded again towards the final destination (Council of the European Union Citation2005). Loading cattle onto the truck is a stressful event in itself, causing an increase in heart rate, nervousness and agitation, and it can take time (Chacon et al. Citation2005). Thus, the expected journey duration always includes the time of loading and unloading, since a journey starts when the first animal is loaded and finishes when the last animal leaves the vehicle (EFSA Citation2004).
Council Regulation (EC) no. 1/2005 regulates in Annexe 1 the loading density for the different animal species and categories transported. For bovine, depending on the weight categories, the following different minimal space allowance is envisaged, ranging from an area 0.30 and 0.40 square metre (m2) for small calves (approximate body weight of 50 kg) to an area greater than 1.60 m2 for very heavy cattle (body weight more than 700 kg). The legislation also specifies that minimum space allowance may vary based not only on weight and size but also on the physical state of the animals, weather conditions, and the probable duration of the journey. The law also suggests that animals should travel in homogeneous groups in terms of age, sex, and size; mixing adults with young and large specimens with small ones can cause crushing (EFSA Citation2004; Council of the European Union Citation2005) and an increase in fighting and mounts between them (Calderòn et al. Citation2020). The presence of horned cattle in the transported group increases the incidence of superficial and deep lesions, so mixing horned and unhorned animals is forbidden if not raised in compatible groups and accustomed to each other (i.e. loaded in different origin places) (Council of the European Union Citation2005).
The movement of livestock across the borders of the Member States of the European Union is monitored using the Trade Control and Expert System (TRACES) and reported in the Activity Report (European Parliament Citation2018; European Commission Citation2019). TRACES have to be filled in before moving the animals and Official Veterinarians have to double-check them and decide whether to approve or not the proposed journey considering whether the latter is compliant with the current regulation. The TRACES is composed of three main parts. The first part reports the details of dispatched consignment, such as Consignor’s and Consignee’s names and addresses, certificate reference number and central competent Authority, country of origin and destination, and the details of dispatched consignment, such as transporter’s details, date and time of departure and estimated journey time and the identification of the transported animals. The second part, named certification, is dedicated to all health information (e.g. information about the animals come from holding/s of origin and area/s which, in conformity with Union or national legislation, is/are not subject to any prohibition or restriction for reasons of animal diseases affecting bovine animals; inspection of animals and control of communicable diseases). The third part is named planning, which summaries the travel plan, including estimated total weight, total space and list of foreseen resting, transfer and exit points destination with their duration. Thanks to the TRACES system, all movements can be monitored. For instance, in 2018, Italy imported a total number of live bovine of 1,075,895 from all countries of the world and of these 1,050,319 from Europe, mainly from France (Dahl-Pedersen and Herskin Citation2021; ISTAT Citation2021).
A recently published study showed that vehicles transporting cattle from France to Italy were often fined during road inspection (Padalino et al. Citation2020). Consequently, this study hypothesised that TRACES would often be not filled in all their parts and that many planned journeys were approved even if not in compliance with the requirements related to journey duration and minimum space allowance reported in the Reg EC 1/2005. This study aimed to analyse retrospectively the TRACES approved for the transportations of cattle from France towards Bari Province or crossing it towards Greece in 2019 and 2020. Precisely, the health certificates and planning notified in the TRACES system were examined, aiming at documenting whether article 14 of Regulation EC No. 1/2005 was fulfilled and whether the TRACES were correctly filled in and reported correct information concerning journey time and animal density.
Materials and methods
The TRACES from the 1 January 2019 to the 31 December 2020 originated in France and arriving in the province of Bari or crossing it to continue towards Greece were downloaded by one of the authors (DT) from the official platform of the site https://webgate.ec.europa.eu/sanco/traces/ with the permission of the Italian Health Minister.
Data were entered in Excel following the different parts of the TRACES. Namely, the following sections were reported: consignor name; consignee name; certificate reference number; central competent authority; country of origin; country of destination; place of loading; place of destination; date and time of departure; identification of means of transport; transporter; number/quantity; animal certified for/products certified for; estimated journey time; route plan; date and time of destination and list of foreseen resting, transfer or exit point and length in hours. Other sections present in the TRACES (i.e. Health vaccinations) were considered of poor interest and not inserted in the excel.
Data curation and statistical analysis
First, data reported in each TRACES were analysed to identify missing or implausible data and compliance with regulations. Criteria for data classification are summarised in Table .
Table 1. Parameters taken from each TRACES and criteria to define their compliance with the regulation and data plausibility.
All records with blank fields were treated as ‘missing data’. The number of animals and the estimated total weight of the consignment were considered as ‘not plausible’ if the mean animal body weight (BW, calculated as the ratio between total weight and number of animals) was less than 110 kg or higher than 900 kg. The estimated mean BW was also used to categorise the animals which were transported in each consignment according to the weight categories adopted by Regulation 1/2005. In particular, the following BW categories were used: small calves <110 kg; medium size calves ≥110 kg and <200 kg; heavy calves ≥200 kg and <325 kg; medium size cattle ≥325 kg and <550 kg; heavy cattle ≥550 kg and <700 kg; very heavy cattle ≥700 kg. Some TRACES reported typos for total space values. We decided, therefore, to consider all values of total space > 200 m2 as ‘not plausible’, since a vehicle (Truck plus trailer) used for transporting cattle on two levels (each level about 34 m2) can have maximum dimensions of about 130 m2, and the typos found were all above 200. Estimated loading density was calculated as the ratio between the total space (valid numbers) and the number of animals. Then, the estimated loading density of each TRACES was compared with that regulated by Regulation 1/2005 according to the weight categories of animals, thus creating a new binary variable (yes/no) which defines the regulatory compliance (Table ).
Theoretical duration of the journey (in hours) was calculated for each TRACES by dividing travel distance by an average speed of 70 km/h (suggested for live animal vehicles), and by adding 1 h for loading and unloading, and 1 h or 24 h for compulsory stops if the journey was longer than 14 or 29 h, respectively (Council of the European Union Citation2005). Furthermore, 8 h were added at a flat rate when the transport was headed to Greece (the ferry journey takes about 6 h plus loading and unloading). Journey time reported in the TRACES was treated as ‘not plausible’ if it was shorter than the theoretical duration, and the difference (in hours) between declared and theoretical duration was calculated. A variable defining the concordance between the number of declared and compulsory stops (according to Regulation 1/2005) was also created. All variables defining the ‘compliance with regulations’ and ‘data plausibility’ were coded as zero–one (no–yes).
Finally, the categories of some variables were reorganised and relabelled to simplify data presentation and statistical analysis as well as to ensure privacy. In particular, consignors and transporters involved in less than 20 journeys were included in categories called ‘Small consignors’ and ‘Small transporters’, respectively, while the others were identified with a letter (e.g. Consignor A, Consignor B; Consignor C; Transporter A, Transporter B).
Descriptive statistics were used to present both raw data and new variables as mean and standard deviation (SD), median (Mdn) and range (minimum and maximum) or interquartile range (IQR), number, and percentage. Chi-square goodness of fit test was used to analyse the distribution of the categories within each variable (assuming all categories equal). Univariable binary logistic regression was used to assess whether there was an association between non-compliance or implausibility (included as dependent variables) and consignor or transporters (included as predictors). Results were reported as odds ratio (OR), 95% confidence interval (95%CI), and the p-value of Wald statistic. An Independent t-test assuming unequal variance was used to compare the mean number of animals per TRACES during 2019 and 2020. All analyses were performed using SPSS version 25.0 statistical analysis software (IBM Inc., Chicago, IL) and a p-value < .05 was considered statistically significant.
Results
A total of 320 TRACES were analysed, of which 199 (62.2%) were related to 2019 and 121 (37.8%) to 2020, including a total of 9629 animals (n = 5874 and n = 3755 for the year 2019 and 2020, respectively; Figure ). The distribution between Greece and Italy did not differ between the 2 years for the number of TRACES (OR = 0.693, 95%CI = 0.364–1.316; p = .262; Figure ) and the total number of animals (OR = 1.026, 95%CI = 0.878–1.198; p = .750; Figure ).
Figure 1. Frequency distribution of TRACES and the total number of animals in 2019 and 2020.
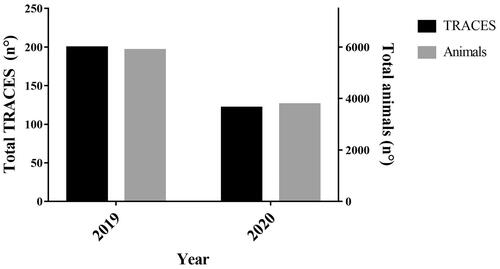
Figure 2. Relative frequency distribution of TRACES (panel a) and the total number of animals (panel b) during 2019 and 2020 according to the country of destination. The differences were not significant.
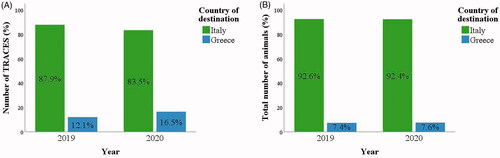
Table shows descriptive statistics and results of the goodness of fit test for some generic information reported in Part I. In most of the TRACES, the means of transport was the ‘Road vehicle’ (96.3%; p < .001), and animals were certified for ‘Production’ (89.4%; p < .001). The place of origin and destination were always ‘Assembly Centre’ and ‘Holding’ (100.0%; p < .001), respectively, while the section on temperature was never completed (missing data = 100%). Overall, the number of sections not filled in ranged from 4 to 8 (mean ± SD = 6 ± 1 sections), and over half of the TRACES had more than 5 uncompiled sections.
Table 2. Descriptive statistics and results of the goodness of fit test for some generic information reported in Part I.
Table reports data related to the loading density. The number of animals recorded in each TRACES ranged from 1 to 72, and there was no difference in the mean number between 2019 and 2020 (29.5 ± 17.2 and 31.0 ± 19.9 animals/TRACES during 2019 and 2020, respectively; p = .488). The total space ranged between 3 (in case of single animal) and 73 m2 while the total weight of the consignment from 400 to 26,049 kg. Mean BW and loading density calculated based on these data were 410 kg and 1.78 m2/animal, respectively. Then, animals were classified into weight categories as showed in Table and most of them fell into the ‘medium-sized’ class (n = 171, 53.4%; p < .001). However, animals were classified only in 190 out of 320 traces as more than 40% showed missing or unplausible data (Table ) making it impossible to estimate the mean body weight and, then, the weight categories. Missing or unplausible data were, moreover, found for the total space in 125 TRACES (39.1%; Table ). Overall, 139 TRACES (43.4%) showed at least one error so that regulatory compliance for minimum space could be defined only for 181 of them. Among these, only one irregularity (0.6%) was found. This non-compliance concerned a TRACES (ID247) transporting very heavy cattle (minimum space allowance required by Regulation no. 1/2005 = 1.6 m2/animal) for which an estimated density of 1.4 m2/animal was found (Table ).
Table 3. Descriptive statistics of parameters related to loading density as reported on the TRACES’ planning or computed ‘a posteriori’.
Table 4. Classification of animals in weight categories (as computed by dividing the total weight by the number of animals), errors concerning the total number of animals, total weight and/or total space, and compliance of the estimated load density with the Regulation (EC) no. 1/2005.
The likelihood of finding a compilation error concerning the total number of animals, total weight, and/or total space was associated with both the consignor and the transporter (p < .001; Table ). The odds of finding an irregularity was higher or lower in one of the larger consignor or transporter compared with the group of small consignors/transporters. Some specific companies filled in the TRACES better than others. For example, consignor B and transporter B were less likely to make errors related to total number of animals, total weight, and/or total space than small consignors and transporter, respectively (p < .001).
Table 5. Factors associated with the presence of at least one error related to total number of animals, total weight, and/or total space, regulatory compliance for foreseen restings, and concordance between declared and estimated duration.
The foreseen resting stops were indicated in most of the TRACES (79.4%; Table ). The number of foreseen resting stops reported ranged from 1 to 9 although their duration was never specified. Based on the journey duration, we estimated that 50 TRACES (15.6%) should have included at least 2 foreseen resting stops. The foreseen resting stops indicated in the examined TRACES did not comply with the Regulation in 67 cases (20.9%) and this non-compliance was associated with both the consignor and the transporter (p < .001; Table ). For example, consignor C (p = .005) and transporter A (p < 0.001) were more likely not to be compliant for the foreseen resting stops than small consignors.
Table 6. Descriptive statistics of parameters related to foreseen resting stops as reported on the planning or estimated, and regulatory compliance.
Table shows descriptive statistics for the journey length as reported in the TRACES and as calculated based on the kilometres travelled and the compulsory resting stops. The mean kilometres travelled were 1497 and 2435 for loads directed to Italy and Greece, respectively. Mean durations reported on the planning were 23 and 49 h for Italy and Greece, respectively, while mean durations calculated according to kilometres and foreseen resting stops were 24 and 69, respectively. Less than a third of the examined TRACES (98/320, 30.6%) reported durations congruent with the theoretical ones while, in most of them (61.6%; p < .001), the estimated duration was at least 5 h longer than that reported in the planning (Figure ). The concordance between declared and estimated duration was associated with both the consignor and transporter (p < .01; Table ). It could be noted that consignor B, in addition to fewer errors related to space, animals’ number and weight, was less likely to make errors also related to the journey duration compared to small consignors (p < .001).
Figure 3. Distribution of the comparison between the estimated journey time reported in each examined TRACES and those calculated according to journey length (at an average speed of 70 km/h), including 1 h for loading/unloading practices and duration of compulsory resting stops.
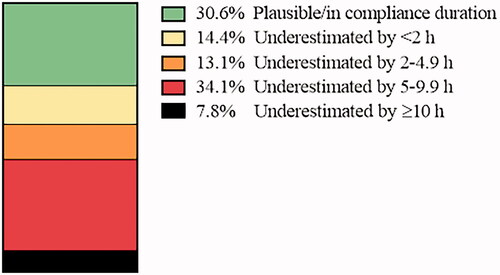
Table 7. Descriptive statistics for the duration of the journey as reported in the examined TRACES and as calculated based on the kilometres travelled and the compulsory resting stops.
Discussion
Our study analysed retrospectively the TRACES approved for the movements of live cattle from France towards a Southern Italian Provence or crossing it towards Greece in 2019 and 2020. Our data supported the hypothesis that article 14 of Regulation EC No. 1/2005 was often not fulfilled and the majority of the TRACES were not correctly filled in resulting in a high quantity of missing information concerning total space and total load. Consequently, in many TRACES it was impossible to double-check whether the minimal space allowance was fulfilled. However, since space allowance and journey duration vary depending on the animal category (i.e. animal body weight) and this information is never reported in TRACES, in the future official veterinarians would be able to double-check whether the journey is compliant with the legislation (i.e. minimum space allowance, maximum journey length, resting period), only if the ‘category of the transported animal’ was added to the current TRACES format. Our findings could be therefore useful to implement the EC 1/2005 currently under revision.
Medium-sized cattle (325–549 kg) was the category we found to be the animal category mostly transported from France. This was expected and in line with the reported live animal trade happening in Europe (European Parliament Citation2018). Italy indeed tends to import beef steers mainly from France (SustainBeef Citation2020). However, it is worth noting that we tried to calculate this category based on the total load and the number of animals, and, in half of the cases, the data were missing so it was impossible to determine it. This calculation is one of the first action an Official Veterinarian (OV) must do for double-checking the congruity of the proposed journey with the legislation. Animal welfare recommendations are adapted to each type of animal as it is well known that animals of different ages and sizes could differently respond to transport stress (MAMIC Citation2001; EFSA Citation2004; Schwartzkopf-Genswein et al. Citation2016). It is worth highlighting that the EC 1/2005 has a special requirement for lactating females (i.e. they shall be milked at intervals of not more than 12 h), but declaring whether a cow is or is not in lactation is also not a requirement in the current TRACES. It is therefore recommended that the animal category and the physiological state of the animal (i.e. whether the animal is lactating) would be included in the TRACES. Inserting the category would be a useful implementation, as recently suggested in the literature (Dahl-Pedersen and Herskin Citation2021). Otherwise, a part the identification number of each animal, age, and sex could be added as already happens for TRACES of sheep, or sex and date of birth as for TRACES of dogs, or date of birth as for TRACES of pigs. Harmonising among species of the information related to the transported animals inserted in the TRACES system could be recommended to implement this tool for monitoring animal welfare during transportation. Another possibility would be to not allow the submission of a TRACES in the system if one of the critical information (i.e. total load, number of animals, and total space) was not present. Current innovative information system allows forcing the presence of particular data before applying. Otherwise, OVs must comply with the current legislation and do not approve TRACES until they are correctly filled in.
Space allowance has been identified as a risk factor for poor welfare during transport (EFSA Citation2011; Marahrens et al. Citation2011). The minimum space allowance is crucial not only to allow animals to maintain balance minimising the risk of hitting or falling but also to permit them to lie down and rest, reach in an easier way drinking system, avoid dominant animals and aggression, and minimise thermal stress. Several studies showed the negative impact of high stocking density on animal welfare (González et al. Citation2012; Schwartzkopf-Genswein et al. Citation2012). In the literature, it has been reviewed that animals transported at high densities showed a high number of bruising on their carcass that depreciates their commercial value (Miranda-de la Lama et al. Citation2014; Mendonça et al. Citation2019). Stocking density has also been linked to heat stress, a major concern for cattle welfare during transportation (EFSA Citation2011; Caulfield et al. Citation2014). Overcrowded vehicles, indeed, become much hotter inside since metabolic heat generated by animals increases the ambient temperature in a proportional way to the stocking density (MAMIC Citation2001; Caulfield et al. Citation2014). The risk of thermal stress also increases in animals that do not have adequate airflow on top and or their sides. Vehicles used for the transport of livestock, thus, must be equipped with a ventilation system to ensure acceptable micro-environmental conditions within each trailer compart (Council of the European Union Citation2005; Caulfield et al. Citation2014; Miranda-de la Lama et al. Citation2014). In the present study, it was not possible to obtain information about the characteristics and the equipment of vehicles for privacy reasons. We know, however, that the examined routes go from the North to the South of Europe, thus, environmental temperatures are often hotter at arrival in comparison with departure. This further worsens the trailer microclimate increasing the risk not only of negative health and welfare outcomes but also of poor meat quality (Goldhawk et al. Citation2014; Schwartzkopf-Genswein et al. Citation2016). It has been recently found, for example, that the thermal variance from departure to arrival increases the likelihood to find animals infected by BRD after journeys (Padalino et al. Citation2021). The current regulations suggest minimum space allowance depending on the category and it suggests that the space allowance should be adapted depending on the weather condition (Council of the European Union Citation2005). In our dataset, when it was possible to calculate space allowance, this was in compliance with the regulation. However, it is worth noting that it was impossible to determine it in almost 60% of the cases. So, those TRACES were approved but without tools to double-check whether they were or not compliant with EC 1/2005. Finally, it should also point out that expressing space allowance as space per animal is not appropriate, because more than 20 years ago it was demonstrated that stocking density should not be expressed in square metres per animal but in square metres per 100 kg to allow animals to lie down and cope better with transport stress (Knowles et al. Citation1998). Currently, stocking density is expressed in this way only for pigs. Interestingly, some authors proposed to evaluate the loading density in terms of allometric coefficient (k value, calculated as m2 per animal/BW0.667) as it provides a standardised measure according to the animal size (Petherick and Phillips Citation2009). González et al. (Citation2012) showed that the low space allowance as indicated by a low allometric coefficient (k < 0.015) increases the likelihood of death and of becoming non-ambulatory in cattle. So, based on the above scientific evidence, the EC 1/2005 could be implemented adopting a consistent unit to express space allowance and implement the current minimum space allowance which has been proven to be still able to cause welfare consequences. Our data also show that TRACES system should be implemented to make sure that minimum space allowance could be easily determined and never be lacking information. This would help OVs not only during the approval of the TRACES but also during on-road inspections. Vehicle transporting cattle has been reported as the category which still gets fined the most during those inspections and mainly due to overcrowding (Nanni Costa et al. Citation2012; Padalino et al. Citation2020). Tracing systems for animal transport vehicles monitoring parameters such as temperature, relative humidity, and total loaded weight could favour the assessment of animal welfare during transport in real time, allowing drivers to take corrective actions and authorities to monitor regulatory compliance (EFSA Citation2011).
Maximum journey duration is one of the most discussed topics in terms of animal welfare (Cave et al. Citation2005; EFSA Citation2011; González et al. Citation2012; Padalino Citation2015; Padalino and Riley Citation2020). Journey duration is indeed the major risk factor for transport-related morbidity and mortality in free-moving animals (Schwartzkopf-Genswein et al. Citation2012; Padalino et al. Citation2015; Padalino et al. Citation2018). Long distances are assumed to affect the physiological and behavioural state of cattle (Miranda-de la Lama et al. Citation2014), impairing the animal immune system (Padalino et al. Citation2017). As distance increases, glycogen consumption increases (Chulayo and Muchenje Citation2017; Reiche et al. Citation2019). Furthermore, longer journeys may lead to a longer time of water deprivation, generating conditions of greater dehydration and haemoconcentration, especially in the hot season (Tadich et al. Citation2005; Chulayo and Muchenje Citation2017). González et al. (Citation2012) found that journeys lasting more than 30 h conducted in North America increase the likelihood of lameness and increase the likelihood of death in cattle. Cirone et al. (Citation2019) reported an increase in BRD-related pathogens in beef cattle travelling from France to Puglia for about 1700 km. The examined TRACES covered similar routes and it is worth highlighting that the majority of the TRACES were approved even if the expected duration was incongruent with the planning. This incongruence exceeded 5 h in most of the TRACES. Finally, it is worth highlighting that the time spent in a roll on-roll off ferry from Bari to Greece may vary a lot depending on the weather conditions and due to a variable waiting time for loading which may be longer due to congestions, particularly in the summer period. Rules on animal transportation on the ferry are currently under-regulated and need implementations (EFSA Citation2021).
For weaned calves and cattle, a one-hour resting stop is compulsory after the first 14 h of travel. During the resting stop, animals should be checked, watered, and fed (EFSA Citation2004; Council of the European Union Citation2005). However, in our TRACES, more stops were often listed, and those were mainly due to logistics reasons, often because the same vehicle stopped in multiple farms to load different animals, or for changes of drivers. Journeys with multiple stops have been named as ‘milking way’ and, in the literature, it has been recommended to avoid them because those stops increase the journey duration, not only due to the stops but also because of routes deviations to reach a particular location (Frisk et al. Citation2018; Meléndez et al. Citation2020). Recently, it has been found that an extra stop during a long journey increases the likelihood of cattle being positive for Pastorella spp and Mannenia after the journey (Padalino et al. Citation2021). Further studies should thus investigate the effects of rest stops on different welfare outcomes (Schwartzkopf-Genswein et al. Citation2016). We suggest that TRACES system and the welfare of the transported animals would improve by OVs double-checking carefully the journey plans questioning multiple stops before approving this type of journey.
Consignors and transporters resulted associated with the investigated irregularities in the logistic regression analysis. This is a new finding even if we cannot identify which management aspects (i.e. administrative staff, drivers, routes) are the real risk factors. Privacy issues prevented the in-depth analysis of those data. The classification into small and large companies, furthermore, did not allow to highlight particular trends. It seems that the differences were related to the characteristics of the individual consignors and transporters rather than to their size. Consequently, our finding suggested that the correct compilation of the TRACES represents a modus operandi of the single companies and transporters. The compilation of TRACES varied, therefore, depending on the single companies, suggesting that training of the operators in the correct compilation of TRACES would be useful. It is also worthwhile noting that there is no harmonisation of sanctions in Europe to date. This could contribute not only to the superficiality of consignors and transporters in drafting documents but also to the difficulty of OVs in managing infringements for interstate transports. Previous studies have shown the importance of the training and experience of the drivers as regards both the driving ability and the handling of the animal (González et al. Citation2012; Miranda-de la Lama et al. Citation2014; Padalino et al. Citation2016), but the congruity of the documents, whether those stakeholders can fill or fill in the documents correctly, had never been taken into consideration. Generally speaking, however, our results confirm those of audits carried out by the Food and Veterinary Office (i.e. European Commission) in several European countries. The reports indicated that manual monitoring and documentation in the journey logs are often incomplete or unrealistic recommending maximum accuracy in their compilation to allow for verifying compliance (Food and Veterinary Office Citation2009; Food and Veterinary Office Citation2010; Food and Veterinary Office Citation2012). If consignors and transporters were informed about the importance of TRACES and encouraged to complete them correctly and scrupulously, the TRACES system would likely improve. Harmonisation of sanctions is also desirable, at least within European countries.
Our findings should be interpreted with caution because this study has some limitations. First of all, only a small part of the TRACES (towards or across the province of Bari) could be analysed, since the TRACES system is split per Province, so we could not access all TRACES from France to Italy. Consequently, our data cannot be generalised and need to be confirmed in a larger dataset. Second, journey duration has been calculated and as such may be inaccurate, having the real duration of this journey directly from the journey logs would be indeed the best way to double-check the expected duration declared in the TRACES with the real one. However, journey logs are sensitive data that stay with transporters. Similarly, the categories of animals were estimated as they are currently not indicated in the TRACES. This could make the definition of compliance for loading density unreliable. The forced use of estimated values, however, highlights the intrinsic shortcomings of the TRACES. Making those data available would be useful to monitor and protect animal welfare during transportation. Third, some information could not be obtained retrospectively for privacy reasons limiting the possibility to analyse other important risk factors for animal welfare, such as trailer characteristics or drivers’ training and experience (Lapworth Citation2008; Miranda-de la Lama et al. Citation2014; Schwartzkopf-Genswein et al. Citation2016).
Notwithstanding the aforementioned limitations, this is the first study that has analysed a large quantity of TRACES showing the inaccuracy in their completeness and suggesting many recommendations to implement both TRACES and current European law on the protection of animals during road transportation.
Conclusions
Overall, this study documented that almost half of the TRACES approved for transporting cattle from France to an Italian Province (Bari) and Greece were inadequately filled in and contained many irregularities. Based on our analysis of the TRACES, we suggest that the system would improve by adding the category of the animals, since all important parameters, such as maximal journey duration, resting stops and space allowance, depends on it. The system could also be implement enforcing that all the data currently present in the TRACES are filled in correctly allowing OVs to double-check them accurately before their approval. Further studies are needed analysing a larger dataset of TRACES, but for doing it, all data related to animal transportation should be transparent and open access.
Disclosure statement
No potential conflict of interest was reported by the author(s).
Additional information
Funding
References
- Broom D. 2008. In: Appleby M, Cussen V, Garcés L, Lambert L, Turner J, editors. The welfare of livestock during road transport. London, UK: Long Distance Transp Welf Farm Anim. Publisher; p. 157–181.
- Calderòn AA, Romo Valdez AM, Romo Rubio JA, Rìos Rincòn FG. 2020. Effect of transport on welfare indicators in beef cattle; an analysis. Agro Product. 13(6):107–111.
- Caulfield MP, Cambridge H, Foster SF, McGreevy PD. 2014. Heat stress: a major contributor to poor animal welfare associated with long-haul live export voyages. Vet J. 199(2):223–228.
- Cave JG, Callinan APL, Woonton WK. 2005. Mortalities in bobby calves associated with long distance transport. Aust Vet J. 83(1–2):82–84.
- Chacon G, Garcia-Belenguer S, Villarroel M, Maria GA. 2005. Effect of transport stress on physiological responses of male bovines. Dtsch Tierarztl Wochenschr. 112(12):465–469.
- Chulayo AY, Muchenje V. 2017. Activities of some stress enzymes as indicators of slaughter cattle welfare and their relationship with physico-chemical characteristics of beef. Animal. 11(9):1645–1652.
- Cirone F, Padalino B, Tullio D, Capozza P, Surdo ML, Lanave G, Pratelli A. 2019. Prevalence of pathogens related to bovine respiratory disease before and after transportation in beef steers: preliminary results. Animals. 9(12):1093.
- Council of the European Union. 2005. Council Regulation (EC) No. 1/2005 of 22 December 2004 on the protection of animals during transport and related operations and amending Directives 64/432/EEC and 93/119/EC and Regulation (EC) No. 1255/97.
- Dahl-Pedersen K, Herskin MS. 2021. Transportation of cattle and pigs between EU Member States 2014–2018–Can data from TRACES be used to create overview and inform about potential welfare consequences? J Appl Anim Welf Sci. https://doi.org/https://doi.org/10.1080/10888705.2021.1923491
- EFSA. 2004. The welfare of animals during transport. Efsa J. 44:1–36. https://efsa.onlinelibrary.wiley.com/doi/pdf/.https://doi.org/10.2903/j.efsa.2004.44
- EFSA. 2011. Scientific opinion concerning the welfare of animals during transport. Efsa J. 9(1):1966.
- EFSA. 2021. EFSA website [Internet]. [accessed 2021 May 18]. https://www.efsa.europa.eu/en.
- European Commission. 2019. Annual activity reports 2018 [Internet]. [place unknown]. https://ec.europa.eu/info/publications/annual-activity-reports-2018_en.
- European Parliament. 2018. Regulation (EC) No. 1/2005 on the protection of animals during transport and related operations: European implementation assessment. LU Publ Off [Internet]. [accessed 2021 May 1] (April). https://www.europarl.europa.eu/RegData/etudes/STUD/2018/621853/EPRS_STU(2018)621853_EN.pdf.
- Food and Veterinary Office. 2009. Final report of a specific audit carried out in Slovenia from 16 to 24 June 2009 in order to evaluate the implementation of controls for animal welfare on farms, during transport and at the time of slaughter in the context of a general audit [Internet]. [place unknown]. https://ec.europa.eu/food/audits-analysis/audit_reports/details.cfm?rep_id=2396&rep_inspection_ref=xxx.
- Food and Veterinary Office. 2010. Final report of a specific audit carried out in France from 01 to 12 February 2010 in order to evaluate the implementation of controls for animal welfare on farms and during transport in the context of a general audit [Internet]. [place unknown]. https://ec.europa.eu/food/audits-analysis/audit_reports/details.cfm?rep_id=2468&rep_inspection_ref=xxx.
- Food and Veterinary Office. 2012. Final report of an audit carried out in Italy from 09 to 18 November 2011 in order to evaluate the implementation of controls for animal welfare on farms and during transport [Internet]. [place unknown]. https://sivemp.it/wp/wp-content/uploads/2018/11/dgsanco20116048_report_fvo.pdf.
- Frisk M, Jonsson A, Sellman S, Flisberg P, Rönnqvist M, Wennergren U. 2018. Route optimization as an instrument to improve animal welfare and economics in pre-slaughter logistics. PLoS One. 13(3):e0193223.
- Goldhawk C, Crowe T, Janzen E, González LA, Kastelic J, Pajor E, Schwartzkopf-Genswein KS. 2014. Trailer microclimate during commercial transportation of feeder cattle and relationship to indicators of cattle welfare. J Anim Sci. 92(11):5155–5165.
- González LA, Schwartzkopf-Genswein KS, Bryan M, Silasi R, Brown F. 2012. Relationships between transport conditions and welfare outcomes during commercial long haul transport of cattle in North America. J Anim Sci. 90(10):3640–3651.
- ISTAT. 2021. Livestock import export [Internet]. [accessed 2021 May 5]. http://dati.istat.it/index.aspx?lang=en&SubSessionId=8f8e0ae6-8282-4f88-9c36-1992ee409f33.
- Knowles TG, Warriss PD, Brown SN, Edwards JE. 1998. Effects of stocking density on lambs being transported by road. Vet Rec. 142(19):503–509.
- Knowles TG, Warriss PD, Brown SN, Kestin SC. 1994. Long distance transport of export lambs. Vet Rec. 134(5):107–110.
- Knowles TG, Warriss PD, Brown SN, Kestin SC, Rhind SM, Edwards JE, Anil MH, Dolan SK. 1993. Long distance transport of lambs and the time needed for subsequent recovery. Vet Rec. 133(12):286–293.
- Lapworth J. 2008. Engineering and design of vehicles for long distance road transport of livestock: the example of cattle transport of Northern Australia. Vet Ital. 44(1):215–222.
- MAMIC. 2001. Investigation of the ventilation efficacy on Livestock Vessels. Sydney, Australia.
- Marahrens M, Kleinschmidt N, Di Nardo A, Velarde A, Fuentes C, Truar A, Otero JL, Di Fede E, Villa PD. 2011. Risk assessment in animal welfare – especially referring to animal transport. Prev Vet Med. 102(2):157–163.
- Meléndez DM, Marti S, Haley DB, Schwinghamer TD, Schwartzkopf-Genswein KS. 2020. Effect of transport and rest stop duration on the welfare of conditioned cattle transported by road. PLoS One. 15(3):e0228492.
- Mendonça FS, Vaz RZ, Vaz FN, Leal WS, Silveira IDB, Restle J, Boligon AA, Cardoso FF. 2019. Causes of bruising in carcasses of beef cattle during farm, transport, and slaughterhouse handling in Brazil. Anim Sci J. 90(2):288–296.
- Miranda-de la Lama GC, Villarroel M, María GA. 2014. Livestock transport from the perspective of the pre-slaughter logistic chain: a review. Meat Sci. 98(1):9–20.
- Nanni Costa L, Sapino M, Pippione S, Mattalia G, Saracco MD, Trani S, Zanasi C. 2012. Risk assessment in stock calf transportation from France to Italy: the contribution of road inspections. Ital J Anim Sci. 11(1):e6.
- Padalino B. 2015. Effects of the different transport phases on equine health status, behavior, and welfare: a review. J Vet Behav. 10(3):272–282.
- Padalino B, Barrasso R, Tullio D, Zappaterra M, Costa LN, Bozzo G. 2020. Protection of animals during transport: analysis of the infringements reported from 2009 to 2013 during on-road inspections in Italy. Animals. 10(2):356.
- Padalino B, Cirone F, Zappaterra M, Tullio D, Ficco G, Giustino A, Ndiana LA, Pratelli A. 2021. Factors affecting the development of bovine respiratory disease: a cross-sectional study in beef steers shipped from France to Italy. Front Vet Sci. 8:627894.
- Padalino B, Hall E, Raidal S, Celi P, Knight P, Jeffcott L, Muscatello G. 2015. Health problems and risk factors associated with long haul transport of horses in Australia. Animals. 5(4):1296–1310.
- Padalino B, Raidal SL, Carter N, Celi P, Muscatello G, Jeffcott L, de Silva K. 2017. Immunological, clinical, haematological and oxidative responses to long distance transportation in horses. Res Vet Sci. 115:78–87.
- Padalino B, Raidal SL, Hall E, Knight P, Celi P, Jeffcott L, Muscatello G. 2016. A survey on transport management practices associated with injuries and health problems in horses. PLoS One. 11(9):e0162371.
- Padalino B, Riley CB. 2020. Editorial: the implications of transport practices for horse health and welfare. Front Vet Sci. 7:202.
- Padalino B, Tullio D, Cannone S, Bozzo G. 2018. Road transport of farm animals: mortality, morbidity, species and country of origin at a Southern Italian control post. Animals. 8(9):155.
- Petherick JC, Phillips CJC. 2009. Space allowances for confined livestock and their determination from allometric principles. Appl Anim Behav Sci. 117(1–2):1–12.
- Reiche AM, Oberson JL, Silacci P, Messadène-Chelali J, Hess HD, Dohme-Meier F, Dufey PA, Terlouw EMC. 2019. Pre-slaughter stress and horn status influence physiology and meat quality of young bulls. Meat Sci. 158:107892.
- Schwartzkopf-Genswein K, Ahola J, Edwards-Callaway L, Hale D, Paterson J. 2016. SYMPOSIUM PAPER: transportation issues affecting cattle well-being and considerations for the future. Prof Anim Sci. 32(6):707–716.
- Schwartzkopf-Genswein KS, Faucitano L, Dadgar S, Shand P, González LA, Crowe TG. 2012. Road transport of cattle, swine and poultry in North America and its impact on animal welfare, carcass and meat quality: a review. Meat Sci. 92(3):227–243.
- SustainBeef. 2020. Beef production in Italy [Internet]. [accessed 2020 Nov 9]. https://www6.inrae.fr/sustainbeef/Publications/Beef-production-in-the-EU/Beef-production-in-Italy.
- Tadich N, Gallo C, Bustamante H, Schwerter M, Van Schaik G. 2005. Effects of transport and lairage time on some blood constituents of Friesian-cross steers in Chile. Livest Prod Sci. 93(3):223–233.