
 ?Mathematical formulae have been encoded as MathML and are displayed in this HTML version using MathJax in order to improve their display. Uncheck the box to turn MathJax off. This feature requires Javascript. Click on a formula to zoom.
Abstract
The aim of this study was to develop near-infrared spectroscopy (NIRS) prediction models for the estimation of chemical components and the fibre undegradable fractions (uNDF) of hay-based total mixed rations (TMR). A total of 205 TMR samples were used for the study. All the chemical components were measured using standard AOAC reference methods and expressed as percentages of dry matter (DM). Prediction models were developed using both cross- and independent validation and different mathematical treatments applied on spectral data. The best spectral treatment was chosen based on the method which simultaneously achieved the lowest root mean square error and the highest explained variance in cross-validation. The coefficient of determination in external validation (R2P) was the greatest for starch prediction model (R2P = 0.84), followed by acid detergent fibre (ADF; R2P = 0.79), and amylase-treated ash-corrected NDF with addition of sodium sulphite (aNDFom) and crude protein prediction models (CP; R2P = 0.73). The concordance correlation coefficient (CCC) in validation ranged from 0.66 (ash prediction model) to 0.92 (starch prediction model), indicating substantial to accurate models’ predictive ability. This study indicated that NIRS can be a screening method for the prediction of CP, Starch, aNDFom, ADF, acid detergent lignin (ADL), uNDF and Ash. The use of TMR utilised in various herds provided high variability for the NIRS calibration dataset, implying that the developed NIRS pre-diction models could be applicable to TMR collected from herds located in the Parmigiano Reggiano cheese production area.
NIRS can be successfully employed to determine quickly and at cost-effective different compositional and digestibility traits in hay-based TMR.
TMR analysis predicted by NIRS can support nutritionists in the formulation of diets containing a proper nutrient profile to sustain physiological, metabolic, and immunological processes.
The use of NIR technology for TMR analysis can allow frequent monitoring of rations and increasingly timely corrections, maximising cows’ diet utilisation and conversion of the ingested feed.
Highlights
Introduction
Eighteen percent of the total Italian bovine milk production is intended for Parmigiano Reggiano cheese production. This cheese is a Protected Designation of Origin (PDO) product, and it is one of the most traded Italian dairy products (CLAL Citation2021). Parmigiano Reggiano is manufactured from the clotting of raw bovine milk, produced by cows fed with a total mixed ration (TMR) hay-based diet without the addition of any silage, and reared in some specific provinces of Northern Italy (Consorzio del Formaggio Parmigiano Reggiano Citation2011).
Accurate and real-time analysis of TMR provides fundamental information to meet the exact nutritional requirements on field conditions. An inappropriate formulation of the TMR can affect rumen functionality and, particularly in high-producing dairy cattle, it may increase the risks of developing some metabolic disorders such as subacute ruminal acidosis (SARA; Humer et al. Citation2018), abomasum displacement, fatty liver, laminitis, liver abscesses and downer cow syndrome (Plaizier et al. Citation2008; Zebeli and Metzler-Zebeli Citation2012). Moreover, poorly formulated TMR could impair cows’ productivity and efficiency, with a detrimental effect on the sustainability of the dairy production sector (Connor Citation2015).
The management of high-yielding cows requires frequent monitoring of rations and increasingly timely corrections. The control of TMR composition not only requires a good mixer- wagon, but also constant monitoring of feed quality, particularly of forages, which are the feeds with the greatest variability (Palmonari et al. Citation2014; Palmonari et al. Citation2016). In recent decades, many laboratories have developed analytical techniques based on physical methods of analysis, including near-infrared spectroscopy (NIRS). The use of this technology for feedstuff analysis has increased in the last years (Mentink et al. Citation2006). NIRS is a rapid and cost-effective tool for in-line control of the quality of feed offered to animals, allowing nutritionists to get instant feedback on the characteristics of feedstuffs. This technique can be employed to obtain a wide number of analytical parameters simultaneously just from a single spectrum. Furthermore, NIRS is a non-destructive technique, therefore the sample can be stored and eventually used for other purposes. The use of NIRS is a valuable strategy for selecting potential treatments that increase feed digestibility and for avoiding time-consuming chemical analysis (Reeves Citation1994).
This technology has been successfully employed to measure the composition and the quality of single and mixed feedstuffs (Abrams et al. Citation1988; Hoffman et al. Citation1999; Belanche et al. Citation2013; Simoni et al. Citation2021). Mentink et al. (Citation2006), has developed NIRS prediction models for basic nutrients in TMR such as CP, neutral detergent fibre (NDF), starch, non-fibre carbohydrate (NFC) and fat. Lundberg et al. (Citation2004), concluded that NIRS can be effective in predicting the total digestible nutrients (TDN) and in vitro digestibility of organic matter. Moreover, a couple of studies (Righi et al. Citation2017; Brogna et al. Citation2018) demonstrated the effectiveness of NIRS to predict DM, CP, starch, ash, aNDFom, ADF, ADL and undigested NDF (uNDF240) in animal faeces. The NIRS profile of the faeces is considered an excellent tool for predicting the composition and digestibility of the animal’s diet and the amount of ingested dry matter (Johnson et al. Citation2017). To the authors’ knowledge, there are no studies in the literature investigating the use of NIR to assess the quality of the TMR used for Parmigiano Reggiano ration. The main characteristics of this ration are the exclusion of all silage in the cows’ ration and the use of hay as the main source of dry matter (at least 50% of the ration).
Therefore, the aim of the present study was to determine the effectiveness of NIRS to predict the chemical composition and the fibre undegradable fractions (uNDF) of TMR for Parmigiano Reggiano hay-based rations. The practical results of the current research can support nutritionists in the formulation of diets containing a proper nutrient profile to sustain the functioning of physiological, metabolic, and immunological processes in the cattle, and to maximise cows’ utilisation and conversion of the ingested feed.
Materials and methods
Sample collection
Total mixed ration samples were randomly sampled from different trials (Bonfante et al. Citation2016; Fustini et al. Citation2017; Cavallini et al. Citation2018; Mammi et al. Citation2018; Buonaiuto et al. Citation2021; Cavallini, Mammi, Biagi, et al. Citation2021; Cavallini, Mammi, Palmonari, et al. Citation2021; Heinrichs et al. Citation2021) carried out in the experimental herd of the Department of Veterinary Medical Sciences (DIMEVET), University of Bologna, Italy (n = 126). Moreover, a total of 79 TMR samples originated from six commercial dairy farms operating in the Parmigiano Reggiano cheese production area. All the samples (1 kg) were collected from three distinct positions of the manger (beginning, middle, end) immediately after the morning preparation (between 7 and 8 a.m.) of the TMR.
All the farms involved used a TMR feeding system typical of the Parmigiano Reggiano area, consisting of dry hay-based diets (mainly dried alfalfa and dried grass) without the presence of fermented forages (silage). The TMR mixture was prepared and distributed twice a day (every 12 h), in order to reduce the intensity of fermentation phenomena in the feed bunk (Mordenti et al. Citation2017). Diet formulation followed the specific limits of feed described by Parmigiano Reggiano Guidelines (Consorzio del Formaggio Parmigiano Reggiano Citation2011). Moreover, after TMR delivery the physical effectiveness factor of the diet was measured (PEF, Heinrichs Citation2013) and results from 47 to 52%. These data are comparable whit that reported from other commercial dairy farms (Fustini et al. Citation2016).
All the samples were immediately frozen to be subsequently delivered to the laboratory of the Animal Production and Food Safety service of the DIMEVET of the University of Bologna, Italy.
After being delivered to the laboratory, all the samples were spread over an area of one square metre, mixed and divided into 4 squares of 250 g each, one of which was used for the analysis. All the samples were analysed with the following methods, after oven-drying at 65 °C until constant weight to determine the DM and then ground in a Foss Tecator Cyclotec Sample Mill (model 1093; Foss Tecator, Höganäs, Sweden) to obtain a particle size of 1 mm.
Spectra acquisition
Total Mixed ration spectra from 900 to 2500 nm were collected using a TANGO FT-NIR spectrometer (Bruker Optics GmbH, Ettlingen, Germany). Ground samples were distributed in a spinning cup holder for the spectra acquisition. The spectrometer resolution was set on 8 cm and spectra were recorded by OPUS software (version 7.5, Bruker, USA) and obtained by averaging 32 rotating scans with a 97-mm rotator supporter. The spectra were collected in reflectance (R) mode and then transformed into absorbance (log10 1/R). The homogeneous distribution of the spectra population was checked by principal component analysis (PCA) and visualised using the Opus software by PCA spectra scores.
Laboratorial analyses
After NIRS analysis, TMR samples were analysed using wet chemistry to obtain the chemical composition: i) CP according to Association of Official Analytical Chemists (AOAC) (Citation1990); method 976.06 and 984.13, copper catalyst Kjeldahl method), using a Kjeldahl nitrogen/protein analyser (Gerhadt Vapodest 50, Gerhardt GmbH, Königswinter, Germany), ii) starch (Association of Official Analytical Chemists (AOAC) Citation1990; method 996.11), iii) aNDFom, following Mertens et al. (Citation2002), refluxing 0.5 g of sample for 1 h at a boiling temperature in a medium-porosity crucible, using a Fibertec 2010 system (Foss Tecator), iv) ADF (Association of Official Analytical Chemists (AOAC) Citation1990; method 973.18), v) ADL (Association of Official Analytical Chemists (AOAC) Citation1990; method 973.18) and vi) ash after 4 h combustion in a muffle furnace 550 °C (Vulcan 3–550, Dentsply Neytech, Burlington, NJ). Moreover, the following undigested fibre fractions were quantified: i) undigested NDF at 24-h in vitro fermentation (uNDF24), ii) undigested NDF at 30-h in vitro fermentation (uNDF30), iii) undigested NDF at 120-h in vitro fermentation (uNDF120) and iv) undigestible NDF at 240-h in vitro fermentation (uNDF240). The uNDF-h was determined and calculated according to Palmonari et al. (Citation2017). All the results were expressed as a percentage by weight of DM.
Statistical analysis
Descriptive statistics, including mean, standard deviation (SD), minimum and maximum were calculated for all the traits analysed. The chemometric analysis, including calibration and validation of NIRS prediction models for the previously described traits, was carried out using the software OPUS ver. 7.5 (Bruker, USA, version 7.5). Prior to chemometric analysis, references values were matched to their respective raw spectra. Subsequently, samples were randomly assigned to two different subsets: a calibration dataset (70% of the total observations for each trait), used to generate the NIRS prediction models, and a validation dataset (30% of the total observations for each trait), used as an independent dataset in which the prediction models were applied to quantify their predictive ability. Descriptive statistics, including mean and standard deviation, of the studied traits were similar in both calibration and validation subsets. Calibration models were developed according to Giaretta et al. (Citation2019), using different methods, in order to explore the best way to predict TMR composition by NIRS. Briefly, prediction models were developed using partial least squares regression (PLSR; Shenk and Westerhaus Citation1996). Different mathematical pre-treatments on spectral data, such as vector normalisation (VN), multiplicative scatter correction (MSC), subtraction of a straight line (SLS), first derivative (1 D) and second derivative (2 D) were tested and combined using the ‘Optimize’ option of OPUS software, which finds the best mathematical treatment according to the lowest root mean square error of prediction (RMSEP; Naes et al. Citation2002). The optimal number of PLSR factors was determined in the calibration subset using an internal leave-one-out cross-validation, and it was defined as the lowest number of factors to achieve the lowest RMSEP. The maximum allowed number of PLSR factors was set to 20. The goodness-of-fit statistics considered in the present study were the coefficient of determination in calibration and prediction sets (R2C and R2P, respectively), the root mean square error of cross-validation (RMSECV) and the RMSEP. Moreover, the ratio of prediction to deviation (RPD), which is a practical indicator of models’ utility, was calculated as the ratio between the SD to the root mean square error in both cross-validation (RPDC = SD/RMSECV) and prediction (RPDV = SD/RMSEP). Moreover, to evaluate the practical utility of the prediction models, the concordance correlation coefficient (CCC) was calculated using the following formula (Lin Citation1989):
where COV (VP; VR) is the covariance between the reference (VR) and predicted values (VP), σ2R is the variance of the reference values, σ2P is the variance of the predicted values, and μP and μR represent the mean of the predicted and reference values, respectively. When CCC is between 0.21 and 0.40 indicates fair predictive ability, between 0.41 and 0.60 indicates moderate predictive ability, between 0.61 and 0.80 indicates substantial predictive ability, and between 0.81 and 1.00 indicates accurate predictive ability (Lin Citation1989; Visentin et al. Citation2015).
Results and discussion
Descriptive statistics
Descriptive statistics of TMR chemical composition are presented in Table . Crude protein ranged from 6.57 to 20.6% of DM with a CV of 14%, while aNDFom varied between 23.0 and 64.90% of DM with a CV of 19.4% in the TMR. Similarly, the uNDF240 content of TMR ranged from 3.48 to 23.7% of NDF, indicating that a wide digestibility potential existed in the TMR dataset. The traits with the highest variability were starch (CV = 26.30%), ADL (CV = 27.80%) and uNDF240 (CV = 33.20%). Large and representative variability is a desired characteristic in a calibration dataset and could contribute to generate accurate and robust NIRS prediction models (De Marchi et al. Citation2014; De Marchi et al. Citation2018; Wiedemair et al. Citation2019).
Table 1. Descriptive statisticsa of chemical composition, %DM of TMR samples for calibration and cross-validation sample sets.
Goodness-of-fit statistics
Table depicts the best calibration model for the chemical composition obtained from TMR samples. Starch, aNDFom, CP, and ADF contents of TMR were predicted by NIRS with an optimal prediction accuracy (R2P > 0.70). Among all the various mathematical treatments applied for developing the prediction models, taking the first derivate was the best spectral transformation to improve the models’ predictive ability for CP, starch, ash, uNDF24, uNDF30 and uNDF240. The second derivative maximised the explained variance in external calibration for aNDFom, ADF and uNDF120. Vector normalisation was the best mathematical treatment only for the model developed for ADL. The best prediction models were obtained for starch (R2P = 0.83; RPD = 2.53), ADF (R2P = 0.79; RPD = 2.20), CP (R2P = 0.73; RPD = 1.93) and aNDFom (R2P=0.73; RPD = 1.94), whose accuracy indicates a good estimation of the reference values; the calibration model with the lowest accuracy was obtained for ash (R2P=0.47; RPD = 1.37). According to Williams (Citation2004), the value of R2 obtained in the present study is usable for screening and most applications, including research. The CCC in validation observed for the prediction models ranged from 0.66 (for ash prediction model) to 0.92 (starch prediction model). According to that reported in Visentin et al. (Citation2015) the CCC obtained for all the traits investigated in the present study indicate a substantial to accurate models’ predictive ability
Table 2. Fitting statistics of prediction models of TMR for chemical components, % DM.
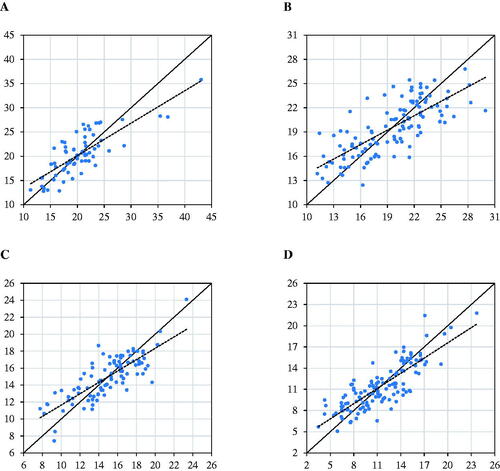
The scatter plots of reference versus predicted TMR chemical composition and fibre digestibility are shown in Figures and . The degree of dispersion observed for the ash content indicates that the current prediction models are characterised by moderate predictive ability, as confirmed by other indicators such as RPD and CCC.
Figure 1. Scatter plot of reference (x-axis) vs. predicted (y-axis) content of: crude protein (A); starch (B); amylase-treated ash-corrected neutral detergent fiber (NDF) with addition of sodium sulphite (C); acid detergent fibre (D); acid detergent lignin (E); ash (F).
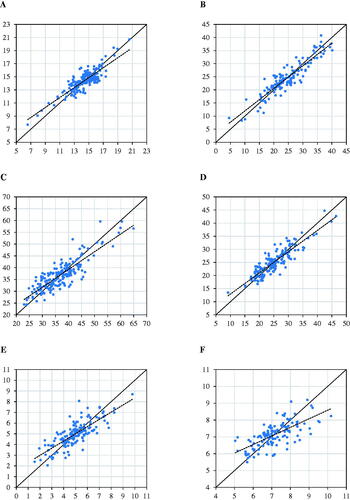
Figure 2. Scatter plot of reference (x-axis) vs predicted (y-axis) undigested neutral detergent fiber (NDF) at: 24 hours (A); 30 hours (B); 120 hours (C); 240 hours (D).
The utility of this technology to predict some nutrient concentration, such as CP, Starch and NDF, in forages or other feeds is well documented in the literature (Shenk and Westerhaus Citation1994; Barrière et al. Citation2004; Mentink et al. Citation2006; Fredin et al. Citation2014), although these studies used samples collected in production systems different from that of Parmigiano Reggiano. Mentink et al. (Citation2006), have analysed the nutrient content in TMR, obtaining similar models’ accuracy, although greater compared to those obtained in the present study, for the prediction of CP (R2CV = 0.87), NDF (R2CV = 0.90) and starch (R2CV=0.89). This may be due to the different laboratory techniques employed by Mentink et al. (Citation2006), particularly for the determination of starch content. Regarding uNDF prediction, all the time points were predicted with moderate accuracy (R2P > 0.60). The effectiveness of NIRS for the prediction of such parameters has also been investigated by Nousiainen et al. (Citation2004), Brogna et al. (Citation2018), although the latter developed NIRS calibration using spectra collected from animals’ faeces (301 samples) collected from 4 feeding trials (Righi et al. Citation2017), and from commercial Finnish dairy farms (Nousiainen et al. Citation2004). Moreover, Simoni et al. (Citation2021) developed a prediction model for TMR (164 samples) and faeces (172 samples) of beef cattle collecting data from 5 herds located in the Veneto region (Northern Italy). In particular, the R2CV reported in Brogna et al. (Citation2018) were 0.93, 0.91, 0.91, 0.93, 0.66 and 0.92, for CP, aNDFom, ADF, ADL, starch and uNDF240, respectively. Faeces spectra were used also in the research by Righi et al. (Citation2017), who developed NIRS prediction models for NDF, ADF, ADL and uNDF240 using 130 faecal samples collected from lactating dairy cows randomly selected from different herds located in northern Italy fed with TMR hay-based ration. The R2CV reported in Simoni et al. (Citation2021) for TMR were 0.80, 0.86, 0.53,0.82 and 0.66, for aNDF, ADF, ash, and uNDF240, respectively, while for the faeces prediction models R2CV was 0.75, 0.82, 0.04, 0.75, 0.45, for aNDF, ADF, ash, and uNDF240, respectively. The results from the present study for the prediction of such traits, although models were developed in TMR, are in strong agreement with Righi et al. (Citation2017). The greatest differences in terms of R2 in calibration were observed for NDF (0.11 points lower in the present study) and ADL (0.13 points lower in the present study).
The prediction models developed for the fibre digestibility indicated an R2P between 0.56 (for uNDF30prediction model) and 0.68 (for uNDF240 prediction model); according to Williams (Citation2004), this range of R2P suggests that developed models be used as a screening method. Even if the R2P values are not optimal, the CCC varied from 0.73 (for uNDF30 prediction model) to 0.82 (for uNDF240 prediction model). According to Visentin et al. (Citation2015), this CCC interval indicates a substantial predictive ability of the developed models. The use of NIRS to investigate the feed and TMR fibre digestibility is a relatively recent topic. Brogna et al. (Citation2018) indicated that the main problems in interpreting the NIRS technique, related to cell wall digestibility, are the high interference of residual water absorbance and the variable absorbance of C-H bonds in many spectral regions, which overlaps the absorbance of digestible components of aNDFom. In addition, Nousiainen et al. (Citation2004) observed that the high presence of fibres might affect the relationship between spectra and reference values; this is because fibres are not composed of a single component but include multiple chemical components interacting with multiple spectral regions. Furthermore, as evidenced by Brogna et al. (Citation2018), the laboratory reference analysis for the determination of the fibre fractions and their digestibility could have larger analytical errors compared to other nutrient’s analytical methods, affecting the prediction model quality.
The use of NIRS in the analysis of compound or mixed feeds (such as TMR) becomes more problematic as some feeds may contain several different ingredients (White and Rouvinen-Watt Citation2004). Each raw material or ingredient has its own spectral pattern due to its chemical or physical properties and there is an infinite number of possible combinations, thus the spectra of compound feeds vary greatly (Givens et al. Citation1997). While preparing a NIRS calibration model, it is critical to obtain samples that are both relevant and representative of the mixed feed to which the models will be applied. It is critical to assure that all potential sources of variability, such as formulation aspects (e.g. concentration range of all components), physical properties (e.g. particle size) and other sources of variability resulting from the distribution operations (e.g. blending) are included in the calibration samples. During the preparation of calibration models, it is often difficult to obtain calibration samples that are both highly relevant and representative. Therefore, it is important to collect a large calibration set, maximising the variation in all parameters as well as ingredients to be incorporated. Another important issue is related to the physical properties of samples to be scanned by NIRS, which was heavily discussed in other papers (Berzaghi and Riovanto Citation2009; Karande et al. Citation2010). Also the presence of unground particles (e.g. flakes, pellets, tablets or whole forages) in the samples, affecting the variation of the spectral baseline. According to Brimmer and Hall (Citation2001) the presence of unground particles can increase the difficulty of obtaining a representative sample, especially because these raw materials have a high heterogeneity. In order to improve the reproducibility of collected TMR samples, these authors recommend the use of a large amount of samples (1 kg or more).
The NIRS prediction models of TMR ash content developed in the present study were characterised by moderate accuracy (R2P < 0.70). These results are not surprising and are reported by other authors (Lundberg et al. Citation2004; Giaretta et al. Citation2019). The NIRS radiation, indeed, does not have a good interaction with minerals or inorganic compounds. Manuelian et al. (Citation2017) have obtained a NIRS prediction model to evaluate the fresh cheese mineral composition, obtaining an optimal prediction accuracy (R2CV > 0.75) for calcium (Ca), magnesium (Mg), sodium (Na), and phosphorous (P) content. Moreover, these authors (Manuelian et al. Citation2017) observed that although minerals do not have a specific absorption band in the NIR region, some prediction models (e.g. Na) have been related to water absorption bands.
From a practical point of view, prediction models developed in the present study could be applicable as an in-line screening method to rapidly discriminate between feed samples with greater or lower nutrient content or digestibility capacity. However, the accuracy of NIRS prediction models could be improved by increasing the number of samples in the calibration dataset, and also by including samples which could contribute to augment its variability. As proposed by Visentin et al. (Citation2019), one strategy could be to set up a quality control which identifies TMR spectral samples substantially deviating from the spectra included in the calibration dataset. This would be achievable in further improvements of models’ accuracy, for example, by quantifying the Mahalanobis distance between these spectra and the centroid of the spectral cluster used to generate NIRS prediction models through a PCA. Subsequently, the samples with high Mahalanobis distance could be analysed with reference analyses and used to recalibrate NIRS models.
Conclusions
The increased nutritional requirements, which are needed for the management of high-yielding dairy cows, demand more timely and frequent monitoring and corrections of rations. This study indicated that NIRS can be used as a screening method for the prediction of CP, Starch, aNDFom, ADF, ADL, undigested NDF and Ash also in Parmigiano Reggiano dry rations. The use of TMR utilised in various herds provided high variability for the NIRS calibration dataset, implying that the developed NIRS models could be successfully applied to TMR collected from herds in the Parmigiano Reggiano area. The calibration equations performance was confirmed in the validation test predicting samples not included in the training data set. The integration of NIRS technology in dairy cows’ precision feeding could provide a quick and simple method to transfer analytical data to the rationing software.
| List of abbreviations | ||
| NIRS | = | near-infrared spectroscopy |
| TMR | = | total mixed ration |
| DM | = | dry matter |
| PDO | = | protected designation of origin |
| PR | = | Parmigiano Reggiano |
| SARA | = | subacute ruminal acidosis |
| NFC | = | non-fibre carbohydrate |
| R2 | = | coefficient of determination |
| TDN | = | total digestible nutrients |
| DIMEVET | = | Department of Veterinary Medical Science |
| R | = | reflectance |
| PCA | = | principal component analysis |
| CP | = | crude protein |
| NDF | = | neutral detergent fibre |
| aNDFom | = | amylase- and sodium sulphite-treated neutral deterged fibre with ash correction |
| ADF | = | acid deterged fibre |
| ADL | = | acid deterged lignin |
| uNDF24 | = | undigestible NDF at 24-h in vitro fermentation |
| uNDF30 | = | undigestible NDF at 30-h in vitro fermentation |
| uNDF120 | = | undigestible NDF at 120-h in vitro fermentation |
| uNDF240 | = | undigestible NDF at 240-h in vitro fermentation |
| PLSR | = | partial least squares regression |
| VN | = | vector normalisation |
| MSC | = | multiplicative scatter correction |
| SLS | = | subtraction of a straight line |
| 1D | = | first derivative |
| 2D | = | second derivative |
| RMSEP | = | root mean square error of prediction |
| R2C | = | coefficient of determination in calibration sets |
| R2P | = | coefficient of determination in prediction sets |
| RMSECV | = | root mean square error of cross validation |
| SD | = | standard deviation |
| RPD | = | ratio of prediction to deviation |
| RPDC | = | root mean square error in cross-validation |
| RPDV | = | root mean square error in prediction |
| CV | = | Coefficient of variation |
| MIRS | = | mid-infrared spectroscopy |
| CCC | = | Concordance Correlation Coefficient. |
Acknowledgements
The authors express their appreciation to Sara Speroni and Jenny Bongiovanni for their technical assistance.
Disclosure statement
No potential conflict of interest was reported by the author(s).
Data availability statement
Data used in the current study are available upon request from the corresponding author.
Additional information
Funding
References
- Abrams SM, Shenk JS, Harpster HW. 1988. Potential of near infrared reflectance spectroscopy for analysis of silage composition. J Dairy Sci. 71(7):1955–1959.
- Association of Official Analytical Chemists (AOAC). 1990. Official methods of analysis. 15th ed. Arlington, VA, USA.
- Barrière Y, Dias Gonçalves G, Emile JC, Lefèvre B. 2004. Higher intake of DK265 corn silage by dairy cattle. J Dairy Sci. 87(5):1439–1445.
- Belanche A, Weisbjerg MR, Allison GG, Newbold CJ, Moorby JM. 2013. Estimation of feed crude protein concentration and rumen degradability by fourier-transform infrared spectroscopy. J Dairy Sci. 96(12):7867–7880.
- Berzaghi P, Riovanto R. 2009. Near infrared spectroscopy in animal science production: principles and applications. Ital J Anim Sci. 8(sup3):39–62.
- Bonfante E, Palmonari A, Mammi L, Canestrari G, Fustini M, Formigoni A. 2016. Effects of a completely pelleted diet on growth performance in Holstein heifers. J Dairy Sci. 99(12):9724–9731.
- Brimmer PJ, Hall JW. 2001. Method development and implementation of near-infrared spectroscopy in industrial manufacturing support laboratories. In: Williams PK, Norris K, editors. Near-infrared technology in the agricultural and food industries. 2nd ed. St. Paul, Minnesota, USA: American Association of Cereal Chemists Inc.; p. 187–198.
- Brogna N, Palmonari A, Canestrari G, Mammi L, Prà AD, Formigoni A. 2018. Technical note: near infrared reflectance spectroscopy to predict fecal indigestible neutral detergent fiber for dairy cows. J Dairy Sci. 101(2):1234–1239.
- Buonaiuto G, Palmonari A, Ghiaccio F, Visentin G, Cavallini D, Campidonico L, Formigoni A, Mammi LME. 2021. Effects of complete replacement of corn flour with sorghum flour in dairy cows fed Parmigiano Reggiano dry hay-based ration. Ital J Anim Sci. 20(1):826–833.
- Cavallini D, Mammi LME, Biagi G, Fusaro I, Giammarco M, Formigoni A, Palmonari A. 2021. Effects of 00-rapeseed meal inclusion in Parmigiano Reggiano hay-based ration on dairy cows’ production, reticular pH and fibre digestibility. Ital J Anim Sci. 20(1):295–303.
- Cavallini D, Mammi LME, Fustini M, Palmonari A, Heinrichs AJ, Formigoni A. 2018. Effects of ad libitum or restricted access to total mixed ration with supplemental long hay on production, intake, and rumination. J Dairy Sci. 101(12):10922–10928.
- Cavallini D, Mammi LME, Palmonari A, Valle E, Formigoni A. 2021. Immune-metabolic-inflammatory markers in Holstein cows exposed to a nutritional and environmental stressing challenge. J Anim Physiol Anim Nutr.
- CLAL. 2021 . Metadata. [accessed 2021 Mar 15]. https://www.clal.it/en/index.php
- Connor EE. 2015. Invited review: improving feed efficiency in dairy production: challenges and possibilities. Animal. 9(3):395–408.
- Consorzio del Formaggio Parmigiano Reggiano. 2011. Specification of the Parmigiano Reggiano cheese. [accessed 2021 Aug 23]. https://www.parmigianoreggiano.com
- De Marchi M, Penasa M, Zidi A, Manuelian CL. 2018. Invited review: use of infrared technologies for the assessment of dairy products – applications and perspectives. J Dairy Sci. 101(12):10589–10604.
- De Marchi M, Toffanin V, Cassandro M, Penasa M. 2014. Invited review: mid-infrared spectroscopy as phenotyping tool for milk traits. J Dairy Sci. 97(3):1171–1186.
- Fredin SM, Ferraretto LF, Akins MS, Hoffman PC, Shaver RD. 2014. Fecal starch as an indicator of total-tract starch digestibility by lactating dairy cows. J Dairy Sci. 97(3):1862–1871.
- Fustini M, Heinrichs AJ, Palmonari A, Formigoni A. 2016. Case study: farm characteristics and total mixed ration particle size issues on Parmigiano Reggiano farms in northern Italy. Prof Anim Sci. 32(6):869–873.
- Fustini M, Palmonari A, Canestrari G, Bonfante E, Mammi L, Pacchioli MT, Sniffen GCJ, Grant RJ, Cotanch KW, Formigoni A. 2017. Effect of undigested neutral detergent fiber content of alfalfa hay on lactating dairy cows: feeding behavior, fiber digestibility, and lactation performance. J. Dairy Sci. 100(6):4475–4483.
- Giaretta E, Mordenti A, Palmonari A, Brogna N, Canestrari G, Belloni P, Cavallini D, Mammi L, Cabbri R, Formigoni A. 2019. NIRs calibration models for chemical composition and fatty acid families of raw and freeze-dried beef: a comparison. J Food Compost Anal. 83:103257.
- Givens DI, De Boever JL, Deaville ER. 1997. The principles, practices and some future applications of near infrared spectroscopy for predicting the nutritive value of foods for animals and humans. Nutr Res Rev. 10(1):83–114.
- Heinrichs AJ, Heinrichs BS, Cavallini D, Fustini M, Formigoni A. 2021. Limiting total mixed ration availability alters eating and rumination patterns of lactating dairy cows. JDS Commun. 2(4):186–190.
- Heinrichs J. 2013. The Penn state particle separator. DSE 2013-186. University Park, PA: Department of Animal Science, The Pennsylvania State University; p. 16802–16808.
- Hoffman PC, Brehm NM, Bauman LM, Peters JB, Undersander DJ. 1999. Prediction of laboratory and in situ protein fractions in legume and grass silages using near-infrared reflectance spectroscopy. J Dairy Sci. 82(4):764–770.
- Humer E, Petri RM, Aschenbach JR, Bradford BJ, Penner GB, Tafaj M, Südekum K-H, Zebeli Q. 2018. Invited review: practical feeding management recommendations to mitigate the risk of subacute ruminal acidosis in dairy cattle. J Dairy Sci. 101(2):872–888.
- Johnson JR, Carstens GE, Prince SD, Ominski KH, Wittenberg KM, Undi M, Forbes TDA, Hafla AN, Tolleson DR, Basarab JA. 2017. Application of fecal near-infrared reflectance spectroscopy profiling for the prediction of diet nutritional characteristics and voluntary intake in beef cattle. J Anim Sci. 95(1):447–454.
- Karande AD, Liew CV, Heng PWS. 2010. Calibration sampling paradox in near infrared spectroscopy: a case study of multi-component powder blend. Int J Pharm. 395(1-2):91–97.
- Lin LI-K. 1989. A concordance correlation coefficient to evaluate reproducibility. Biometrics. 45(1):255–268.
- Lundberg KM, Hoffman PC, Bauman LM, Berzaghi P. 2004. Prediction of forage energy content by near infrared reflectance spectroscopy and summative equations. Prof Anim Sci. 20(3):262–269.
- Mammi LME, Palmonari A, Fustini M, Cavallini D, Canestrari G, Chapman JD, McLean DJ, Formigoni A. 2018. Immunomodulant feed supplement to support dairy cows health and milk quality evaluated in Parmigiano Reggiano cheese production. Anim Feed Sci Technol. 242:21–30.
- Manuelian CL, Currò S, Visentin G, Penasa M, Cassandro M, Dellea C, Bernardi M, De Marchi M. 2017. Technical note: at-line prediction of mineral composition of fresh cheeses using near-infrared technologies. J Dairy Sci. 100(8):6084–6089.
- Mentink RL, Hoffman PC, Bauman LM. 2006. Utility of near-infrared reflectance spectroscopy to predict nutrient composition and in vitro digestibility of total mixed rations. J Dairy Sci. 89(6):2320–2326.
- Mertens DR, Allen M, Carmany J, Clegg J, Davidowicz A, Drouches M, Frank K, Gambin D, Garkie M, Gildemeister B, et al. 2002. Gravimetric determination of amylase-treated neutral detergent fiber in feeds with refluxing in beakers or crucibles. J AOAC Int. 85:1217–1240.
- Mordenti AL, Brogna N, Formigoni A. 2017. Review: the link between feeding dairy cows and Parmigiano-Reggiano cheese production area. Prof Anim Sci. 33(5):520–529.
- Naes T, Isaksson T, Fearn T, Davies T. 2002. A user-friendly guide to multivariate calibration and classification. Chichester UK: NIR Publications.
- Nousiainen J, Ahvenjarvi S, Rinne M, Hellamaki M, Huhtanen P. 2004. Prediction of indigestible cell wall fraction of grass silage by near infrared reflectance spectroscopy. Anim Feed Sci Technol. 115(3–4):295–311. https://doi.org/https://doi.org/10.1016/j.anifeedsci.2004.03.004.
- Palmonari A, Canestrari G, Bonfante E, Fustini M, Mammi L, Formigoni A. 2017. Technical note: in vitro digestibility of amylase-treated, ash-corrected neutral detergent fiber, with addition of sodium sulfite, at 240 hours with or without rumen fluid reinoculation. J Dairy Sci. 100(2):1200–1202.
- Palmonari A, Fustini M, Canestrari G, Grilli E, Formigoni A. 2014. Influence of maturity on alfalfa hay nutritional fractions and indigestible fiber content. J Dairy Sci. 97(12):7729–7734.
- Palmonari A, Gallo A, Fustini M, Canestrari G, Masoero F, Sniffen CJ, Formigoni A. 2016. Estimation of the indigestible fiber in different forage types. J Anim Sci. 94(1):248–254. https://doiorg/102527/jas2015-9649.
- Plaizier JC, Krause DO, Gozho GN, McBride BW. 2008. Subacute ruminal acidosis in dairy cows: the physiological causes, incidence and consequences. Vet J. 176(1):21–31.
- Reeves JB. 1994. Use of near infrared reflectance spectroscopy as a tool for screening treated forages and by-products. J Dairy Sci. 77(4):1030–1037.
- Righi F, Simoni M, Visentin G, Manuelian CL, Currò S, Quarantelli A, De Marchi M. 2017. The use of near infrared spectroscopy to predict faecal indigestible and digestible fibre fractions in lactating dairy cattle. Livest Sci. 206:105–108.
- Shenk JS, Westerhaus MO. 1994. The application of near infrared reflectance spectroscopy (NIRS) to forage analysis. In: Fahey Jr. GC, editor. Forage quality, evaluation, and utilization. Madison (WI): Soil Science Society of America/American Society of Agronomy/Crop Science Society of America; p. 406–449.
- Shenk JS, Westerhaus MO. 1996. Calibration the ISI way. In: Davies AMC, Williams PC, editors, Near infrared spectroscopy: the future waves. Chichester, UK: NIR Publications; p. 198–202.
- Simoni M, Goi A, De Marchi M, Righi F. 2021. The use of visible/near-infrared spectroscopy to predict fibre fractions, fibre-bound nitrogen and total-tract apparent nutrients digestibility in beef cattle diets and faeces. Ital J Anim Sci. 20(1):814–825.
- Visentin G, McDermott A, McParland S, Berry DP, Kenny OA, Brodkorb A, Fenelon MA, Marchi MD. 2015. Prediction of bovine milk technological traits from mid-infrared spectroscopy analysis in dairy cows. J Dairy Sci. 98(9):6620–6629.
- Visentin G, Niero G, Berry DP, Costa A, Cassandro M, De Marchi M, Penasa M. 2019. Genetic (co)variances between milk mineral concentration and chemical composition in lactating Holstein-Friesian dairy cows. Animal. 13(3):477–486.
- White M, Rouvinen-Watt K. 2004. Near-infrared evaluation of wet mink diets. Anim Feed Sci Technol . 111(1–4):239–246.
- Wiedemair V, Langore D, Garsleitner R, Dillinger K, Huck C. 2019. Investigations into the performance of a novel pock-et-sized near-infrared spectrometer for cheese analysis. Molecules. 24(3):428.
- Williams P. 2004. Near-infrared technology – getting the best out of light: a short course in the practical implementation of near-infrared spectroscopy for the user. 2nd ed. North Ryde, N.S.W: Value Added Wheat CRC.
- Zebeli Q, Metzler-Zebeli BU. 2012. Interplay between rumen digestive disorders and diet-induced inflammation in dairy cattle. Res Vet Sci. 93(3):1099–1108.