
 ?Mathematical formulae have been encoded as MathML and are displayed in this HTML version using MathJax in order to improve their display. Uncheck the box to turn MathJax off. This feature requires Javascript. Click on a formula to zoom.
Abstract
The aims of this study were to estimate the effect of cow breed on milk protein profile, and to assess the relationship between protein profile and milk coagulation properties (MCP) predicted with mid-infrared spectroscopy (MIRS). The dataset included 173,841 test-day observations of 12,533 specialised (Holstein-Friesian [HF] and Brown Swiss [BS]) and dual-purpose cows (Simmental [SI] and Alpine Grey) sampled in 488 multi-breed herds. Fixed effects considered in the mixed model were breed, month of sampling, parity class, stage of lactation, and first-order interactions and random effects were cow nested within breed, herd and the residual. BS had the greatest casein (CN) fractions content and SI the greatest whey fractions content. A lesser clear pattern was observed when considering the proportion of protein fractions. Longer rennet coagulation, longer curd-firming time and firmer curd were observed for Alpine Grey, HF and BS, respectively. Regarding the index of milk aptitude to coagulate (IAC), BS and SI had the greatest value and HF and Alpine Grey (AG) the lowest one. Weak relationships were estimated between protein fractions and MCP. For whey proteins, all the analysed traits were optimised at β-lactoglobulin (β-LG) concentrations next to the maximum of the physiological range and at α-lactalbumin (α-LA) concentrations at the minimum level. For CNs, all the analysed traits were optimised at α-CN and β-CN concentrations closer to the minimum level and at κ-CN concentration at intermediate levels. Results highlighted the lower efficiency of HF milk for cheese manufacturing compared to the other breeds.
Breed, month of sampling, parity order, stage of lactation and their interactions were important to explain the variability of milk protein fractions and coagulation traits.
Brown Swiss (BS) had the greatest casein (CN) fractions content and Simmental (SI) the greatest whey fractions content. Longer rennet coagulation was observed for Alpine Grey, whereas firmer curd was observed for BS.
Coagulation properties were optimised in milk with low concentration of α-CN and β-CN and for intermediate levels of κ-casein.
Highlights
Introduction
Milk proteins are important for human nutrition, both for their high biological value and their role as precursors of bioactive proteins and peptides. Milk proteins are known for their antimicrobial and immunomodulatory role and for facilitating absorption of nutrients (Haug et al. Citation2007; Lisson et al. Citation2013). Moreover, milk protein profile influences milk coagulation properties (MCP). Several authors have reported that an increase of some casein (CN) fractions content reduces rennet coagulation time (RCT), and increase curd firmness (Vallas et al. Citation2012; Poulsen et al. Citation2013) and acid coagulation properties (Ketto et al. Citation2017).
About 80% of milk proteins are CNs, classified as αS1-CN, αS2-CN, β-CN and κ-CN, and the remaining 20% are whey proteins, mainly β-lactoglobulin (β-LG) and α-lactalbumin (α-LA). However, milk protein composition differs among individuals (Ketto et al. Citation2017; Franzoi et al. Citation2019) and breeds (Haug et al. Citation2007), and one of the factors associated with differences among individuals are milk protein polymorphisms (Ketto et al. Citation2017). The effect of breed on milk protein fraction content has been reported in Estonian Red and Estonian Holstein cattle, with the former having greater β-LG, αS2-CN and κ-CN content than the latter (Jõudu et al. Citation2008). Nevertheless, the reference method to determine milk protein fractions (high-performance liquid chromatography), is expensive and time consuming, and thus it does not allow large-scale phenotyping.
In the last years, mid-infrared spectroscopy (MIRS) has shown its potential as rapid and cost-effective tool to analyse milk quality traits at population level (De Marchi et al. Citation2014). Although the development of accurate prediction models for protein fractions is quite challenging (Rutten et al. Citation2011; De Marchi et al. Citation2014), they can be enhanced through a novel chemometric approach using uninformative variable elimination applied to milk mid-infrared spectral wavelengths, as proposed by Niero, Penasa, et al. (Citation2016). The application of those improved models to historical test-day spectra for a posteriori prediction in multi-breed herds opens new opportunities to evaluate breed differences in terms of milk protein fractions, which is of interest for the dairy industry to increase processing efficiency and develop new functional products.
In the multifaceted scenario of cattle farming, multibreed dairy herds take on a particular interest, especially thanks to their potential performance in terms of milk production, animal reproduction and concentrate-conversion efficiency compared to single breed herds (Magne et al. Citation2016). Moreover, a complementarity occurs between lactation performances of breeds with diverse dairy aptitude (Magne et al. Citation2016) and such differences may also play a key role in the view of a sustainable livestock systems (Dumont et al. Citation2014).
Therefore, the aim of this study was to estimate sources of variation of milk protein profile of Holstein-Friesian (HF), Brown Swiss (BS), Simmental (SI) and Alpine Grey (AG) cows farmed in multi-breed herds, and to assess its relationship with MCP using data predicted with MIRS.
Materials and methods
Data origin
Information on individual cow milk samples from routine cow milk testing was provided by the Breeders Association of Bolzano province (Bolzano, Italy) and the South Tyrolean Dairy Association (Bolzano, Italy). Due to the orography of this mountainous province of the Italian Alps, farms in Bolzano area are characterised by small herd size (15 cows per herd on average) and cows fed with forage or hay and concentrates, and part of individuals are moved to highland pastures during summer season. The study involved two specialised dairy breeds, HF and BS and two dual-purpose breeds, SI and AG, farmed in multi-breed herds from 2011 to 2019. Data included milk yield (MY, kg/d), somatic cell count (SCC, cells/µL), fat, crude protein (CP), CN and lactose percentage, milk urea content (MU, mg/dL) pH and spectral information. Each cow was evaluated every 4 or 5 weeks, and individual milk samples (50 mL) added with 200 µL of preservative (Bronysolv; ANA.LI.TIK Austria, Vienna, Austria) were collected and analysed for milk quality traits in the laboratory of the South Tyrolean Dairy Association following the guidelines of the International Committee for Animal Recording. The SCC was measured with Cell Fossomatic (FOSS Electric A/S, Hillerød, Denmark) and transformed to somatic cell score (SCS) as SCS = log2(SCC/100) + 3 (Wiggans and Shook Citation1987) to normalise the distribution of the data. Until February 2017, milk fat, CP, CN and lactose percentage and MU content were analysed with MilkoScan FT6000 (Foss, Hillerød, Denmark), and from March 2017 onwards with MilkoScan FT7 (Foss, Hillerød, Denmark). According to the manufacturer instructions, MilkoScan instruments were standardised to ensure the comparability of the collected spectra (Feudale et al. Citation2002; Juhl Citation2017).
Prediction models (g/100 mL) for α-CN, i.e. the sum of αS1- and αS2-CN, β-CN, κ-CN, β-LG and α-LA developed by Niero, Penasa, et al. (Citation2016) were used. Briefly, prediction models were built using partial least squares regression analysis after an uninformative variable elimination procedure and validated through leave-one-out cross-validation, matching the spectra with reference chromatographic analysis performed on 114 individual milk samples which were collected in the same region of this study. Coefficient of determination in cross-validation (root mean square error in cross-validation) were 0.88 (1.05 mg/mL) for α-CN, 0.60 (0.53 mg/mL) for β-CN, 0.74 (0.88 mg/mL) for κ-CN, 0.47 (1.10 mg/mL) for β-LG and 0.37 (0.10 mg/mL) for α-LA. In this study, predicted protein fractions were expressed also as percentage of CP (%).
MCP, including RCT (min), curd-firming time (k20, min) and curd firmness 30 min after rennet addition (a30, mm) were predicted using models developed by Visentin et al. (Citation2016). As for milk proteins, partial least squares regression analysis after an uninformative variable elimination procedure was used. The models were built in a calibration set (80% of the samples) and externally validated by applying the model to the remaining 20% of samples. The reference analysis to determine MCP was carried out using the Formagraph (Foss, Hillerød, Denmark). Coefficients of determination in cross-validation (root mean square error in cross-validation) were 0.55 (2.86 min), 0.59 (1.00 min) and 0.56 (8.43 mm) for RCT, k20 and a30, respectively (Visentin et al. Citation2016). Moreover, the index of milk aptitude to coagulate (IAC) was estimated according to Penasa et al. (Citation2015).
Data editing
Data were edited following the approach of Manuelian, Penasa, Visentin, Zidi, et al. (Citation2018) for mineral composition of cow milk from multi-breed herds. The original dataset (n = 2,760,766) was edited to retain records of purebred BS, HF, SI and AG cows of parity 1–12, between 5 and 305 days in milk (DIM), from cows that did not change herd during their productive life-cycle. Age at calving was checked to ensure consistency within parity order of the animal and cows whose age at calving deviated more than three standard deviations from the respective breed parity mean were discarded from the dataset. Records for the other investigated traits that deviated more than three standard deviations from the respective mean within each breed were treated as missing values. Contemporary groups were defined as cows tested in the same herd and date (herd-test-date, HTD) and HTD with less than 3 animals and cows with less than three observations within lactation were removed. Only records from herds with 2, 3 or 4 breeds and breed combinations present in more than 2 herds were kept, with each breed representing at least 10% of the herd. After editing, 173,841 observations of 12,533 cows in 489 multi-breed herds were available for further analyses. Parity, DIM and herd size averaged 2.80 ± 1.73, 152.16 ± 82.81 d and 25.68 ± 16.74 cows (range: 6–157), respectively. Detailed number of herds and cows involved in the study and relative number of records included in the dataset is reported in Table .
Table 1. Number (frequency between brackets) of herds and cows involved in the study, and number of records (frequency between brackets) within herd and breeds.
Statistical analysis
MY, composition, SCS, MU, protein fractions, MCP and IAC were analysed through a linear mixed model using HPMIXED procedure of SAS version 9.4 (SAS Institute Inc., Cary, NC). The model was:
where yijklmn is the dependent variable; µ is the overall intercept of the model; Bi is the fixed effect of the ith breed (i = HF, BS, AG, SI); Mj is the fixed effect of the jth month of sampling (j = 1–12); Sk is the fixed effect of the kth class of stage of lactation (k = 1–30, each class being 10 DIM wide); Pl is the fixed effect of the lth parity class (l = 1–5, with the last including parities ≥ 5); (B × M)ij is the fixed interaction effect between breed and month of sampling; (B × S)ik is the fixed interaction effect between breed and stage of lactation; (B × P)il is the fixed interaction effect between breed and parity; (S × P)kl is the fixed interaction effect between class of stage of lactation and parity class; Hm is the random effect of the mth herd (m = 1–488); Cn(Bi) is the random effect of the nth cow nested within the ith breed (n = 1–12,533)∼N(0,σ2C(B)), where σ2C(B) is the cow nested within breed variance; and eijklmn is the random residual ∼N(0,σ2e), where σ2e is the residual variance. Multiple comparisons of least square means were performed for the main effects of breed, parity class and class of stage of lactation using Tukey–Kramer adjustment. Pearson correlations between the investigated traits and studentised residuals were assessed using the CORR procedure of SAS. Significance was set at p < .01, unless otherwise stated.
In order to investigate the effect of protein fractions on MCP, a second linear mixed model was run including protein fractions, i.e. α-CN, β-CN, κ-CN, α-LA and β-LG expressed as % of CP, as first, second and third order covariates. Obtained regression coefficients for protein fractions were used to perform a Lagrange optimisation using MCP and IAC as dependant variables, regression coefficients from previous linear mixed model, and protein fractions relative content as independent variables. Optimisation was constrained for single protein content to be in the physiological range and the sum of all protein fractions to be equal to 1 (Madoumier et al. Citation2019).
Results and discussion
Descriptive statistics and significance of fixed effects
Descriptive statistics for MY, chemical composition, SCS, MU, detailed protein composition and MCP are summarised in Table . Protein fractions predicted by MIRS were characterised by low to moderate coefficient of variation (CV), similarly to the variation reported by Niero, Penasa, et al. (Citation2016) in single-breed herds located in the same region. Means of RCT, k20 and a30 were 21.64, 5.71 min and 16.75 mm, respectively, and the latter exhibited the largest variability among MCP (CV = 59.48%). Average values of RCT and k20 were greater than those reported by Visentin et al. (Citation2016) from single-breed herds sampled in the same region and measured using the Formagraph. As a consequence, a30 was higher in the aforementioned study compared to present result which indeed is focussed on multi-breed herds. On the contrary, IAC showed the lowest CV (4.48%) among all the studied traits.
Table 2. Number of test day records, mean, standard deviation (SD), range and coefficient of variation (CV) for milk yield, composition, somatic cell score, urea, detailed protein composition and coagulation properties.
The statistical analysis revealed that fixed effects considered in the model were all significant in explaining the variation of MY, milk composition, pH, SCS, MU, protein fractions, MCP and IAC (Table ). However, this was somewhat expected due to the large number of observations included in the dataset and confirmed previous results obtained in single-breed herds of the same area (Franzoi et al. Citation2019). Focussing on the proportion of CN fractions expressed as % CP, month of sampling showed the highest F-value for α-CN, while parity had the highest influence on β-CN and κ-CN. Among whey proteins, β-LG was mostly influenced by cow breed and month of sampling, while α-LA was mostly influenced by stage of lactation. Considering protein fractions expressed in g/100 mL of milk, a large proportion of α-CN and β-CN variability was explained by stage of lactation, similarly to CP. On the other hand, parity had the strongest effect on κ-CN. These results suggest different determinants in the variability among CNs. Finally, month of sampling had the strongest effect on whey protein fractions. In Burlina cattle (Niero, Visentin, et al. Citation2016), stage of lactation explained a larger proportion of β-CN and κ-CN variability than parity; instead, variability of α-CN was explained in a higher proportion by parity effect compared to the stage of lactation. Taking into account MCP, the most significant effect for RCT and IAC was stage of lactation, while breed was the most significant effect for a30 and k20. These results partially agreed with those reported in Rendena and HF cows (Varotto et al. Citation2015), where breed was the most significant effect for RCT and a30. In general, for most of the analysed traits, the random effect of cow explained greater proportion of variability of the investigated traits compared to the random effect of herd, with values that ranged from 14.80% for MU to 44.59% for β-CN. The only exceptions were MY and MU, for which herd effect explained 34.79 and 22.63% of total variance, respectively.
Table 3. F-values of fixed effects of breed (B), month of sampling (M), parity order (P), stage of lactation (S) and their first-order interactions and percentage of total variance explained by random effects of herd, cow nested within breed and residual for milk yield, composition, somatic cell score, urea, detailed protein composition and coagulation properties.
Breed effect
In line with Penasa et al. (Citation2014), HF breed was endowed with the greatest MY (29.37 kg/d), followed by SI (25.67 kg/d), BS (25.16 kg/d) and AG (20.79 kg/d) breeds (Table ). BS had greater fat, CP and CN percentages and MU content than other breeds. The lowest SCS was estimated for SI cows. Overall, protein fractions varied significantly across breeds. BS registered the greatest values for all CN groups. Aside from being the highest yielding animals, HF cows had the lowest content of CN fractions, probably due to a dilution effect as reported by Franzoi et al. (Citation2019). Such a lower CP and CN content in HF milk is also in agreement with the lower amount of Ca, Mg and P observed by Manuelian, Penasa, Visentin, Zidi, et al. (Citation2018), due to the positive correlation between minerals and CN micelles (0.23–0.53; p < .05; Toffanin et al. Citation2015). As regard protein fractions expressed as proportion of CP, SI breed had the greatest content of α-CN, whereas milk of BS and AG breed were the richest in β-CN and κ-CN, respectively (p<.05). Milk of HF cows had the greatest content of β-LG and α-LA (9.74 and 2.33% of CP, respectively), whereas BS had the lowest one (7.91 and 2.07% of CP, respectively; p<.05). Breed differences in milk protein profile have been reported also by Gustavsson et al. (Citation2014), who considered Swedish Red, Danish Holstein and Danish Jersey cows, and by Franzoi et al. (Citation2019), who considered HF, BS and SI cows farmed in single-breed herds.
Table 4. Least squares means (standard error) of milk yield, composition, somatic cell score, urea, detailed protein composition and coagulation properties.
To the authors’ knowledge, no studies have attempted to estimate breed differences for detailed protein composition predicted by MIRS in multi-breed herds, especially on a large scale. Previous literature focussed on single breeds and on a relatively low number of animals, which were characterised for detailed protein profile through capillary zone electrophoresis technique (Schopen et al. Citation2009) or high pressure liquid chromatography technique (Cipolat-Gotet et al. Citation2018). Bonfatti et al. (Citation2017) investigated milk protein composition using phenotypes predicted from a large spectra database of Italian SI cows, and Franzoi et al. (Citation2019) studied the phenotypic variation of predicted protein profile of BS, HF, SI, AG and Pinzgauer cows using data from single-breed herds.
Our results indicated that the four breeds were rather similar in terms of predicted RCT which was the shortest for SI cows (21.32 min) and the longest for AG cows (21.82 min), predicted k20 which ranged from 5.28 min (BS) to 6.49 min (HF) and predicted IAC which was slightly higher in SI and BS than HF and AG. Compared to the other breeds, BS and HF cows showed the greatest (17.76 mm) and the lowest a30 (14.15 mm). Moreover, the lower MY and more favourable MCP of BS than in HF is in agreement with findings of Penasa et al. (Citation2014). However, it is worthwhile to note that prediction models used in this study were characterised by moderate accuracy, as evidenced by the coefficient of determination reported by Niero, Penasa, et al. (Citation2016) for detailed milk protein composition, and by Visentin et al. (Citation2016) for MCP.
Lactation and parity effects
Figure depicts the least squares means of predicted protein composition across stage of lactation for BS, HF, AG and SI. Protein fractions expressed as g/100 mL of milk had the same trend for all the studied breeds. In particular, α-CN, κ-CN and β-LG had greater concentration at the beginning of lactation, a swift decline close to the peak of lactation, and a constant increase towards late lactation stages. Such a variation is in agreement with previous authors who reported that the trend of milk protein fractions over lactation is opposite to the trend of MY (McDermott et al. Citation2017; Franzoi et al. Citation2019), again confirming the hypothesis of a dilution effect. This was observed also in the case of milk constituents other than protein fractions, with particular regard to major milk minerals (Manuelian, Penasa, Visentin, Zidi, et al. Citation2018; Visentin et al. Citation2018). The specific pattern (Figure ) of milk protein profile along with the variation of major milk minerals across lactation (Visentin et al. Citation2018) may explain the observed trend of MCP, which corroborates with Penasa et al. (Citation2014), i.e. shorter RCT and greater a30 at the onset of milk production. The trend of α-CN, κ-CN and β-LG was only partially mimicked by β-CN, which showed similar concentration at the beginning and at the peak of lactation, and by α-LA, which maintained constant concentration after the peak MY.
Figure 1. Least squares mean of (A) α-casein (α-CN), (B) β-casein (β-CN), (C) κ-casein (κ-CN), (D) β-lactoglobulin (β-LG) and (E) α-lactalbumin (α-LA) across stage of lactation for Brown Swiss (![]()
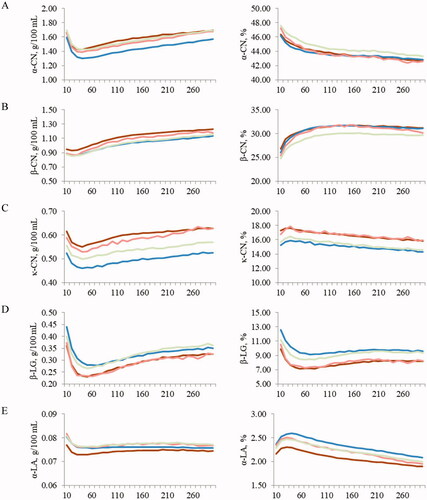
Protein fractions expressed as percentage of CP showed different patterns, with α-CN declining constantly across lactation, while β-CN had a sharp increase up to mid-lactation to subsequently plateau. The κ-CN and α-LA fractions peaked between the first and second month of lactation and declined thereafter. Finally, β-LG had a nadir in the early lactation stages and slightly recovered towards late stages. The specific composition in terms of milk protein fractions across lactation likely reflects calf’s nutritional needs and cow’s physiological requirements. On one hand, a greater proportion of β-LG in early lactation could be linked with the biological function of this protein fraction in calves, due to its capacity to enhance the absorption of hydrophobic ligands such as retinol and fatty acids (Zhang et al. Citation2015). On the other hand, decreased proteins related to milk component synthesis, such as α-LA in late lactation can be associated with the protection of the mammary gland during the involution process (Zhang et al. Citation2015).
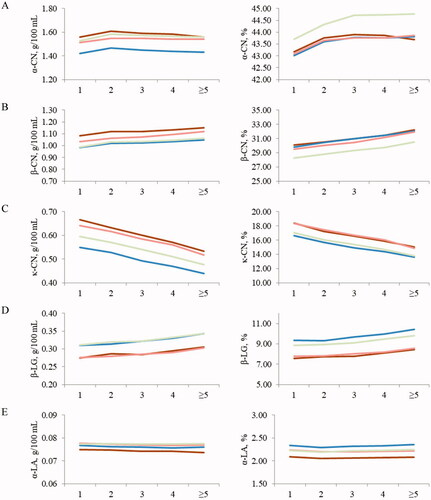
Trends of predicted protein fractions across parity for BS, HF, AG and SI are depicted in Figure . Among CN fractions, both κ-CN expressed as g/100 mL of milk and κ-CN measured as proportion of CP showed decreasing trend in later parities. An opposite trend was observed for β-CN fraction. As for whey protein fractions, β-LG expressed as g/100 mL increased in older cows, and this trend was confirmed also when considering the same protein measured on CP basis.
Figure 2. Least squares mean of (A) α-casein (α-CN), (B) β-casein (β-CN), (C) κ-casein (κ-CN), (D) β-lactoglobulin (β-LG) and (E) α-lactalbumin (α-LA) across parity class for Brown Swiss (![]()
Associations between protein fractions and MCP
Pearson correlation coefficients estimated from raw data are presented in Table (above the diagonal). Within protein fractions, correlations were moderate to low. The strongest associations were assessed between κ-CN and β-LG (−0.56) and between β-LG and α-LA (0.48), whereas almost null correlation was estimated between β-CN and κ-CN. These results are not fully in agreement with McDermott et al. (Citation2016) who reported positive correlations between milk protein fractions in different cow breeds (HF, Jersey, Norwegian Red and crossbreds) that ranged from 0.32 (β-LG-B and αs1-CN) to 0.92 (β-LG-A and κ-CN).
Table 5. Pearson correlation coefficients for protein fractions (measured as % of crude protein) and milk coagulation properties.
Correlations of protein fractions with MCP and IAC were weak, from −0.24 (κ-CN and IAC) to 0.23 (β-LG and IAC). Close to null or null correlations were observed between α-CN and a30, α-CN and IAC, α-LA and a30 and α-LA and IAC. Positive and low correlations were estimated between RCT and CN fractions content; this was somehow expected, since greater CN content is likely to increase RCT due to the higher ratio of substrate available for rennet proteolysis. Overall, such rather weak relationships might be partly argued considering that models used for the prediction of MCP are based on 30 min of lactodynamographic assays, which were taken as reference measurements. In this view, curd of the late-coagulating samples may have had not enough time to develop, thus providing only a limited description of the potential gel firmness (Niero et al. Citation2018). Weak to moderate correlations between MCP and protein fractions were also reported by McDermott et al. (Citation2016). Moreover, a significant effect of total αs1-CN, β-CN and β-LG content on RCT milk from Estonian Red, Red-and-White Holstein and Estonian Holstein was observed by Jõudu et al. (Citation2008). In addition to those protein fractions, total amount of κ-CN also affects a30 (Jõudu et al. Citation2008).
Mild to strong correlations were observed between MCP, and between MCP and IAC, with positive associations ranging from 0.39 (RCT and k20) to 0.94 (a30 and IAC), and negative associations ranging from −0.54 (k20 and a30) to −0.93 (RCT and IAC). Those correlations are in agreement with the studies conducted in HF, BS, SI, AG (Visentin et al. Citation2018) and Pinzgauer (Manuelian, Penasa, Visentin, Cassandro, et al. Citation2018) single-breed herds in Bolzano province.
Pearson correlation coefficients calculated from the residuals (Table , below the diagonal) estimated by the model were generally stronger than those estimated from raw data. Within protein fractions, the strongest associations were estimated between κ-CN and β-LG (−0.61), in a way that greater content of CN fraction hampered that of whey protein fraction, and between β-LG and α-LA (0.28), in a way that greater content of a fraction mutually enhanced the other. Correlations of the residuals between protein fractions and MCP indicate that CN fractions were positively associated with RCT, whereas whey fractions were negatively associated, despite a close to zero correlation between α-LA and RCT (−0.03). The β-CN and κ-CN fractions were negatively associated to a30 (−0.22 and −0.16, respectively) and IAC (−0.20 and −0.25, respectively). Within milk coagulation traits, a strong and positive association between a30 and IAC (0.96) and a strong negative correlation between RCT and IAC (−0.90) were estimated.
Covariances between protein fractions and MCP
In order to further investigate the effect of protein fractions on MCP and IAC, a linear mixed model was fitted with protein fractions as covariates up to third order. Obtained coefficients were used to perform a constrained Lagrange optimisation, with the aim to identify protein composition optimising MCP and IAC (Table ). The proportion of α-CN optimising MCP and IAC was similar for all the analysed traits ranging from 35.96% for k20 to 39.97% for IAC. On the other hand, remarkable differences were found for β-CN concentrations, with lower values optimising k20 (16.20%) and higher values optimising RCT (24.30%). On the opposite, k20 was optimised at higher κ-CN concentrations (27.67%), while RCT was minimised at lower κ-CN concentrations (16.68%). In general, a30 was mostly maximised at intermediate values compared to concentration optimising RCT and k20. This was expected considering that a30 is both linked to RCT and k20.
Table 6. Results from Lagrange constrained optimisation of protein relative concentration for milk coagulation properties and index of milk aptitude to coagulate.
Taking into account whey proteins, all the analysed traits were optimised at β-LG concentrations next to the maximum of the physiological range. This could be surprising, considering β-LG is a whey protein, usually considered not playing an important role in milk technological characteristics. Nevertheless, it was previously demonstrated that spiking raw milk with 0.2% β-LG had favourable effect on RCT. At the same time, the effect of increasing β-LG concentration was detrimental after heating milk (Kannan and Jennes Citation1961). This is in accordance with findings reporting β-LG interacts with κ-CN, in particular after heat treatments (Imafidon et al. Citation1991). Similarly, Abeykoon et al. (Citation2016) reported a favourable significant correlation between β-LG relative content and RCT in individual milk samples from different breeds. On the contrary, α-LA optimised MCP and IAC at its lower physiological limit (1.39%). This evidence could be linked to chelating effect of α-LA on divalent cations (mainly Ca and Zn) involved in paracasein reticulum formation (Lönnerdal and Lien Citation2003).
Conclusions
Our results demonstrated that breed, month, parity, stage of lactation and first-order interactions were important contributors to milk protein fractions and coagulation traits. BS and SI had the greatest total amount of CN and whey fractions, respectively. However, a lesser clear pattern was observed when considering the distribution of the protein fractions within total CP. The greatest RCT, k20 and a30 was obtained for AG, HF and BS, respectively. Moreover, two groups of breeds were observed when looking at the IAC; BS and SI had the greatest value, whereas HF and AG the lowest one. Weak relationships were assessed between protein fractions and MCP. For whey proteins, all the analysed traits were optimised at β-LG concentrations next to the maximum of the physiological range and at α-LA concentrations at the minimum level. For CN proteins, all the analysed traits were optimised at α-CN and β-CN concentrations closer to the minim level, and at κ-CN concentration at intermediate levels. Results highlighted the lower efficiency of HF milk for cheese manufacturing compared to other breeds, even if reared in multi-breed herds. Nevertheless, it is well established that HF cows represent a fundamental resource for farmers and herds profitability, mainly due to their high genetic merit and great MY; in this light, future research is needed to evaluate how and to which extent specialised dairy breeds should be included in respect to dual purpose, and to define optimal breed herd composition within the context of cheese manufacturing.
Ethical approval
Procedures adopted in this study do not fall into the scope of an animal ethics evaluation, as they do not reach the thresholds established in the ‘Directive 2010/63/EU (Art. 1) of the European Parliament and of the council of 22 September 2010 on the protection of animals used for scientific purposes’.
Acknowledgements
The authors gratefully thank the South Tyrolean Dairy Association (Bolzano, Italy) and the Breeders Association of Bolzano province (Bolzano, Italy) for providing the data used in the study.
Disclosure statement
No potential conflict of interest was reported by the author(s).
Data availability statement
None of the data were deposited in an official repository. The data that support the findings presented in this study are available from the first author or corresponding author upon reasonable request.
Additional information
Funding
References
- Abeykoon CD, Rathnayake RMC, Johansson M, Silva GLLP, Ranadheera CS, Lundh Å, Vidanarachchi JK. 2016. Milk coagulation properties and milk protein genetic variants of three cattle breeds/types in Sri Lanka. Procedia Food Sci. 6:348–351.
- Bonfatti V, Vicario D, Lugo A, Carnier P. 2017. Genetic parameters of measures and population-wide infrared predictions of 92 traits describing the fine composition and technological properties of milk in Italian Simmental cattle. J Dairy Sci. 100(7):5526–5540.
- Cipolat-Gotet C, Cecchinato A, Malacarne M, Bittante G, Summer A. 2018. Variations in milk protein fractions affect the efficiency of the cheese-making process. J Dairy Sci. 101(10):8788–8804.
- De Marchi M, Toffanin V, Cassandro M, Penasa M. 2014. Invited review: mid-infrared spectroscopy as phenotyping tool for milk traits. J Dairy Sci. 97(3):1171–1186.
- Dumont B, González-García E, Thomas M, Fortun-Lamothe L, Ducrot C, Dourmad JY, Tichit M. 2014. Forty research issues for the redesign of animal production systems in the 21st century. Animal. 8(8):1382–1393.
- Feudale RN, Woody NA, Tan H, Myles AJ, Brown SD, Ferré J. 2002. Transfer of multivariate calibration models: a review. Chemom Intell Lab Syst. 64(2):181–192.
- Franzoi M, Niero G, Visentin G, Penasa M, Cassandro M, De Marchi M. 2019. Variation of detailed protein composition of cow milk predicted from a large database of mid-infrared spectra. Animals. 9(4):176.
- Gustavsson F, Buitenhuis AJ, Johansson M, Bertelsen HP, Glantz M, Poulsen NA, Lindmark Mansson H, Stalhammar H, Larsen LB, Bendixen C, et al. 2014. Effects of breed and casein genetic variants on protein profile in milk from Swedish Red, Danish Holstein, and Danish Jersey cows. J Dairy Sci. 97(6):3866–3877.
- Haug A, Høstmark AT, Harstad OM. 2007. Bovine milk in human nutrition-a review. Lipids Health Dis. 6:25.
- Imafidon GI, Ng-Kwai-Hang KF, Harwalkar VR, Ma CY. 1991. Effect of genetic polymorphism on the thermal stability of β-lactoglobulin and κ-casein mixture. J Dairy Sci. 74(6):1791–1802.
- Jõudu I, Henno M, Kaart T, Püssa T, Kärt O. 2008. The effect of milk protein contents on the rennet coagulation properties of milk from individual dairy cows. Int Dairy J. 18(9):964–967.
- Juhl HV. 2017. Method for compensating amplitude drift in a spectrometer and spectrometer performing said method [Internet]. [accessed 2018 Jun 1]. https://patents.google.com/patent/US9606050/en?oq=Method+of+standardizing+a+spectrometer.
- Kannan A, Jenness R. 1961. Relation of milk serum proteins and milk salts to the effects of heat treatment on rennet clotting. J Dairy Sci. 44(5):808–822.
- Ketto IA, Knutsen TM, Øyaas J, Heringstad B, Ådnøy T, Devold TG, Skeie SB. 2017. Effects of milk protein polymorphism and composition, casein micelle size and salt distribution on the milk coagulation properties in Norwegian Red cattle. Int Dairy J. 70:55–64.
- Lisson M, Lochnit G, Erhardt G. 2013. Genetic variants of bovine β- and κ-casein result in different immunoglobulin E-binding epitopes after in vitro gastrointestinal digestion. J Dairy Sci. 96(9):5532–5543.
- Lönnerdal B, Lien EL. 2003. Nutritional and physiologic significance of alpha-lactalbumin in infants . Nutr Rev. 61(9):295–305.
- Madoumier M, Trystram G, Sébastian P, Collignan A. 2019. Towards a holistic approach for multi-objective optimization of food processes: a critical review. Trends Food Sci Technol. 86:1–15.
- Magne MA, Thénard V, Mihout S. 2016. Initial insights on the performances and management of dairy cattle herds combining two breeds with contrasting features. Animal. 10(5):892–901.
- Manuelian CL, Penasa M, Visentin G, Cassandro M, De Marchi M. 2018. Phenotypic analysis of milk coagulation properties and mineral content of Pinzgauer cattle breed. Arch Anim Breed. 61(2):215–220.
- Manuelian CL, Penasa M, Visentin G, Zidi A, Cassandro M, De Marchi M. 2018. Mineral composition of cow milk from multibreed herds. Anim Sci J. 89(11):1622–1627.
- McDermott A, Visentin G, De Marchi M, Berry DP, Fenelon MA, O'Connor PM, Kenny OA, McParland S. 2016. Prediction of individual milk proteins including free amino acids in bovine milk using mid-infrared spectroscopy and their correlations with milk processing characteristics. J Dairy Sci. 99(4):3171–3182.
- McDermott A, De Marchi M, Berry DP, Visentin G, Fenelon MA, Lopez-Villalobos N, McParland S. 2017. Cow and environmental factors associated with protein fractions and free amino acids predicted using mid-infrared spectroscopy in bovine milk. J Dairy Sci. 100(8):6272–6284.
- Niero G, Penasa M, Gottardo P, Cassandro M, De Marchi M. 2016. Short communication: selecting the most informative mid-infrared spectra wavenumbers to improve the accuracy of prediction models for detailed milk protein content. J Dairy Sci. 99(3):1853–1858.
- Niero G, Visentin G, Ton S, De Marchi M, Penasa M, Cassandro M. 2016. Phenotypic characterisation of milk technological traits, protein fractions, and major mineral and fatty acids composition of Burlina cattle breed. Ital J Anim Sci. 15(4):576–583.
- Niero G, Koczura M, De Marchi M, Currò S, Kreuzer M, Turille G, Berard J. 2018. Are cheese-making properties of dual purpose cattle impaired by highland grazing? A case study using Aosta Red Pied cows. Ital J Anim Sci. 17(4):827–834.
- Penasa M, De Marchi M, Ton S, Ancilotto L, Cassandro M. 2015. Reproducibility and repeatability of milk coagulation properties predicted by mid-infrared spectroscopy. Int Dairy J. 47:1–5.
- Penasa M, Tiezzi F, Sturaro A, Cassandro MD, Marchi M. 2014. A comparison of the predicted coagulation characteristics and composition of milk from multi-breed herds of Holstein-Friesian, Brown Swiss and Simmental cows. Int Dairy J. 35(1):6–10.
- Poulsen NA, Bertelsen HP, Jensen HB, Gustavsson F, Glantz M, Månsson HL, Andrén A, Paulsson M, Bendixen C, Buitenhuis AJ, et al. 2013. The occurrence of noncoagulating milk and the association of bovine milk coagulation properties with genetic variants of the caseins in 3 Scandinavian dairy breeds. J Dairy Sci. 96(8):4830–4842.
- Rutten MJM, Bovenhuis H, Heck JML, Van Arendonk JAM. 2011. Predicting bovine milk protein composition based on Fourier transform infrared spectra. J Dairy Sci. 94(11):5683–5690.
- Schopen GCB, Heck JML, Bovenhuis H, Visker MHPW, van Valenberg HJF, van Arendonk JAM. 2009. Genetic parameters for major milk proteins in Dutch Holstein-Friesians. J Dairy Sci. 92(3):1182–1191.
- Toffanin V, De Marchi M, Lopez-Villalobos N, Cassandro M. 2015. Effectiveness of mid-infrared spectroscopy for prediction of the contents of calcium and phosphorus, and titratable acidity of milk and their relationship with milk quality and coagulation properties. Int Dairy J. 41:68–73.
- Vallas M, Kaart T, Värv S, Pärna K, Jõudu I, Viinalass H, Pärna E. 2012. Composite β-κ-casein genotypes and their effect on composition and coagulation of milk from Estonian Holstein cows. J Dairy Sci. 95(11):6760–6769.
- Varotto A, De Marchi M, Penasa M, Cassandro M. 2015. A comparison of milk clotting characteristics and quality traits of Rendena and Holstein-Friesian cows. Ital J Anim Sci. 14:202–206.
- Visentin G, Penasa M, Gottardo P, Cassandro M, De Marchi M. 2016. Predictive ability of mid-infrared spectroscopy for major mineral composition and coagulation traits of bovine milk by using the uninformative variable selection algorithm. J Dairy Sci. 99(10):8137–8145.
- Visentin G, Penasa M, Niero G, Cassandro M, De Marchi M. 2018. Phenotypic characterisation of major mineral composition predicted by mid-infrared spectroscopy in cow milk. Ital J Anim Sci. 17(3):549–556.
- Wiggans GR, Shook GE. 1987. A lactation measure of somatic cell count. J Dairy Sci. 70(12):2666–2672.
- Zhang L, Boeren S, Hageman JA, van Hooijdonk T, Vervoort J, Hettinga K. 2015. Perspective on calf and mammary gland development through changes in the bovine milk proteome over a complete lactation. J Dairy Sci. 98(8):5362–5373.