
Abstract
Negative energy balance (NEB) occurs in dairy cows during the transition period, during which time the blood concentrations of nonesterified fatty acids (NEFA) and metabolic ketones such as β-hydroxybutyric acid (BHBA) are elevated. These increased levels may disrupt immune functions and are regarded as risk factors associated with postparturient inflammatory disorders. Therefore, the aim of this study was to investigate the effects of NEFAs and BHBA on inflammatory cytokine expression in bovine peripheral leukocytes in vitro. Peripheral blood mononuclear cells (PBMCs) and peripheral polymorphonuclear leukocytes (PMNLs) were collected from 16 Holstein cows and treated for 4 h with NEFA (0.1, 0.6, and 1.5 mM) or BHBA (5 and 10 mM), alone or combination with lipopolysaccharides (LPS, 1 µg/mL). The expression levels of the inflammatory cytokines TNF-α, IL-1β, IL-6, IL-8, and IL-10 were then determined. The results indicated that PBMCs and PMNLs responded to NEFA but tolerated BHBA. NEFA treatment dose-dependently induced the expression of TNF-α, IL-1β, IL-8, and IL-10 in PBMCs and that of IL-1β, IL-6, IL-8, and IL-10 in PMNLs. Combination treatment of LPS with NEFA further increased the levels of IL-10 expression in PBMCs and IL-1β and IL-6 expression in PMNLs. Taken together, these findings suggest that NEFA and BHBA enhance the expression of inflammatory cytokines in PBMCs and PMNLs and may disrupt the immune regulation of peripheral leukocytes, leading to an increased risk of inflammatory disorders. Preventing increases in blood NEFA concentration may thus help to reduce the risk of inflammatory disorders in dairy cows during the transition period.
In cows with NEB, during the transition period, NEFA but not BHBA induced proinflammatory cytokine expression in PBMCs and PMNLs.
NEFA enhanced LPS-induced proinflammatory cytokine expression in both PBMCs and PMNLs.
Highlights
Introduction
Negative energy balance (NEB) is often observed in dairy cows during the transition period. The rapid increase in energy consumption during the final stages of foetal growth in preparation for parturition and lactation may result in a much higher daily feed intake than is typical for these cows and cause the release of fatty acids from adipose tissues to satisfy these energy requirements. However, high levels of fatty acids and their metabolites, namely ketones, are also regarded as risk factors associated with various metabolic, reproductive, and inflammatory diseases in dairy cows (Sordillo and Raphael Citation2013; Bicalho et al. Citation2017). Fatty acids released during the lipid mobilisation of adipose tissues mainly present as nonesterified fatty acids (NEFA) in the blood; these acids, along with ketones such as acetone and β-hydroxybutyric acid (BHBA) metabolised from fatty acids, are thus indicators for assessing NEB status and related health risks in dairy cows (Ospina et al. Citation2010a). However, the relationships of NEFA and BHBA with diseases during the transition period are not fully understood.
Proper regulation of the immune system, such as the levels of peripheral blood leukocytes (including lymphocytes, monocytes, and neutrophils), during parturition is crucial for preventing infection transmission caused by labour and facilitating removal of the placenta (Gunnink Citation1984; Kimura et al. Citation2002). NEB status, such as high levels of NEFA and BHBA, is reportedly associated with inflammatory disorders such as mastitis and metritis postpartum (Ospina et al. Citation2010b; Hunt et al. Citation2013). These observations suggest that when NEB occurs, high levels of blood NEFA and BHBA disrupt immune regulation during the transition period and result in the development of related inflammatory disorders. Because lymphocytes and neutrophils are two major cell types present in the blood that regulate immune responses, their functions may be affected by increased levels of NEFA and BHBA in the event of NEB. Peripheral neutrophils are present in the blood and are activated by proinflammatory signals from local tissues or other leukocytes. Activated neutrophils filtrate into injured or infected local tissues to eliminate invading pathogens. By contrast, peripheral lymphocytes function as moderators for regulating immune responses, such as through the enhancement or suppression of acute inflammation. In cases of acute or chronic inflammation, lymphocyte subtypes such as type 1 (Th1) and type 2 (Th2) helpers produce different cytokines and chemokines to mediate inflammatory activities. Th1 lymphocytes receive upstream signals to secrete interleukin (IL)-1β, IL-6, IL-8, tumour necrosis factor-α (TNF-α), interferon-γ, and other proinflammatory cytokines to enhance acute inflammatory responses against exogenous stimulation such as that from pathogens and endotoxins, whereas Th2 lymphocytes secrete IL-5, IL-10, and IL-13 to suppress acute inflammation and promote hormonal immunity (Mosmann and Coffman Citation1989). The balance of the distribution of Th1 and Th2 lymphocytes thus mediates the immune regulation of proinflammatory or anti-inflammatory status, and the polarisation of Th1 and Th2 plays a key role in mediating the balance of immune functions (Kidd Citation2003). Lipid metabolism is considered a critical factor for altering the polarisation of immune cells, including Th1 and Th2 lymphocytes, in metabolic diseases (Mizota et al. Citation2009; Stark et al. Citation2019). Accordingly, the overconsumption of energy during the transition period, which leads to increased NEFA and BHBA in the blood, may also have alternative effects on peripheral lymphocytes and neutrophils. Such effects include interfering with the inflammatory responses of peripheral leukocytes (e.g. proinflammatory and anti-inflammatory cytokine expression), immune regulation of exogenous pathogens and endotoxins, or recovery of the uterus after parturition (Scalia et al. Citation2006; Ster et al. Citation2012). These immune mediation effects may be due to direct stimulation caused by increases in NEFA and BHBA in the blood (Ster et al. Citation2012; Zhang et al. Citation2018) or indirect regulation by adipocytes and hepatocytes in cases of NEB (Choi and Diehl Citation2005). Studies have indicated that NEFA and BHBA have moderate effects on the cell viability, phagocytic functions, and cytokine production of neutrophils (Scalia et al. Citation2006; Ster et al. Citation2012; Zhang et al. Citation2018). However, the effects of NEFA and BHBA on peripheral blood lymphocytes are relatively unclear and require further investigation. A hypothesis therefore is raised that increased NEFA and/or BHBA at NEB status may disrupt expression of inflammatory cytokines in PBMCs and PMNLs, particularly when PBMCs and PMNLs are exposed to infectious bacteria during the transition period.
The aim of the present study was to determine the direct gene expression of inflammatory cytokines in PBMCs and PMNLs treated with NEFA or BHBA alone, and in combination of lipopolysaccharide (LPS) which mimics the exposure of infectious bacteria. This study may provide useful information elucidating the effects of NEFA and BHBA on the immune regulation of peripheral leukocytes in cows with NEB during the transition period.
Materials and methods
Ethical approval
The procedures of the animal experiment in this study were approved and supervised by the Institutional Animal Care and Use Committee of National Chung Hsing University (Certification no. IACUC-107-166).
Animals and blood sampling
The experimental animals in this study were a mixed-parity group of 16 Holstein cows (7 dry cows and 9 heifers; parity range of 0–3, and age range of 1.7–5.9 years) from the college farm of National Chung Hsing University. The cows underwent regular health inspections by veterinarians before blood collection. The first 9 cows were assigned to BHBA study during August to mid-September, and continued to the last 7 cows for NEFA study during mid-September to October, 2019. Due to health conditions of cows, only 7 cows available for the NEFA study. To isolate bovine peripheral leukocytes, ethylenediaminetetraacetic acid (EDTA)–coated tubes (BD Vacutainer EDTA tube, Becton, Dickinson and Company, Franklin Lakes, NJ) were used to obtain 80-mL blood samples from the jugular vein of each cow at 4–8 weeks before the expected calving date. All animals were hosted in free-stall barns with ad libitum access to a standard mixed ration of roughages (50% Bermuda hay and 50% fresh Pangola grass with 7.8% crude protein and 66.5% neutral detergent fibre). Each cow received 1.5 kg of the concentrate (cracked corn, wheat bran, and soybean meal with 20.4% crude protein and 20.3% neutral detergent fibre) twice per day, namely at 7 a.m. and 3 p.m. It satisfied the nutrient requirements for dry cows recommended in the Nutrient Requirements of Dairy Cattle published by the National Research Council in Citation2001 (National Research Council (US) 2001). Collected blood samples were transported on ice to a cell culture laboratory for the isolation of PBMCs within 1 h of collection. All blood samples were collected in the early morning before the 7 a.m. feeding time. An AU480 chemistry analyser (Beckman Coulter, Brea, CA) was used to determine blood NEFA and BHBA levels.
Isolation of bovine PBMCs and PMNLs
The collected blood samples were diluted with equal volumes of Dulbecco’s phosphate-buffered saline (DPBS; Gibco, Hercules, CA), and the diluted blood solution was divided and transferred into forty 15-mL centrifuge tubes, each of which contained 4 mL of diluted blood solution and 3 mL of Ficoll-Paque PREMIUM 1.084 (GE Healthcare, Chicago, IL). The solution was then centrifuged at 450 × g at room temperature for 30 min. The middle layer of the PBMCs and bottom layer of the PMNLs were collected separately, and each tube was washed with 10 mL of DPBS under 400 × g centrifugation at room temperature for 10 min to obtain cell pellets. The pellets were then resuspended with 10 mL of 1× erythrocyte lysis buffer (1 L deionised distilled water with 8.26 g of ammonium chloride, 1 g of potassium bicarbonate, and 0.037 g of EDTA (Horn et al. Citation2011)) to remove the remaining erythrocytes. The isolated PBMC and PMNL samples were kept at room temperature for 7 min; they were then supplemented with 15 mL of DPBS to terminate the reaction and centrifuged at 400 × g for 10 min to remove the supernatant. The cell pellets were then suspended and washed with 20 mL of DPBS and centrifuged again at 400 × g for 10 min to collect PBMCs and PMNLs. Finally, the isolated PBMC or PMNL pellets from each cow were suspended in a RPMI1640 culture medium (Gibco, Hercules, CA) containing 5% foetal bovine serum (Gibco, CA, USA) and a 1% penicillin–streptomycin solution (Biological Industries, Beit Haemek, Israel), and combined together for further in vitro culture. Trypan blue staining (Sigma-Aldrich, St. Louis, MO) was performed with a TC20 automated cell counter (Bio-Rad, Hercules, CA) to determine the cell number and viability. The viability levels of the isolated PBMCs and PMNLs were 93.4% ± 0.6% and 98.1% ± 0.4% (mean ± standard error), respectively. Isolated PBMCs and PMNLs were stained with Liu’s stain solution (Tonyar Biotech Inc., Taoyuan City, Taiwan) to determine the leukocyte distribution within the collected PBMCs and PMNLs. In brief, a 500-μL cell suspension was mixed with 500 μL of 4% paraformaldehyde and kept at room temperature for 20 min for fixation. The fixed cells were then centrifuged at 400 × g for 10 min and suspended in 50 μL of deionised distilled water before being mixed with Liu’s A and B solutions to stain the leukocytes on Frontier FRC-13 coated glass slides (Matsunami, Tokyo, Japan). The leukocytes were then evaluated under an optical microscope (BX43, Olympus, Tokyo, Japan). Due to overstaining of Liu’s B solution, only few samples were evaluated. The distribution of PBMCs and PMNLs were approximately 65% and 35% respectively.
Treatment of NEFA, BHBA and lipopolysaccharides
To determine cytokine expression in direct response to NEFA and BHBA combined with LPS stimulation, isolated bovine PBMCs and PMNLs were cultured in 1.5 mL of cell culture medium in 12-well Falcon cell culture plates (Fisher Scientific, Loughborough, UK) at 5 × 10⁶ cells per well. The cells were treated with NEFA (0.1, 0.6, and 1.5 mM) or BHBA (5 and 10 mM), either alone or in combination with LPS (1 μg/mL) for 4 h at 37 °C under conditions of 5% CO2 and 95% relative humidity. To prevent long-term cytotoxic effect of NEFA and BHBA on PBMCs and PMNLs and also ensure cytokine expression induction, exposure time of NEFA and BHBA on PBMCs and PMNLs were set to 4 h (Boeuf et al. Citation2005; Ster et al. Citation2012). The NEFA and BHBA concentrations for treating bovine PBMCs and PMNLs in this study were selected on the basis of physiological blood levels during the transition period. The blood NEFA concentration in dairy cows is normally approximately 0.2 mM and may increase to >1 mM near the parturition time (Grummer Citation1993). Therefore, 0.1, 0.6, and 1.5 mM NEFA were selected to treat bovine PMBCs, both alone and with LPS. Furthermore, blood BHBA concentration is an indicator of ketosis in dairy cows. Subclinical ketosis is defined as 1.2–2.9 mM blood BHBA, whereas clinical ketosis is defined as a blood BHBA concentration of >3 mM (Andersson Citation1988; McArt et al. Citation2011). In preparation of NEFA treatment, NEFA stock solution (52.7 mM) composed of oleic acid (22.9 mM), palmitic acid (16.8 mM), stearic acid (7.6 mM), palmitoleic acid (2.8 mM), and linoleic acid (2.6 mM) was prepared through the use of 0.1 M KOH in 2% DPBS-BSA at 60 °C and then supplemented with hydrochloric acid with an adjusted pH of 7.4. This NEFA mixture was prepared in accordance with a report by Yamdagni and Schiltz on the composition of fatty acids in cows (Yamdagni and Schultz Citation1970), which was validated through testing by Du et al. (Citation2018) and Zhang et al. (Citation2018). Before the culture medium was prepared, the NEFA stock solution was filtered through a 0.22-μm Millex syringe filter (Merck, Darmstadt, Germany). An RPMI1640 medium with 2% bovine serum albumin, 5% foetal bovine serum, and 1% penicillin–streptomycin (Biological Industries, Beit Haemek, Israel) was used to dilute the NEFA stock solution to form 0.1, 0.6, and 1.5 mM NEFA cell culture mediums. DPBS was used to prepare BHBA as a 250 mM stock solution, which was filtered through a 0.22-μm Millex syringe filter. The BHBA stock solution was diluted with RPMI1640 medium with 5% foetal bovine serum and 1% penicillin–streptomycin (Biological Industries, Beit Haemek, Israel) to form 5 and 10 mM BHBA cell culture mediums. To test the tolerance and cytokine regulation of PBMCs and PMNLs under BHBA stimulation, higher BHBA concentrations of 5 and 10 mM were selected to treat bovine PBMCs and PMNLs, alone and with LPS. When combined with LPS treatment, diluted NEFA and BHBA cell culture mediums were further supplemented with 1 μg/mL LPS before cell treatment. The treatment of 1 μg/mL LPS was suggested to be appropriate for mimicking pathogen stimulation in peripheral immune cells. All treatments of PBMCs and PMNLs from the cows were performed in quadruplicate. After incubation with NEFA or BHBA, alone or in combination with LPS, the PBMCs and PMNLs were collected through centrifugation at 400 × g for 15 min. A Sigma cell lifter (Sigma-Aldrich, St Louis, MO) was used to scrape off adherent PBMCs.
NEFA, BHBA, LPS (isolated from Escherichia coli O111:B4) with Toll-like receptor (TLR)-2 and TLR-4 activity (Park et al. Citation2004), and bovine serum albumin (A8806, which is free of fatty acids, low in endotoxin, and suitable for cell culture) were purchased from Sigma-Aldrich (St. Louis, MO). After 4 h of treatment, PBMCs and PMNLs were collected through centrifugation at 400 × g for 10 min and suspended in TRIzol (Invitrogen, Carlsbad, CA) for total RNA (tRNA) extraction.
Determination of cytokine mRNA expression
TRIzol reagent (Thermo Fisher Scientific, UK) was used in accordance with the manufacturer’s instructions for total extraction of RNA from the cultured PBMCs. The tRNA quality was determined on the basis of whether the ratios of ultraviolet absorbance at 260 and 280 nm were in the range of 1.8–2.0. The SuperScript IV Reverse Transcriptase kit (Invitrogen, Carlsbad, CA) was then employed to quantify the tRNA samples and equalise them to 2 μg for complementary DNA (cDNA) synthesis. The cDNA samples were then used to determine the mRNA expression of selected cytokines, namely TNF-α, IL-1β, IL-6, IL-8, and IL-10, through quantitative polymerase chain reaction (qPCR) with the designed primers (Table ) and iTaq Universal SYBR Green Super mix (Bio-Rad, Hercules, CA) on a CFX96 Real-Time PCR Detection System (Bio-Rad, Hercules, CA). To determine cytokine expression profile, the ΔΔCt method was adopted for the calculation of real-time PCR results. Cytokine mRNA expression was then normalised according to glyceraldehyde 3-phosphate dehydrogenase (GAPDH) expression in the calculation of ΔCt (threshold cycle) = Cttarget cytokine gene – CtGAPDH. The obtained ΔCt values were subsequently used to calculate the ΔΔCt values of control samples (without NEFA, BHBA, or LPS treatment) and the treated samples. Housekeeping genes such as GAPDH and β-actin were suggested as validated bovine reference genes (Robinson et al. Citation2007). According to our preliminary real-time PCR test, the GAPDH was slightly more stable than β-actin, and therefore we select GAPDH as the single reference gene for this study, though utilisation of more than one reference genes is recommended for more accurate measurements of real-time PCR (Robinson et al. Citation2007). All PCR products from the selected cytokines and GAPDH primers were sequenced and checked with the National Center for Biotechnology Information Basic Local Alignment Search Tool. Additionally, before sample analysis, postamplification melting-curve analysis was conducted and the PCR products of selected gene primers were evaluated.
Table 1. Quantitative PCR primer sequences for detecting selected inflammatory cytokines and GAPDH.
Statistical analysis
All data quantified in this study are presented as means ± standard errors (SEs). One-way analysis of variance (ANOVA) was performed to analyse the effects of NEFA, BHBA, and LPS in mediating cytokine expression in PBMCs and PMNLs, whereas two-way ANOVA was performed to analyse the combination effects of NEFA with LPS and BHBA with LPS in mediating cytokine expression in PBMCs and PMNLs. Accordingly, statistical significance was analysed in IBM SPSS Statistics 20 (IBM, New York, NY) with the level of statistical significance set to p < .05.
Results
Distribution and viability of isolated bovine PBMCs and PMNLs with NEFA, BHBA, and LPS treatment
In the isolated PBMCs, the majority of lymphocytes and some monocytes were noted to have no granulocyte contamination (Figure ). The majority of PMNLs were neutrophils, followed by eosinophils, but none were lymphocytes or monocytes (Figure ). Furthermore, to evaluate whether NEFA and BHBA treatment induce differentiation or cytotoxicity in bovine PBMCs and PMNLs, cell viability was assessed through trypan blue staining after 4-h treatment with NEFA or BHBA, alone or with LPS. As indicated in Table , none of the treatments induced cytotoxicity in the cultured PBMCs or PMNLs. The viabilities were approximately 85.9–89.2% for PBMCs and 89.2–96.3% for PMNLs and did not differ significantly between the control and treatment groups, except for LPS-treated PBMCs. When the PBMCs were treated with 0.1–1.5 mM NEFA in combination with LPS, their viability decreased gradually, indicating that NEFA and LPS exerted a toxic combination effect on PBMCs, although the viability of the PBMCs only decreased from 88.9% to 85.9%. Together, these data suggest that the selected concentration of NEFA (0.1–1.5 mM), BHBA (5–10 mM), or LPS 1 µg/mL had no observed cytotoxic effect on bovine PBMCs or PMNLs in vitro.
Figure 1. Morphological observation of isolated PBMCs and PMNLs from dry cows. (A) PBMCs were mainly lymphocytes (black arrow), with some monocytes (white arrow). (B) PMNLs were mainly neutrophils (white arrow), with some eosinophils (black arrow). PBMCs: Peripheral blood mononuclear cells; PMNLs: Polymorphonuclear leukocytes.
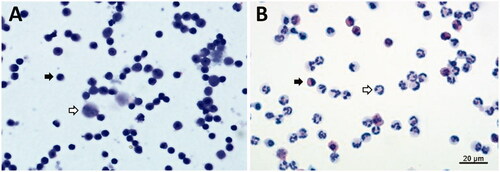
Table 2. Viability of PBMCs and PMNLs under NEFA or BHBA treatment alone and in combination with LPS for 4 h.
Cytokine expression of PBMCs and PMNLs induced by NEFA alone or in combination with LPS treatment
In the present study, the gene expressions of four proinflammatory cytokines (TNF-α, IL-1β, IL-6, and IL-8) and one anti-inflammatory cytokine (IL-10) in both PBMCs and PMNLs were determined after 4-h treatment with NEFA (n = 7 cows) or BHBA (n = 9 cows), alone or in combination with LPS. NEFA and BHBA concentrations of 1.5 and 5 mM, respectively, were regarded as the maximum exposure concentrations for dairy cows with NEB during the transition period. The treatment of LPS is to mimic pathogen stimulation during the transition period.
The gene expressions of proinflammatory cytokines in PMNLs, including those of IL-1β, IL-6, and IL-8, increased significantly in a dose-dependent manner in response to NEFA stimulation (Table ). The 1.5 mM NEFA treatment caused significant (2.17-, 2.66-, and 1.74-folds) increases in the expression of IL-1β, IL-6, and IL-8, respectively (Figure ). Although IL-10 expression was also induced by NEFA treatment, the expression level did not differ significantly between the treatment and control groups (Table ). By contrast, greater suppression of TNF-α gene expression was observed at higher NEFA treatment concentrations (Table ). In PBMCs, NEFA treatment also significantly induced the expression of TNF-α, IL-1β, IL-8, and IL-10 in a dose-dependent manner but did not have the same effect on IL-6 expression (Table ). However, the induction fold of gene expression relative to the expression levels in the control group was low for TNF-α and IL-10 (1.59- and 1.27-folds, respectively; Figure ), suggesting that 1.5 mM NEFA treatment exerted a minor effect on the expression of these cytokines. In comparison, a higher induction fold of gene expression relative to the expression levels in the control group was observed for IL-1β and IL-8 (2.13- and 1.89-folds, respectively; Figure ) under 1.5 mM NEFA stimulation.
Figure 2. Cytokine expression induced by combination treatment of NEFA with LPS in PBMCs and PMNLs. PBMCs and PMNLs were treated with 0.1, 0.6, and 1.5 mM NEFA alone or with 1 µg/mL LPS for 4 h. The mRNA expression levels of TNF-α, IL-1β, IL-6, IL-8, and IL-10 were determined through real-time PCR. Data are presented as means ± SEs. p values represent comparisons between two groups through one-way ANOVA; a p value of <.05 denotes statistical significance. * indicates p < .05, and ** indicates p < .01. NEFA: Nonesterified fatty acids; LPS: Lipopolysaccharides; PBMC(s): Peripheral blood mononuclear cell(s); PMNL(s): Polymorphonuclear leukocyte(s); mRNA: messenger ribonucleic acid; TNF-α: Tumor necrosis factor-α; IL-1β: Interleukin-1β; IL-6: Interleukin-6;IL-8: Interleukin-8; IL-10: Interleukin-10; PCR: Polymerase chain reaction; SEs: Standard errors; One-way ANOVA: One-way analysis of variance.
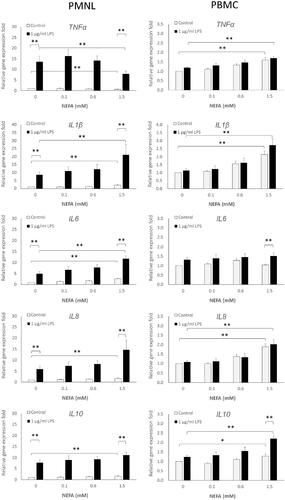
Table 3. Analysis of dose-dependent and combination effects on cytokine expression induced by NEFA alone or in combination with LPS treatment in PMNLs and PBMCs.
In the PMNLs treated with 1 μg/mL LPS alone, the expression levels of all five tested cytokines (TNF-α, IL-1β, IL-6, IL-8, and IL-10) were significantly higher (13.57-, 8.69-, 4.92-, 5.87-, and 7.67-folds, respectively) than those of the PMNLs in the control group (Table ). The combination of 1 μg/mL LPS with 0.1 to 1.5 mM NEFA led to further increases in IL-1β, IL-6, and IL-10 expression levels in PMNLs (Figure ). Among these cytokines, only IL-6 expression exhibited a dose-dependent response to 0.1–1.5 mM NEFA and LPS (Table ). By contrast, the level of TNF-α expression induced by LPS was significantly lower (13.57- to 7.87-folds) after NEFA treatment than it was after treatment with LPS alone (Figure ).
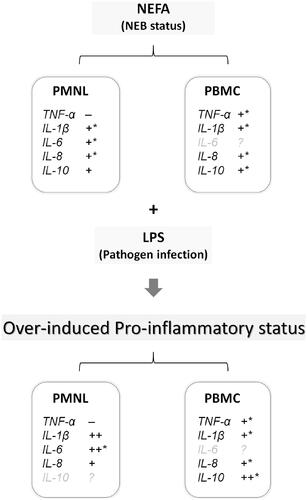
In the PBMCs treated with 1 µg/mL LPS alone, only the expression levels of IL-6 and IL-10 exhibited slight increases (less than 1.5-fold; Figure ). Under the combination treatment of 0.1, 0.6, and 1.5 mM NEFA with LPS, all tested cytokines exhibited dose-dependent increases in their expression levels; these results are similar to those of applying NEFA treatment to PMNLs (Table ). NEFA and LPS exhibited a combination effect of inducing IL-10 expression. As displayed in Figure .5 mM NEFA treatment induced a 1.27-fold increase in IL-10 expression, which was enhanced to a 2.2-fold increase when NEFA was combined with 1 μg/mL LPS. This result suggests that exposure to LPS under NEFA stimulation further synergistically induces IL-10 expression. The effects of NEFA alone and in combination with LPS on cytokine expression of PBMCs and PMNLs are summarised in Figure .
Figure 3. Summary of findings suggesting effects of NEFA and LPS on inflammatory cytokine expression in bovine PBMCs and PMNLs. Under NEB, NEFA induces inflammatory cytokine expression, and when combined with exposure to a pathogen (e.g. LPS), the expression levels of these inflammatory cytokines are further increased, resulting in excessive inflammatory response. +, induction by NEFA treatment; ++, synergistic induction by NEFA and LPS combination treatment; –, suppression by NEFA treatment; *, dose-dependent induction by NEFA treatment. Grey font, no significant induction or suppression identified. NEFA: Nonesterified fatty acids; LPS: Lipopolysaccharides; PBMC(s): Peripheral blood mononuclear cell(s); PMNL(s): Polymorphonuclear leukocyte(s); NEB: Negative energy balance; TNF-α: Tumor necrosis factor-α; IL-1β: Interleukin-1β; IL-6: Interleukin-6;IL-8: Interleukin-8; IL-10: Interleukin-10.
Cytokine expression of PBMCs and PMNLs induced by BHBA alone or in combination with LPS treatment
When PMNLs were treated with BHBA alone, the gene expression levels of IL-β and IL-10 were significantly increased (2.0- and 1.9-folds, respectively) by BHBA concentration of 5 mM, but exhibited no further increases when a concentration of 10 mM was used (Figure ). In the PBMCs, relative to their gene expression levels in the control group, IL-1β and IL-8 expression levels exhibited 2.08- and 1.60-fold increases, respectively, in response to 10 mM BHBA but not 5 mM BHBA (Figure ).
Figure 4. Cytokine expression induced by combination treatment of BHBA with LPS in PBMCs and PMNLs. PBMCs and PMNLs were treated for 4 h with 0, 5, and 10 mM BHBA, either alone or with 1 µg/mL LPS. The mRNA expression levels of TNF-α, IL-1β, IL-6, IL-8, and IL-10 were determined through real-time PCR. Data are presented as the mean ± SE. *, p values represent comparisons between two groups through one-way ANOVA; a value of <.05 denotes statistical significance. * indicates p < .05, and ** indicates p < .01. BHBA: β-hydroxybutyric acid; LPS: Lipopolysaccharides; PBMC(s): Peripheral blood mononuclear cell(s); PMNL(s): Polymorphonuclear leukocyte(s); mRNA: messenger ribonucleic acid; TNF-α: Tumor necrosis factor-α; IL-1β: Interleukin-1β; IL-6: Interleukin-6;IL-8: Interleukin-8; IL-10: Interleukin-10; PCR: Polymerase chain reaction; SEs: Standard errors; One-way ANOVA: One-way analysis of variance.
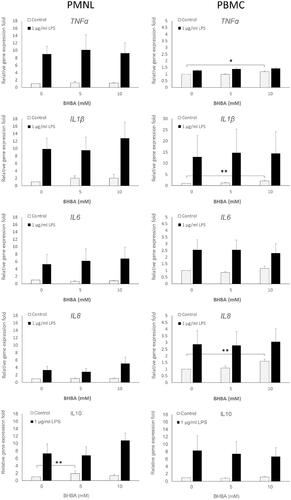
Under LPS stimulation, the gene expression of all tested cytokines in PMNLs was clearly induced, but no significant increases in the expression levels were observed when LPS stimulation was combined with BHBA treatment (Table ). Only nonsignificant increases in IL-8 and IL-10 gene expression levels (from 3.29- to 5.07-folds and 7.33- to 10.84-folds, respectively) were observed in response to combined LPS and 5 mM BHBA treatment (Table ). In contrast to PMNLs, PBMCs exhibited no increases in the gene expression levels of any of the tested cytokines in response to the combination treatment of LPS with 5 or 10 mM BHBA, with the exception of a moderate increase in IL-6 expression (Table ). Furthermore, although LPS treatment significantly induced the expression of the tested cytokines, BHBA and LPS combination treatment did not appear to increase their expression levels in PBMCs
Table 4. Analysis of dose-dependent and combination effects on cytokine expression induced by BHBA alone or in combination with LPS treatment in PMNLs and PBMCs.
Discussion
During the transition period, NEB status is defined as a blood NEFA concentration higher than 0.6 mM, and the concentration can eventually reach 1.2–1.5 mM in some cows, often leading to postpartum health problems (Ospina et al. Citation2010b; Mann et al. Citation2015) that are mainly associated with inflammatory diseases, such as mastitis and metritis (Andela et al. Citation2019; Moyes et al. Citation2009). NEFA in the blood may therefore contribute to the disruption of immune balance and increase the incidence of inflammatory disorders in dairy cows. Among peripheral leukocytes, PBMCs play a key role in mediating immune responses through the secretion of inflammatory cytokines and chemokines, whereas the main functions of PMNLs are eliminating invading pathogens and expressing cytokines that work with other immune cells to regulate immune responses. Therefore, both PBMCs and PMNLs may be alternately or evenly disrupted by increases in blood NEFA concentration during the transition period. The results of the present study indicate that the expression of proinflammatory cytokines such as TNF-α, IL-1β, and IL-8 and the anti-inflammatory cytokine IL-10 is dose-dependently induced by 0.1–1.5 mM NEFA treatment in PBMCs; these concentrations constitute the range of physiological NEFA levels found in the blood of cows during the transition period. By contrast, the effects of NEFA treatment on the cytokine expression in PMNLs varied; IL-6 expression was induced, TNF-α expression was reduced, and the expressions of IL-1β, IL-8, and IL-10 were significantly induced. However, the expression of IL-10 in both PBMCs and PMNLs was less significantly induced than was that of the other proinflammatory cytokines. Because TNF-α, IL-1β, IL-6, and IL-6 are regarded as proinflammatory cytokines that enhance acute inflammatory responses, the result that NEFA induced cytokine expression in both PBMCs and PMNLs suggests that increased blood NEFA concentrations promote the expression of peripheral proinflammatory cytokines to achieve immune balance. Notably, NEFA was observed to induce IL-6 expression only in PMNLs and was observed to suppress TNF-α expression in PMNLs but not in PBMCs. These results suggest that NEFA are capable of inducing inflammatory cytokine expression on both PBMCs and PMNLs, but exerts different effects on PBMCs and PMNLs.
In dairy cows, inflammatory diseases during the transition period, particularly during the postpartum and early lactation periods, are mainly the consequence of ineffective immune activity for resisting pathogen infection (Sordillo et al. Citation2009; Ster et al. Citation2012; Esposito et al. Citation2014). NEB status is regarded as a potential risk factor that may disrupt normal immune activity or cause imbalance in the immune regulation of cows, thus rendering them vulnerable to pathogen invasion (Hammon et al. Citation2006; Hotamisligil and Erbay Citation2008; Wathes et al. Citation2009). In the present study, isolated bovine PBMCs and PMNLs received 1 μg/mL LPS in combination with 0.1–1.5 mM NEFA or 5–10 mM BHBA stimulation to enable the examination of cytokine gene expression under potential pathogen invasion during NEB/ketosis. The results demonstrate that proinflammatory cytokine expression was similar in PBMCs receiving NEFA treatment alone or in combination with LPS, whereas the expression of the anti-inflammatory cytokine IL-10 was synergistically enhanced by the combination treatment of NEFA and LPS. This combination treatment also synergistically enhanced IL-1β, and IL-6 expression in PMNLs but suppressed TNF-α expression. Taken together, LPS induced inflammatory cytokine expression on PBMCs and PMNLs which mimics bacterial infection are further enhanced by NEFA. It suggests that increased NEFA at NEB status during the transition period may also promote inflammatory cytokine production when cows expose to infectious bacteria.
Regarding the effects of BHBA on PBMCs and PMNLs, PBMCs only responded to a BHBA concentration of 10 mM, exhibiting slightly increased IL-1β and IL-8 expression levels, whereas PMNLs responded to 5 mM BHBA with a slight induction of IL-1β and IL-10 expression. Blood BHBA concentrations can increase to 5 mM in cows with severe ketosis (Oetzel Citation2004; McArt et al. Citation2013), and the concentrations of 5–10 mM used in this study are higher than in vivo levels. Both PBMCs and PMNLs were more tolerant of BHBA stimulation than to NEFA stimulation in terms of cytokine expression. Compared with the combination treatment of NEFA with LPS, that of BHBA with LPS did not cause a greater induction of cytokine expression in PBMCs and PMNLs, except for the induction of TNF-α expression in PBMCs. Notably, however, compared with PBMCs isolated for NEFA studies, PBMCs isolated for BHBA studies exhibited higher expressions of IL-1β, IL-6, IL-8, and IL-10. This is likely attributable to the fact that sampling for the BHBA group was performed in August to mid-September, whereas that for the NEFA group was performed in mid-September to October 2019. Therefore, the temperature and humidity levels during summer may have subjected the cows to heat stress, thereby influencing the balance of peripheral immune cells. Nevertheless, our results suggest that BHBA are less effects on mediating expression of inflammatory cytokine on PBMCs and PMNLs in compared with NEFA. Also, BHBA has no observable effects of cytokine expression on PBMCs and PMNLs in combination with LPS stimulation.
Leukocytes generally respond to LPS stimulation and express cytokines through TLRs, primarily TLR-2 and TLR-4 (De Schepper et al. Citation2008; Griesbeck-Zilch et al. Citation2008; Petzl et al. Citation2008), whereas NEFA activates cytokine expression through both TLR-2/TLR-4 and free fatty acid receptors (FFARs) (Ichimura et al. Citation2009; Zhang et al. Citation2018). NEFA and LPS share common TLR pathways for the activation of cytokine expression; their competition for the same cellular signalling pathway may explain why the dose-dependent induction of TNF-α, IL-1β, and IL-8 expression by NEFA was not further enhanced by LPS in the PBMCs. By contrast, the increase in IL-10 expression in response to the combination treatment of NEFA with LPS stimulation suggests that NEFA may activate signalling pathways other than TLR-2/TLR-4 to enhance LPS-induced IL-10 expression in PBMCs. IL-10 is a key inflammatory regulating cytokine that slows acute inflammation processes and facilitates tissue repair during inflammation (Mosser and Zhang Citation2008; Islam et al. Citation2013). Therefore, the synergistic effect of NEFA combined with LPS in inducing IL-10 expression in PBMCs suggests that a unique immune mediation or disruption response may occur when cows with NEB are infected with environmental pathogens during the transition period. However, whether the IL-10 expression induced by the combination of NEFA and LPS helps protect against or interrupt the process of pathogen infection and the subsequent occurrence of inflammatory diseases in dairy cows requires clarification in further in vivo studies. By contrast, the LPS-induced expression of IL-1β, IL-6, and IL-8 in PMNLs was synergistically enhanced by NEFA treatment in a dose-dependent manner, which indicates that compared with PBMCs, PMNLs are more capable of responding to combined NEFA and LPS stimulation and can more effectively activate proinflammatory cytokine expression through TLRs, FFARs, and likely other cellular signalling pathways such as NEFA-associated lipid oxidative stress. Collectively, these results reveal that NEFA induces proinflammatory cytokine expression in both PBMCs and PMNLs and further disrupts their immune responses when peripheral leukocytes are exposed to pathogens.
Increased blood NEFA concentrations in dairy cows during the transition period also increase the metabolic load on the liver, which results in lipid accumulation on hepatocytes and the subsequent development of fatty liver disorders (Grummer Citation1993; Bobe et al. Citation2004). In PBMCs and PMNLs, the NEFA-induced gene expression of proinflammatory cytokines, including TNF-α, IL-1β, IL-6, and IL-8, suggests that higher blood NEFA concentrations lead to proinflammatory status in peripheral leukocytes and further increase the metabolic load on hepatocytes by triggering acute-phase responses through proinflammatory cytokines (Carroll et al. Citation2009; Vangroenweghe et al. Citation2004; Yuan et al. Citation2013). However, the NEFA-induced secretion of TNF-α, IL-1β, and IL-8 from PBMCs and PMNLs requires confirmation. Moreover, other endocrine factors, such as steroid hormones (oestrogen, progesterone, and glucocorticoids) and prolactin, are also known to be key immune regulators involved in the functions of PBMCs and PMNLs (Lamote et al. Citation2004). Further clarification is also necessary regarding whether the interaction of these steroid hormones with NEFA in cases of NEB determines the efficiency of systematic immune functions and energy metabolism and utilisation, thereby affecting the health outcomes of dairy cows during the transition period.
In comparison with BHBA, NEFA is more effective in inducing proinflammatory cytokine expression in PBMCs and PMNLs. During the transition period, elevated blood NEFA concentrations cause increases in proinflammatory cytokine expression and therefore promote repeated inflammation (Bradford et al. Citation2015). This effect, in turn, leads to the disruption of system homeostasis, including the disruption of liver metabolism, and triggers a systemic adaptive immune response to control this subacute inflammation induced by NEFA. After homeostasis has been altered by NEFA, the capability of acute inflammatory responses to collaborate with liver and systemic immune regulation may be impaired, resulting in vulnerability to acute infection (Bertoni et al. Citation2008; Bradford et al. Citation2009). However, whether NEFA induces proinflammatory cytokine expression in PBMCs and PMNLs in a systemic manner requires further clarification. Combination treatment of NEFA with LPS in PBMCs and PMNLs caused further increases in the expression levels of the proinflammatory cytokines IL-1β, IL-6, and IL-10, which indicates that NEFA may help trigger acute inflammatory response against pathogens. However, excessive acute inflammatory response may cause damage, such as the respiratory burst of neutrophils in local cells surrounding infected tissues (Mittal et al. Citation2014). Therefore, high levels of NEFA in cases of NEB could disrupt immune regulation by causing excessive inflammatory response. To maintain immune balance and capabilities, maintaining blood NEFA concentrations within a normal range could be helpful for preventing metabolic and inflammatory diseases during the transition period.
This study has several limitations. The NEFA used for the treatment of PBMCs and PMNLs was a mixture of oleic acid, palmitic acid, stearic acid, palmitoleic acid and linoleic acid, which are present in the blood of dairy cows (Yamdagni and Schultz Citation1970; Contreras et al. Citation2010). However, variations in many nutrient-related and physiological factors, such as the feed ingredients at different farms, digestive and metabolic efficiency of individual cows, and the stage of the transition period of individual cows, may contribute to differences in blood NEFA concentrations. These variations affect the mediation of NEFA through TLRs and FFARs and the subsequent expression of inflammatory cytokines. Furthermore, compared with PMNLs, which mainly consist of neutrophils, PBMCs are composed of monocytes and lymphocytes, which can be differentiated into type I/type II macrophages and Th-1/Th-2 lymphocytes, respectively, to determine proinflammatory or anti-inflammatory immune responses to NEFA and BHBA stimulation (Hubler and Kennedy Citation2016). Type I macrophages and Th-1 lymphocytes trigger proinflammatory responses, whereas M2 macrophages and Th-2 lymphocytes trigger anti-inflammatory responses. Evaluating NEFA- and BHBA-induced differentiation of PBMCs may help clarify the immune mediation or disruption effects of NEFA in cows with NEB during the transition period. Therefore, further investigation is necessary for examining the role of major fatty acids of NEFA as well as its differentiation of leukocyte subtypes of PBMCs.
Conclusion
In conclusion, exposure to high concentrations of NEFA but not BHBA disrupts immune responses of bovine PBMCs and PMNLs by inducing proinflammatory cytokine expression. Furthermore, the combination treatment of NEFA and LPS demonstrates synergistic effects to enhance expression inflammatory cytokines on both PMNLs and PBMCs. These findings indicate that NEFA but not BHBA plays a critical role to disrupt the expression of inflammatory cytokines and balance of immune regulation on bovine peripheral leukocytes at the NEB status during the transition period. Control of increased blood NEFA during the transition period may be helpful to maintain immune functions of peripheral leukocytes and prevent related inflammatory disorders in dairy cows.
Disclosure statement
The authors declare that no conflicts of interest were involved in the writing of this paper.
Data availability statement
All data presented in this study are available upon request.
Additional information
Funding
References
- Andela BG, Van Eerdenburg FJCM, Choukeir A, Buják D, Szelényi Z, Boldizsár S, Kézér FL, Molnár L, Kovács L, Szenci O, et al. 2019. Relationships among some serum enzymes, negative energy balance parameters, parity and postparturient clinical (endo)metritis in Holstein Friesian cows – Short communication. Acta Vet Hung. 67(2):241–245.
- Andersson L. 1988. Subclinical ketosis in dairy cows. Vet Clin North Am Food Anim Pract. 4(2):233–251.
- Bertoni G, Trevisi E, Han X, Bionaz M. 2008. Effects of inflammatory conditions on liver activity in puerperium period and consequences for performance in dairy cows. J Dairy Sci. 91(9):3300–3310.
- Bicalho MLS, Marques EC, Gilbert RO, Bicalho RC. 2017. The association of plasma glucose, BHBA, and NEFA with postpartum uterine diseases, fertility, and milk production of Holstein dairy cows. Theriogenology. 88:270–282.
- Bobe G, Young JW, Beitz DC. 2004. Invited review: pathology, etiology, prevention, and treatment of fatty liver in dairy cows. J Dairy Sci. 87(10):3105–3124.
- Boeuf P, Vigan-Womas I, Jublot D, Loizon S, Barale J-C, Akanmori B, Mercereau-Puijalon O, Behr C. 2005. CyProQuant-PCR: a real time RT-PCR technique for profiling human cytokines, based on external RNA standards, readily automatable for clinical use. BMC Immunol. 6(1):5.
- Bradford BJ, Mamedova LK, Minton JE, Drouillard JS, Johnson BJ. 2009. Daily injection of tumor necrosis factor-{alpha} increases hepatic triglycerides and alters transcript abundance of metabolic genes in lactating dairy cattle. J Nutr. 139(8):1451–1456.
- Bradford BJ, Yuan K, Farney JK, Mamedova LK, Carpenter AJ. 2015. Invited review: Inflammation during the transition to lactation: new adventures with an old flame. J Dairy Sci. 98(10):6631–6650.
- Carroll JA, Reuter RR, Chase CC, Coleman SW, Riley DG, Spiers DE, Arthington JD, Galyean ML. 2009. Profile of the bovine acute-phase response following an intravenous bolus-dose lipopolysaccharide challenge. Innate Immun. 15(2):81–89.
- Choi S, Diehl AM. 2005. Role of inflammation in nonalcoholic steatohepatitis. Curr Opin Gastroenterol. 21(6):702–707.
- Contreras GA, O'Boyle NJ, Herdt TH, Sordillo LM. 2010. Lipomobilization in periparturient dairy cows influences the composition of plasma nonesterified fatty acids and leukocyte phospholipid fatty acids. J Dairy Sci. 93(6):2508–2516.
- De Schepper S, De Ketelaere A, Bannerman DD, Paape MJ, Peelman L, Burvenich C. 2008. The toll-like receptor-4 (TLR-4) pathway and its possible role in the pathogenesis of Escherichia coli mastitis in dairy cattle. Vet Res. 39(1):5.
- Du X, Zhu Y, Peng Z, Cui Y, Zhang Q, Shi Z, Guan Y, Sha X, Shen T, Yang Y, et al. 2018. High concentrations of fatty acids and β-hydroxybutyrate impair the growth hormone-mediated hepatic JAK2-STAT5 pathway in clinically ketotic cows. J Dairy Sci. 101(4):3476–3487.
- Esposito G, Irons PC, Webb EC, Chapwanya A. 2014. Interactions between negative energy balance, metabolic diseases, uterine health and immune response in transition dairy cows. Anim Reprod Sci. 144(3–4):60–71.
- Griesbeck-Zilch B, Meyer HHD, Kühn CH, Schwerin M, Wellnitz O. 2008. Staphylococcus aureus and Escherichia coli cause deviating expression profiles of cytokines and lactoferrin messenger ribonucleic acid in mammary epithelial cells. J Dairy Sci. 91(6):2215–2224.
- Grummer RR. 1993. Etiology of lipid-related metabolic disorders in periparturient dairy cows. J Dairy Sci. 76(12):3882–3896.
- Gunnink JW. 1984. Retained placenta and leucocytic activity. Vet Q. 6(2):49–51.
- Hammon DS, Evjen IM, Dhiman TR, Goff JP, Walters JL. 2006. Neutrophil function and energy status in Holstein cows with uterine health disorders. Vet Immunol Immunopathol. 113(1–2):21–29.
- Horn P, Bork S, Wagner W. 2011. Standardized isolation of human mesenchymal stromal cells with red blood cell lysis. Methods Mol Biol. 698:23–35.
- Hotamisligil GS, Erbay E. 2008. Nutrient sensing and inflammation in metabolic diseases. Nat Rev Immunol. 8(12):923–934.
- Hubler MJ, Kennedy AJ. 2016. Role of lipids in the metabolism and activation of immune cells. J Nutr Biochem. 34:1–7.
- Hunt KM, Williams JE, Shafii B, Hunt MK, Behre R, Ting R, McGuire MK, McGuire MA. 2013. Mastitis is associated with increased free fatty acids, somatic cell count, and interleukin-8 concentrations in human milk. Breastfeed Med. 8(1):105–110.
- Ichimura A, Hirasawa A, Hara T, Tsujimoto G. 2009. Free fatty acid receptors act as nutrient sensors to regulate energy homeostasis. Prostaglandins Other Lipid Mediat. 89(3–4):82–88.
- Islam R, Kumar H, Nandi S, Rai RB. 2013. Determination of anti-inflammatory cytokine in periparturient cows for prediction of postpartum reproductive diseases. Theriogenology. 79(6):974–979.
- Kidd P. 2003. Th1/Th2 balance: the hypothesis, its limitations, and implications for health and disease. Altern Med Rev. 8(3):223–246.
- Kimura K, Goff JP, Kehrli ME, Reinhardt TA. 2002. Decreased neutrophil function as a cause of retained placenta in dairy cattle. J Dairy Sci. 85(3):544–550.
- Lamote I, Meyer E, Duchateau L, Burvenich C. 2004. Influence of 17beta-estradiol, progesterone, and dexamethasone on diapedesis and viability of bovine blood polymorphonuclear leukocytes. J Dairy Sci. 87(10):3340–3349.
- Mann S, Yepes FAL, Overton TR, Wakshlag JJ, Lock AL, Ryan CM, Nydam DV. 2015. Dry period plane of energy: effects on feed intake, energy balance, milk production, and composition in transition dairy cows. J Dairy Sci. 98(5):3366–3382.
- McArt JA, Nydam DV, Oetzel GR. 2013. Dry period and parturient predictors of early lactation hyperketonemia in dairy cattle. J Dairy Sci. 96(1):198–209.
- McArt JAA, Nydam DV, Ospina PA, Oetzel GR. 2011. A field trial on the effect of propylene glycol on milk yield and resolution of ketosis in fresh cows diagnosed with subclinical ketosis. J Dairy Sci. 94(12):6011–6020.
- Mittal M, Siddiqui MR, Tran K, Reddy SP, Malik AB. 2014. Reactive oxygen species in inflammation and tissue injury. Antioxid Redox Signal. 20(7):1126–1167.
- Mizota T, Fujita-Kambara C, Matsuya N, Hamasaki S, Fukudome T, Goto H, Nakane S, Kondo T, Matsuo H. 2009. Effect of dietary fatty acid composition on Th1/Th2 polarization in lymphocytes. JPEN J Parenter Enteral Nutr. 33(4):390–396.
- Mosmann TR, Coffman RL. 1989. TH1 and TH2 cells: different patterns of lymphokine secretion lead to different functional properties. Annu Rev Immunol. 7:145–173.
- Mosser DM, Zhang X. 2008. Interleukin-10: new perspectives on an old cytokine. Immunol Rev. 226:205–218.
- Moyes KM, Larsen T, Friggens NC, Drackley JK, Ingvartsen KL. 2009. Identification of potential markers in blood for the development of subclinical and clinical mastitis in dairy cattle at parturition and during early lactation. J Dairy Sci. 92(11):5419–5428.
- National Research Council (US) (2001). Subcommittee on dairy cattle nutrition. Nutrient requirements of dairy cattle. 7th rev. ed. Washington, DC: National Academy Press; xxi, p. 381.
- Oetzel GR. 2004. Monitoring and testing dairy herds for metabolic disease. Vet Clin North Am Food Anim Pract. 20(3):651–674.
- Ospina PA, Nydam DV, Stokol T, Overton TR. 2010. Associations of elevated nonesterified fatty acids and beta-hydroxybutyrate concentrations with early lactation reproductive performance and milk production in transition dairy cattle in the northeastern United States. J Dairy Sci. 93(4):1596–1603.
- Ospina PA, Nydam DV, Stokol T, Overton TR. 2010. Evaluation of nonesterified fatty acids and beta-hydroxybutyrate in transition dairy cattle in the northeastern United States: critical thresholds for prediction of clinical diseases. J Dairy Sci. 93(2):546–554.
- Park JS, Svetkauskaite D, He Q, Kim J-Y, Strassheim D, Ishizaka A, Abraham E. 2004. Involvement of toll-like receptors 2 and 4 in cellular activation by high mobility group box 1 protein. J Biol Chem. 279(9):7370–7377.
- Petzl W, Zerbe H, Günther J, Yang W, Seyfert H-M, Nürnberg G, Schuberth H-J. 2008. Escherichia coli, but not Staphylococcus aureus triggers an early increased expression of factors contributing to the innate immune defense in the udder of the cow. Vet Res. 39(2):18.
- Robinson TL, Sutherland IA, Sutherland J. 2007. Validation of candidate bovine reference genes for use with real-time PCR. Vet Immunol Immunopathol. 115(1–2):160–165.
- Scalia D, Lacetera N, Bernabucci U, Demeyere K, Duchateau L, Burvenich C. 2006. In vitro effects of nonesterified fatty acids on bovine neutrophils oxidative burst and viability. J Dairy Sci. 89(1):147–154.
- Sordillo LM, Contreras GA, Aitken SL. 2009. Metabolic factors affecting the inflammatory response of periparturient dairy cows. Anim Health Res Rev. 10(1):53–63.
- Sordillo LM, Raphael W. 2013. Significance of metabolic stress, lipid mobilization, and inflammation on transition cow disorders. Vet Clin North Am Food Anim Pract. 29(2):267–278.
- Stark JM, Tibbitt CA, Coquet JM. 2019. The metabolic requirements of Th2 cell differentiation. Front Immunol. 10:2318.
- Ster C, Loiselle MC, Lacasse P. 2012. Effect of postcalving serum nonesterified fatty acids concentration on the functionality of bovine immune cells. J Dairy Sci. 95(2):708–717.
- Vangroenweghe F, Rainard P, Paape M, Duchateau L, Burvenich C. 2004. Increase of Escherichia coli inoculum doses induces faster innate immune response in primiparous cows. J Dairy Sci. 87(12):4132–4144.
- Wathes DC, Cheng Z, Chowdhury W, Fenwick MA, Fitzpatrick R, Morris DG, Patton J, Murphy JJ. 2009. Negative energy balance alters global gene expression and immune responses in the uterus of postpartum dairy cows. Physiol Genomics. 39(1):1–13.
- Yamdagni S, Schultz LH. 1970. Fatty acid composition of blood plasma lipids of normal and ketotic cows. J Dairy Sci. 53(8):1046–1050.
- Yuan K, Farney JK, Mamedova LK, Sordillo LM, Bradford BJ. 2013. TNFalpha altered inflammatory responses, impaired health and productivity, but did not affect glucose or lipid metabolism in early-lactation dairy cows. PLoS One. 8(11):e80316.
- Zhang Y, Li X, Zhang H, Zhao Z, Peng Z, Wang Z, Liu G, Li X. 2018. Non-esterified fatty acids over-activate the TLR2/4-NF-Κb signaling pathway to increase inflammatory cytokine synthesis in neutrophils from ketotic cows. Cell Physiol Biochem. 48(2):827–837.