
Abstract
The eggshell colour is related to the biological functions of birds, and the colour of poultry eggshells can affect consumers' choices. This study explored the difference in the metabolite composition of duck eggshells to screen the key substances that affect the eggshell colours. The green and white duck eggshells were selected for non-targeted metabolomics analysis. We screened 402 and 512 differentially expressed metabolites in the negative and positive ion modes, respectively. Among them, 40 differentially expressed metabolites were annotated with specific names and related functions, of which the expression levels of 8 metabolites showed extremely significant differences. They were 2-heptanone, 12-hydroxydodecanoic acid, D-fructose, dodecanedioic acid, L-leucine, methyl jasmonate, palmitoleic acid, and styrene oxide. Additionally, the annotated differentially expressed metabolites were enriched in 33 metabolic pathways, including aminoacyl-tRNA biosynthesis, amino acid metabolism, galactose metabolism, etc. The results showed that the expression of metabolites between green and white eggshells differed in ducks; among metabolites with extremely significant differences in expression, the expression level of L-leucine in green eggshells was higher than that in ducks white eggshells. Therefore, we speculated that the increased expression of L-leucine promoted the response of related metabolic pathways, enhanced the expression of antioxidants, and changed the eggshell colours.
The metabolites of green and white shells were different.
40 DEMs were annotated with specific names and related functions.
The annotated DEMs were enriched in 33 metabolic pathways.
Highlights
Keywords:
Introduction
There are more than 9000 kinds of birds in the world, and they have diverse eggshell colours, such as milky white, yellow, brown, green, grey, etc. Eggshell colours have distinct functional characteristics, important in adapting birds to their living environments. Eggshell colours are adapted to the habitat to avoid predation and filter harmful solar radiation (Maurer et al. Citation2015; Medina et al. Citation2016; Liu et al. Citation2021). Meanwhile, the eggshell colour can play a thermoregulatory role in maintaining the embryo's normal development (Westmoreland et al. Citation2007). For consumers, the poultry eggshell colour is the most intuitive embodiment of egg quality. Consumers have a preference for a specific colour of eggshells (Lang and Wells Citation1987). In China, green eggshells have a good market prospect because of their dark colours, high nutritional value, and higher eggshell strength that can protect the eggs not easy to break during transporting and processing (Nys et al. Citation2004; Wang et al. Citation2007; Jonchère et al. Citation2010).
The eggshell begins to form at the oviduct shell gland, the last and longest stage in the egg formation process. The time for forming eggshells varies among species, and duck eggshell formation usually takes about 18–20 h (Wang et al. Citation2017). The eggshells are mainly composed of supersaturated Ca2+ in the uterine fluid and soluble protein matrix precursors and pigments (KetelaereGovaerts et al. Citation2002). The content and type of pigment determine the depth of eggshell colour. In 1942, Warren et al. (Warren and Conrad Citation1942) found that the distribution of pigments in each layer of the eggshell was not uniform, which proved that the eggshell pigments were deposited layer by layer. Eggshell pigments are deposited throughout the eggshell formation process, but most pigments are deposited on the eggshell 3–5 h before ovulating.
Kennedy et al. first found that the pigments in the green eggshells produced by the Araucano chickens were mainly biliverdin, biliverdin zinc chelate, and protoporphyrin (Keneddy et al. Citation1973). A more extensive survey among 108 avian species showed that biliverdin and biliverdin zinc chelate, protoporphyrin could also be detected in poultry eggshells (Kennedy et al. Citation1976; Schwartz et al. Citation1980). In recent years, some scholars have doubted the existence of biliverdin zinc chelates. They believed that the pigmentation of bird eggshells involves only two pigments, namely biliverdin, and protoporphyrin (Gorchein et al. Citation2009). These two pigments can produce almost all the colours and patterns (Wiemann et al. Citation2017). Other scholars have used colour mixing models to get similar results (Hanley et al. Citation2015).
For the green eggshells of poultry, studies showed that the content of biliverdin is higher than that of protoporphyrin. The layer-by-layer dissolution experiment in Wuding chicken showed that the content of biliverdin in the outer eggshell layer was the highest, and it was higher than that of the white eggshells (Wang et al. Citation2007). In duck, the content of biliverdin with green eggshells in Shan partridge ducks and Fei ducks was significantly higher protoporphyrin than that of the white eggshells. Other scholars had proved that the ratio of protoporphyrin to biliverdin content determined the eggshell colour (Qu Citation2012).
Metabolomics is a holistic approach towards the determination and quantification of metabolites in a biological system. The objective of non-targeted metabolomics is to identify changes in all metabolites caused by a specific factor under study (Liu et al. Citation2021). In this study, the small molecules in duck green and white shells were determined, and the differences between the two types of eggshells were compared to find out the essential substances that affect the eggshell colours. Additionally, combined metabolomic data, the small molecules affecting the colour of duck green eggshell were explored, which provided a theoretical basis for breeding green eggshell duck strains and provided a specific reference for revealing the molecular reasons of the avian eggshell colour.
Material and methods
Sample preparation
The animal study was reviewed and approved by the Animal Ethics Monitoring Committee of Sichuan Agriculture University. Written informed consent was obtained from the owners for the participation of their animals in this study. Three green-shelled and three white-shelled eggs from Peking duck were used. All duck eggshells were broken into small pieces, then the eggshells were washed with water, air dried, and stored at −20 °C for subsequent studying. Eggs were first treated with 5% EDTA and washed extensively with brushing under de-ionized water to remove cuticle; wet eggshell membranes were manually removed from shell pieces (Zhu et al. Citation2019).
Metabolite extraction
For each egg, accurately weigh 200 mg (±1%) of sample in 2 mL EP tube, add 0.6 mL 2-chlorophenylalanine (4 ppm) methanol (−20 °C), vortex for 30 s. Add 100 mg glass beads and grind the samples by a high-throughput tissue grinder (SCIENTZ-48, Zhejiang, China) for 90 s at 60 Hz. Ultrasound at room temperature (KW-100TDV, Kunshan, China) for 15 min. Centrifuge at 4 °C for 10 min at 12,000 xg , and the 300 μL supernatant was filtered through 0.22 µm membrane to obtain the prepared samples for liquid chromatography-mass spectrometry (LC-MS) analysis. Take 20 µL from each sample to the quality control (QC) samples. The use the rest of the samples for LC-MS detection (Sangster et al. Citation2006; Want et al. Citation2013).
LC-MS analysis
Chromatographic separation was accomplished in a Thermo Vanquish (Thermo Fisher Technologies, Shanghai, China) system equipped with an ACQUITY UPLC® HSS T3 (150 × 2.1 mm, 1.8 µm, Waters, Milford, MA) column, and the chromatogram was kept at 40 °C. The temperature of the autosampler was 8 °C. Gradient elution of analytes was carried out with 0.1% formic acid in water (B) and 0.1% formic acid in acetonitrile (A) at a flow rate of 0.25 mL/min. Injection of 2 μL of each sample was done after equilibration. An increasing linear gradient of solvent A (v/v) is used in Table S1.
The ESI-MSn experiments were executed on the Thermo Q Exactive Plus mass spectrometer with the spray voltage of 3.8 kV and −2.5 kV in positive and negative modes, respectively. Sheath gas and auxiliary gas were set at 30 and 10 arbitrary units, respectively. The capillary temperature was 325 °C. The analyser scanned over a mass range of m/z 81–1000 for the full scan at a mass resolution of 70 000. Data-dependent acquisition (DDA) MS/MS experiments were performed with an HCD scan. The normalised collision energy was 30 eV. Dynamic exclusion was implemented to remove some unnecessary information in MS/MS spectra (Wilson et al. Citation2010).
Data quality assessment
Mix 20 µL of sample supernatant to prepare quality control (QC) samples. According to the overlapping base peak ion chromatograms (BPCs) of the QC samples, the data's repeatability and the instrument's stability were evaluated. The residual material was determined by using the BPCs of blank samples.
Data processing and analysis
After using Proteowizard (v3.0.8789) to convert the original data into mzXML format, use XCMS software to perform a series of operations, including peak alignment, retention time correction, and peak area extraction. The main parameters are bw = 2, ppm = 15, peak width = C (5, 30), mzwid = 0.015, mzdiff = 0.01, method = centWave. The ion peak of missing data (>50%) was deleted from the XCMS data, and the Perato scaling method was used for normalisation (Smith et al. Citation2006). The obtained data matrix was exported to Microsoft Excel for subsequent analysis.
Statistical analysis
Principal component analysis (PCA) and partial least squares discriminant analysis (PLS-DA) were performed on the metabolic data of all samples to assess the metabolite diversity between and within-group samples. Use Metaboanalyst 3.0 software for multivariate and univariate statistical analysis, including supervised partial least squares discriminant analysis (PLS-DA), fold-change, t-test (p < .05), and one-way ANOVA at p < .01 (Benton et al. Citation2015). Analysing metabolic pathways were based on the Kyoto Encyclopaedia of Genes and Genomes database (Kanehisa and Goto Citation2000).
Data were analysed using the SPSS statistical software (version 20.0, Windows. SPSS Inc., Chicago, IL). T-test and one-way ANOVA were used to analyse the differences between groups. The value of p < .05 was considered statistically significant. Box plots were used to reflect significant differences between the metabolites. The graph is drawn with GraphPad Prism (version 8.3) and R studio (version 4.0.2, GraphPad Software, La Jolla, CA).
Results and analysis
Qualitative analysis of metabolites
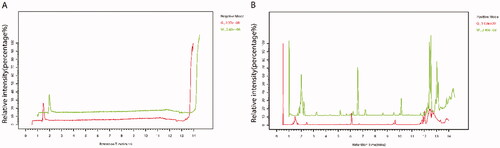
The base peak chromatograms (BPC) obtained in the negative and positive ion modes showed that the chromatographic peaks of the green and white eggshells were significantly different (Figure ). Most of the chromatographic peak heights of white shells were higher than those of green shells. The results implied that the metabolites of green and white shells were different.
Figure 1. Base peak chromatogram. A, base peak chromatogram in negative ion mode; B, base peak chromatogram in positive ion mode. The components that flow out after chromatographic separation continue to enter the mass spectrum, and the mass spectrum is continuously scanned for data collection. A mass spectrum is obtained for each scan, and the ions with the highest intensity in each mass spectrum are selected for continuous depiction. Take the ion intensity as the ordinate and time as the abscissa to get the spectrum. In the image, W represents white shell eggs, and G represents green shell eggs. The peaks of white shells were larger than those of green shells.
Principal component analysis (PCA) is used to check the quality of the analysed data. The results showed that all QC samples were within the 95% confidence interval, and the QC samples (red) had good repeatability (Figure ). It indicated that the analytical instrument had high confidence, and there was no mechanical error. The data points of the green and white shell groups could be clearly distinguished on the score chart, indicating that the metabolites in the two groups of samples were significantly different.
Figure 2. Quality control and partial least squares discriminant analysis (PLS-DA). (A) Principal component analysis (PCA) score plot in negative ion mode; (B) PCA score plot in positive ion mode. In the images, the abscissas PC1 and the ordinates PC2 represented the scores of the first and second principal components, respectively. The scattered colour represented the experimental grouping of samples and QC, and the confidence interval (CI) was 95%. (C) PLS-DA score plot in negative ion mode; (D) PLS-DA score plot in positive ion mode; (E) permutation test plot of PLS-DA model in negative ions; (F) permutation test plot of PLS-DA model in positive ions. The abscissas of E and F represented the correlation between the Y of the random grouping and the original group Y, and the ordinates represented the R2 and Q2.
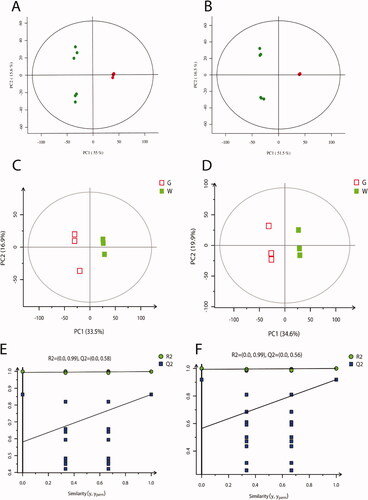
This study performed partial least squares discrimination analysis (PLS-DA) on the two groups of eggshell samples. PLS-DA is a supervised discriminant analysis statistical method. The PLS-DA score plots (Figure ) showed that the green and white shell samples were significantly separated in the positive and negative ion modes. In the negative ion mode, the R2Y value of the PLS-DA model between the green and white shell groups was 0.999, and the Q2 value was 0.863; the R2Y value of the PLS-DA model was 1.000 in the positive ion mode, and the Q2 value was 0.919. The R2Y and Q2 values were close to 1.0 in the positive and negative ion modes, and the gap was less than 0.2, indicating that the PLS-DA model had good stability and strong predictive power. The permutation tests showed that the model was not overfitting (Figure ).
Screening and identification of differential expressed metabolites
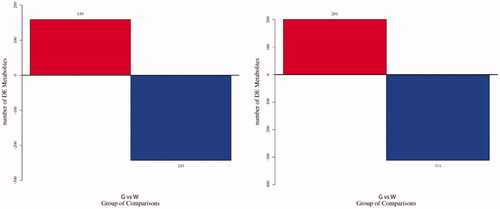
The variable importance in the projection (VIP) value of the first principal component of the OPLS-DA model was combined with the p-value of the T-test to screen differentially expressed metabolites (DEMs). The threshold values were set as VIP ≥ 1.0 and p-value ≤ .05. The fold change (FC) ≥ 1.5 meant up-regulation of DEM, and FC ≤ 0.667 meant down-regulation of DEM. The data analysis showed 402 DEMs in the negative ion mode, of which 159 DEMs were up-regulated, and 243 DEMs were down-regulated; In the positive ion mode, there were 512 DEMs, of which 201 DEMs were up-regulated, and 311 DEMs were down-regulated (Figure ). From the screened DEMs annotated to 40 DEMs with specific names and related functions (Table S1). The 11 DEMs were up-regulated (FC ≥ 1.5), such as l-leucine, 12-hydroxydodecanoic acid, and 24 DEMs were down-regulated (FC ≤ 0.667), such as methyl jasmonate, 2-heptanone, and styrene oxide.
Figure 3. Histogram of differentially expressed metabolites (DEMs). (A) Histogram of DEMs in negative ion mode; (B) histogram of DEMs in positive ion mode. G stands for the green shell, W stands for the white shell.
Heat map analysis
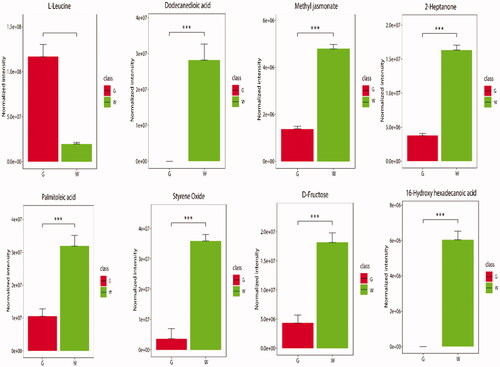
Visual cluster analysis of 40 DEMs based on Pearson correlation coefficient (Figure ). The 40 identified compounds were generally divided into two branches; Branch 1 contained 26 compounds, and branch 2 contained 14 compounds; the identified DEMs had differences between the two branches. Comparing each DEM in the green and white shells, we found extremely significant differences in 8 DEMs (Figure ). These included 2-heptanone, 16-hydroxyhexadecanoic acid, D-fructose, dodecanedioic acid, L-leucine, methyl jasmonate, palmitoleic acid, and styrene oxide. Except for L-leucine, the other 7 DEMs were expressed at higher levels in white shell eggs.
Figure 4. Heat map of differentially expressed metabolites (DEMs). Each column represents a sample, and each row represents a metabolite. The colour in the image indicates the relative expression levels of metabolites in the sample group, and the change from blue to red indicates an increase in the relative expression levels. G stands for the green shell, W stands for the white shell.
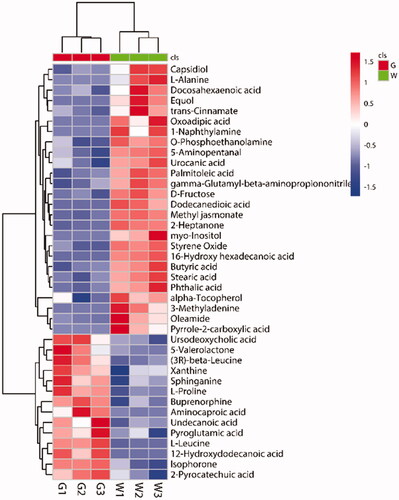
Figure 5. 8 differentially expressed metabolites (DEMs) with extremely significant differences in expression. The histogram area shows the expression level of DEMs in eggshells with different colours. G stands for the green shell, W stands for the white shell.
Kegg enrichment analysis
The annotated DEMs were enriched in 33 metabolic pathways, including aminoacyl-tRNA biosynthesis, amino acid metabolism, galactose metabolism, etc. (Table S2). The most enriched pathway was the ABC transport pathway, which was enriched with 6 DEMs. The aminoacyl-tRNA biosynthetic pathway was enriched with 3 DEMs, 7 metabolic pathways were enriched with 2 DEMs, and the remaining 24 pathways were enriched with only 1 DEM. In the degree of DEMs involved in the pathway, L-alanine was involved in most pathways, followed by L-leucine and myo-Inositol, which were involved in the same number of pathways. D-Fructose ranked third in the number of pathways, involving four pathways.
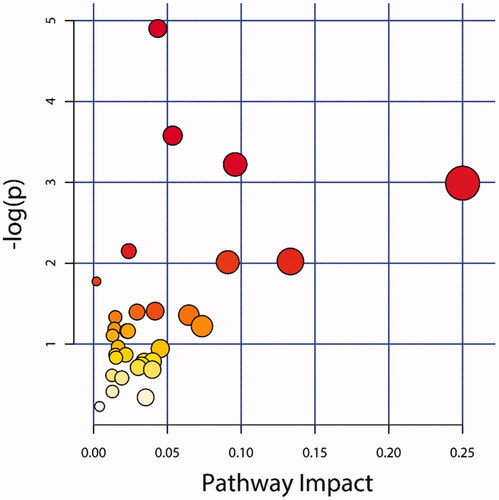
There were seven metabolic pathways, and the pathway impact value was more than 0.05 (Figure ). They were aminoacyl tRNA biosynthesis, sphingolipid metabolism, mTOR signalling pathway, lysine degradation, selenium compound metabolism, sulphur delivery system, and biosynthetic pathways of valine, L-leucine, and isoleucine. The pathway impact value of the mTOR signal pathway was 0.250, and the pathway impact value of the sulphur delivery system was 0.134.
Figure 6. KEGG pathway enrichment analysis. The X-axis represented the pathway impact value. Large size and dark colour represented the main pathway enriched and the high pathway impact value, respectively.
Discussions
The ratio of protoporphyrin to biliverdin content determines the eggshell colours (Hargitai et al. Citation2016), and the ratio is related to the breed and the laying age of the hen (Bi et al. Citation2018). Generally, the eggshell becomes paler as the laying period progresses (Tumova and Ledvinka Citation2009; Zita et al. Citation2009). There is a positive correlation between the eggshell pigment content and eggshell strength, thickness, and eggshell weight (Cassey et al. Citation2012; Wilson Citation2017). This study completed the screening, identification, and analysis of the tested substances. It revealed the similarities and differences of small molecular metabolites between green and white eggshells in ducks, using non-targeted metabolomics technology based on bioinformatics.
The eggshell is mainly composed of inorganic matter, accounting for 94–97% of the entire eggshell, and the organic matter accounts for 3–6%. In addition to compounds, eggshells also contain various trace elements, such as zinc, copper, manganese, iron, selenium, etc. (Moskát et al. Citation2014). The eggshell organic matters are mainly the protein matrix, and these protein matrices contain 18 kinds of amino acids, primarily threonine, glycine, serine, alanine, tyrosine, and leucine (Yao and Pu Citation1998). In this study, the DEMs identified in duck green and white shells are partly consistent with the previous results of eggshell components; that is, the organic matter of eggshell contains alanine, L-leucine, proline, and other protein matrices. In addition, other DEMs such as 2-heptanone, D-fructose, and stearic acid were identified by using non-targeted metabolomics technology.
There were extremely significant differences in 8 DEMs. Only L-leucine expressed in green shells was higher than that in white shells. Valine, leucine and isoleucine are branched chain amino acids (BCAA), and the most important of BCAAs is leucine. BCAAs, cysteine, and methionine all have strong antioxidant activity (Willke Citation2014; Jin et al. Citation2015). In the study of canary eggshells, researchers found that adding antioxidants can increase the blue-green degree of the eggshell (Hargitai et al. Citation2016). Another study showed that females who added carotenoids increased the colour of their second egg compared to a control group and that the increase in colour was independent of the pigment previously assigned to the first egg (Morales et al. Citation2011). The results of this study supported the conclusion that green eggshells had strong antioxidant activity. Cysteine can covalently link proteins and bile pigments to form phycocyanin or phycoerythrin. Phycoerythrin and biliverdin are isomers of each other and have similar chemical structures (Ju et al. Citation2016). We speculated that the most likely reason is that the metabolites with antioxidant activity are involved in metabolic pathways that may make eggshells green or darker.
In this study, a total of 33 metabolic pathways were enriched with the annotated DEMs. The metabolic pathway enriched with the most DEMs was the ABC transport pathway, followed by the aminoacyl-tRNA biosynthesis pathway. L-Leucine is involved in five metabolic pathways, namely the ABC transport pathway, aminoacyl-tRNA biosynthesis pathway, cysteine and methionine metabolism, degradation of valine, leucine, and isoleucine, and biosynthesis of valine, leucine, and isoleucine. ABC transporters are membrane proteins that participate in various cellular processes by transporting ions, sugars, amino acids, vitamins, peptides, polysaccharides, hormones, lipids, and other substances (Jones et al. Citation2004). Aminoacyl-tRNA is the substrate for translation, accurately matching amino acids with tRNAs containing corresponding anti-codons (Ibba and Söll Citation2000). The metabolic pathway of L-leucine is mainly involved in the synthesis and degradation of amino acids and the transport of amino acids. We speculated that the high expression of L-leucine promoted the response of related metabolic pathways, enhanced the expression of antioxidants, and changed the eggshell colours. In future studies, we can quantify the changes in substance concentration by using drugs that inhibit antioxidant activity, and the results may provide a reference for the formation mechanism of eggshell colour.
Conclusions
Our results found that among the 8 DEMs with extremely significant differences in expression levels, only L-leucine was expressed in green shell duck eggs higher than that in white shell duck eggs. At the same time, L-leucine was involved in several metabolic pathways related to the metabolism of substances with strong antioxidant activity. It supports the conclusion that green eggshells have strong antioxidant activity, but how exactly metabolites affect the colour expression of eggshells still needs to be studied.
Ethical approval
The animal study was reviewed and approved by the Animal Ethics Monitoring Committee of Sichuan Agriculture University. Written informed consent was obtained from the owners for the participation of their animals in this study.
Disclosure statement
The authors declare no conflict of interest.
Data availability statement
All data generated and analysed during this study are included in this published article.
Additional information
Funding
References
- Benton HP, Ivanisevic J, Mahieu NG, Kurczy ME, Johnson CH, Franco L, Rinehart D, Valentine E, Gowda H, Ubhi BK, et al. 2015. Autonomous metabolomics for rapid metabolite identification in global profiling. Anal Chem. 87(2):884–891.
- Bi H, Liu Z, Sun C, Li G, Wu G, Shi F, Liu A, Yang N. 2018. Brown eggshell fading with layer ageing: dynamic change in the content of protoporphyrin IX. Poultr Sci. 97(6):1948–1953.
- Cassey P, Thomas GH, Portugal SJ, Maurer G, Hauber ME, Grim T, Lovell PG, 2012. Why are birds’ eggs colourful? Eggshell pigments co-vary with life-history and nesting ecology among British breeding non-passerine birds. 106(3): 657–672.
- Gorchein A, Lim CK, Cassey PJBC. 2009. Extraction and analysis of colourful eggshell pigments using HPLC and HPLC/electrospray ionization tandem mass spectrometry. Biomed Chromatogr. 23(6):602–606.
- Hanley D, Grim T, Cassey P, Hauber MEJBL. 2015. Not so colourful after all: eggshell pigments constrain avian eggshell colour space. Biol Lett. 11(5):20150087–20150087.
- Hargitai R, Boross N, Nyiri Z, Eke Z. 2016. Biliverdin- and protoporphyrin-based eggshell pigmentation in relation to antioxidant supplementation, female characteristics and egg traits in the canary (Serinus canaria). Behav Ecol Sociobiol. 70(12):2093–2110.
- Ibba M, Söll D. 2000. Aminoacyl-tRNA synthesis. Annu Rev Biochem. 69(1):617–650.
- Medina I, Naomi E, Reviews LJB. 2016. The evolution of acceptance and tolerance in hosts of avian brood parasites. Biol Rev Camb Philos Soc. 91(3):569–577.
- Jin HJ, Lee JH, Kim DH, Kim K-T, Lee GW, Choi SJ, Chang P-S, Paik H-D. 2015. Antioxidative and nitric oxide scavenging activity of branched-chain amino acids. Food Sci Biotechnol. 24(4):1555–1558.
- Jonchère V, Réhault-Godbert S, Hennequet-Antier C, Cabau C, Sibut V, Cogburn LA, Nys Y, Gautron JJBG. 2010. Gene expression profiling to identify eggshell proteins involved in physical defense of the chicken egg. BMC Genom. 11(1):57.
- Jones P, George AJC, Cmls MLS. 2004. The ABC transporter structure and mechanism: perspectives on recent research. Cell Mol Life Sci. 61(6):682–699.
- Ju ZY, Viljoen C, Hutchinson P, Reinicke J, Horgen FD, Howard L, Lee C‐S. 2016. Effects of diets on the growth performance and shell pigmentation of Pacific abalone. Aquac Res. 47(12):4004–4014.
- Kanehisa M, Goto SJ. 2000. KEGG: kyoto encyclopedia of genes and genomes. Nucleic Acids Res. 28(1):27–30.
- Keneddy G, Vevers HJCB, Biochemistry PPBC. 1973. Eggshell pigments of the Araucano fowl. Comp Biochem Physiol B. 44(1):11–25.
- Kennedy GY, Vevers HGJCB, Biochemistry PPBC. 1976. A survey of avian eggshell pigments. Comp Biochem Physiol B. 55(1):117–123.
- Ketelaere B, Govaerts T, Coucke P, Dewil E, Visscher J, Decuypere E, Baerdemaeker JDJBPS. 2002. Measuring the eggshell strength of 6 different genetic strains of laying hens: techniques and comparisons. Br Poult Sci. 43(2):238–244.
- Lang MR, Wells JW. 1987. A review of eggshell pigmentation. World's Poult Sci J. 43(3):238–246.
- Liu H, Hu J, Guo Z, Fan W, Xu Y, Liang S, Liu D, Zhang Y, Xie M, Tang J, et al. 2021. A single nucleotide polymorphism variant located in the cis-regulatory region of the ABCG2 gene is associated with mallard egg colour. Mol Ecol. 30(6):1477–1491.
- Maurer G, Portugal SJ, Hauber ME, Mikšík I, Russell D, Cassey PJFE. 2015. First light for avian embryos: eggshell thickness and pigmentation mediate variation in development and UV exposure in wild bird eggs. Funct Ecol. 29: 209–218.
- Morales J, Velando A, Torres RJBE. 2011. Biliverdin-based egg coloration is enhanced by carotenoid supplementation. Behav Ecol Sociobiol. 65(2):197–203.
- Moskát C, Bán M, Hauber ME. 2014. Naïve hosts of avian brood parasites accept foreign eggs, whereas older hosts fine-tune foreign egg discrimination during laying. Front Zool. 11(1):45.
- Nys Y, Gautron J, Garcia-Ruiz JM, Hincke MT. 2004. Avian eggshell mineralization: biochemical and functional characterization of matrix proteins. CR Palevol. 3(6–7):549–562.
- Qu B. 2012. Analysis of green shell duck egg quality and egg shell pigment. Anim Husbandry Vet Med. 52:3150–3152.
- Sangster T, Major H, Plumb R, Wilson AJ, Wilson IDJTA. 2006. A pragmatic and readily implemented quality control strategy for HPLC-MS and GC-MS-based metabonomic analysis. Analyst. 131(10):1075–1078.
- Schwartz S, Raux WA, Schacter BA, Stephenson BD, Shoffner RN. 1980. Loss of hereditary uterine protoporphyria through chromosomal rearrangement in mutant Rhode Island Red hens. Int J Biochem. 12(5–6):935–940.
- Smith CA, Want EJ, O'Maille G, Abagyan R, Siuzdak GJ. 2006. XCMS: processing mass spectrometry data for metabolite profiling using nonlinear peak alignment, matching, and identification. Anal Chem. 78(3):779–787.
- Tumova E, Ledvinka Z. 2009. The effect of time of oviposition and age on egg weight, egg components weight and eggshell quality. Archiv Fur Geflugelkunde. 73(2):110–115.
- Wang XT, Deng XM, Zhao CJ, Li JY, Xu GY, Lian LS, Wu CXJP. 2007. Study of the deposition process of eggshell pigments using an improved dissolution method. Poult Sci. 86(10):2236–2238.
- Wang Z, Meng G, Bai Y, Liu R, Du Y, Su LJBG. 2017. Comparative transcriptome analysis provides clues to molecular mechanisms underlying blue-green eggshell color in the Jinding Duck (Anas platyrhynchos). BMC Genom. 18(1):725.
- Want EJ, Masson P, Michopoulos F, Wilson ID, Theodoridis G, Plumb RS, Shockcor J, Loftus N, Holmes E, Nicholson JKJNP. 2013. Global metabolic profiling of animal and human tissues via UPLC-MS. Nat Protoc. 8(1):17–32.
- Warren D, Conrad RJPS. 1942. Time of pigment deposition in brown shelled hen eggs and in turkey eggs. Poultr Sci. 21(6):515–520.
- Westmoreland D, Schmitz M, Burns KE. 2007. Egg color as an adaptation for thermoregulation. J Field Ornithol. 78(2):176–183.
- Wiemann J, Yang TR, Sander PN, Schneider M, Sander PMJP. 2017. Dinosaur origin of egg color: oviraptors laid blue-green eggs. Peer J. 5(2)
- Willke T. 2014. Methionine production-a critical review. Appl Microbiol Biotechnol. 98(24):9893–9914.
- Wilson ID, Gika H, Theodoridis G, Plumb RS, Shockcor J, Holmes E, Nicholson JK, Want EJJNP. 2010. Global metabolic profiling procedures for urine using UPLC-MS. Nat Protoc. 5(6):1005–1018.
- Wilson PBJP. 2017. Recent advances in avian egg science: a review. Poult Sci. 96(10):3747–3754.
- Yao Y, Pu Y. 1998. Analysis of amino acids in egg shells by gas chromatography-mass spectrometry. J Yanbian Univ: Nat Sci Ed. 24:25–27.
- Zhu F, Zhang F, Hincke M, Yin Z, Chen S, Yang N, Hou ZJP. 2019. iTRAQ‐based quantitative proteomic analysis of duck eggshell during biomineralization. Proteomics. 19(11):e1900011.
- Zita L, Tůmová E, Štolc L. 2009. Effects of genotype, age and their interaction on egg quality in brown-egg laying hens. Acta Vet Brno. 78(1):85–91.