
 ?Mathematical formulae have been encoded as MathML and are displayed in this HTML version using MathJax in order to improve their display. Uncheck the box to turn MathJax off. This feature requires Javascript. Click on a formula to zoom.
Abstract
Sixty-six dairy farms (as average, 167.0 ± 106.5 milking cows and milk yield of 31.4 ± 5.1) were visited to identify different nutritional approaches adopted in dairy cows diet formulation. Forage, TMR, faecal, and milk samples from lactating herds were collected and diet composition, in vitro methane production, in vivo nutrient digestibility, faecal fermentation profile and milk yield and milk quality were characterised. A hierarchical cluster analysis was applied and six nutritional approaches in diet formulation corresponding with six different clusters (CL) were identified. The CL discriminated the farm feeding choices in the following nutritional strategies, based on high use of: (i) high moisture corn (HMC) and legume silage, (ii) compound feed, (iii) corn and soy meals, (iv) HMC and soy meal, (v) corn meal and protein compound feeds, or (vi) HMC and protein compound feed strategies, respectively for CL1 to CL6. The milk yield tended (p = .061) to differ among CL. The greatest (>1.60) feed efficiency was calculated for CL1 and 5, whereas the lowest (<1.45) for CL 2. The CL2 and 5 had the highest feed costs (i.e. 0.24 or 0.22 €/kg of milk, respectively). Interestingly, the high use of HMC or steam flaked corn resulted associated to higher farm performances. Particularly, HMC and legume silage (CL1), HCM and soy meal (CL4) and HCM and protein compound feed (CL6) nutritional strategies resulted more efficient and profitable, having the greatest feed efficiency, protein and starch degradability as well as income over feed costs. Differentiate carbohydrates in dairy cow diets seems highly convenient.
Six different nutritional strategies were identified based on use of single ingredients and a great variability in both economic and feed efficiency was observed for dairy farms clustering into different groups
The use of high moisture ear corn in substitution of corn meal increased dry matter intake, feed efficiency, milk yield and lactose content of milk, whereas the use of steam flaked corn reduced the faecal fermentations
The in vitro methane emission potential of diets did not differ among clustered nutritional strategies
HIGHLIGHTS
Introduction
Managerial capacity and approaches, including the adoption of a correct nutritional strategy, are highly associated with good farm performances and efficiency use of resources, representing key factors of dairy farm production sustainability for intensive farms, either in terms of environmental impact, animal welfare, animal health or farm profitability, thus regarding environmental, economic and social sustainability of dairy farm system (de Ondarza and Tricarico Citation2017; Bellingeri et al. Citation2020). The nutritional management appears essential to improve farm performances and to promote environmental sustainability (de Souza et al. Citation2019). The feeding costs, which includes the expenses for purchased feed but also the costs of feed cultivation and crops, usually constitutes a very large part of production cost of dairy farms, sometimes more than 60% of the total cost of producing milk (Bellingeri et al. Citation2019). Consequently, the adoption of correct feeding strategies, including a properly planned crop planting system over years as well as the correct allocation of home-growth forage into diets of specific animal groups, is of fundamental importance for increasing the final revenue and economic sustainability of dairy farms (Cabrera et al. Citation2010; Bach et al. Citation2020; Bellingeri et al. Citation2020). The specific indicators of economic sustainability, applied at farm level with managerial purposes, traditionally refers to the returns of cash costs of production (i.e. profitability) to the productivity of owned factors of production (i.e. productivity of land) and market orientation (Hennessy et al. Citation2013). Those are essential from the perspective of longer-term competitiveness since sustainability means maintaining performances over time (Turner et al., Citation2016). Recently, the term has been generally extended to a more holistic perspective that refers to practices that support long-term economic growth of farm enterprise without negatively influencing its social and cultural aspects and environmental constraints such as methane emissions. In this sense, even when evaluating nutritional strategies, it is important to stress the role of indicators that keeping focus on nutrient use efficiency are also able to increase awareness on profitability of production process and on undesirable outputs (such as methane emissions in ruminants). Otherwise, the appropriate choice of concentrates among the large alternative on the market availability has a relevant impact on diet utilisation or animal and farm performances, both at technical and economic terms (Bach et al. Citation2020). The nutritional strategy adopted in the dairy farms represent an important economic consequence for dairy farm profitability: economic returns can be improved by either maximising milk income or minimising dietary costs while maintaining fixed revenues from milk or even, especially in high price volatility conditions, slightly decreasing it (Skevas et al. Citation2020). Therefore, a nutritional strategy should be able to maximise feed efficiency (FE), which is commonly defined as the ratio between milk output and feed input (Atzori et al. Citation2021) or the relative ability of cows to convert feed nutrients into milk or its components (Bach et al. Citation2020), and maximise milk yield or to reduce expense of maintenance requirements could favour greater production per cow thus diluting the fixed nutritional costs of maintenance and unproductive categories (VandeHaar and St-Pierre Citation2006; Atzori et al. Citation2013).
In Northern Italy, corn silage makes up to 90% of the forage component in the lactating cow diet because of the soil fertility, favourable climate for corn silage, and its high DM yield potential per hectare (Borreani et al. Citation2013; Bellingeri et al. Citation2019). As a result, most dairy farms in this area adopted nutritional strategies based on use of TMR in which corn silage represents the main ingredient of the dairy rations, in combination or not with other grass, legume or grass-legume silages (Gislon, Bava, et al. Citation2020). Many of these dairy farms are almost self-sufficient for the energy requirements, but highly dependent for the protein sources from the market. This has led to a simplification of the cropping system and consequently diet formulations, even if farmers remain exposed to the market volatility for purchased feeds, which mainly consist of concentrate supply. This economic uncertainty represents one of the main economic challenges of dairy farm sector (Valvekar et al. Citation2010; Bellingeri et al. Citation2019). Moreover, the large use of corn silage in farm cropping system has been recently questioned, mainly because (i) installation of many biogas plants increased both competition of available arable land and land costs cultivation for corn used in dairy cow diets, (ii) climate change that have influenced more persistent drought conditions in summer, (iii) the aflatoxin and other mycotoxin issues, or (iv) new and more aggressive corn pests related to cultivation of corn silage, as previously summarised by Bellingeri et al. (Citation2019). All these new issues have resulted in an increased uncertainty about the corn silage-based dairy farming system, leading a discussion on which silage should be used in dairy rations (e.g. other grass and legume silages) or which amount and kind of purchased feeds should be got on market to decrease farm externalisation (Bellingeri et al. Citation2020).
Thus, it would be very useful to identify the different nutritional strategies adopted to feed lactating cows with dairy rations based on use of silage, in particular corn silage. On the best of our knowledge, in the intensive dairy farm system, a previous study determined the relationship among dietary strategies and feed efficiency and methane emissions in Northern Italy (Gislon, Bava, et al. 2020), but no attempts were previously carried out with the specific aim of clustering different nutritional approaches by adopting opportune statistical analysis and evaluate the nutritional and economic performances of dairy herds. Consequently, the main objective of this work was: (i) to verify if multivariate statistical technique can identify nutritional strategies of feed choice for diet formulation; (ii) to associate nutritional strategies to differences for economic, nutritional, environmental as well as performance efficiency of the dairy herds using corn silage as basic feed; (iii) to provide benchmarking values within specific nutritional strategy categories, useful to promote improved feeding management in areas on which corn silage is the dietary basis. A study of relationships among nutritional parameters and parameters characterising animal or herd efficiency was also carried out within these purposes.
Material and methods
Dairy farm survey and diet
A survey was conducted between January 2018 and June 2018 considering that this is the period of the year with the highest productive performances and less influence due to seasonal changes on herd composition, milk quality and silage bunker. In particular, a total of 66 commercial dairy farms of a specific area of Italy (i.e. Po valley) were selected based on previous knowledge of these farms recording the most and the best quality data (Bellingeri et al. Citation2019, Citation2020) and visited to represent different ranges in milk yield, herd management and feeding strategies. These farms could be considered representative of intensive dairy farm system in Italy, raising Holstein-Friesian cows, housed in free-stall barns, fed TMR and with no access to pasture. In general, farms had a single diet for lactating cows, a single diet for dry cows, and two diets for heifers (from weaning to first calving), except for two dairy farms that divided the lactating dairy cows in two groups, being early- (<150 days in milk or DIM) and late-lactation (>150 DIM) cows. Farmers were contacted by telephone call and then interviewed in person by trained people. During interview, information on herd characteristics (i.e. number of heifers, dry cows, lactating primiparous and pluriparous cow in the herds, DIM, average number of lactations, milk price, average milk yield and quality) and nutritional management strategies (i.e. feeding groups for lactating herds, frequency of ration balancing, feeding system, use of auto feeders, and mineral-vitamins supplementation) were collected. Furthermore, dietary information for milking groups were also requested (type, amount and costs of each feed used in daily offered rations). Regarding the home-produced forages, the costs was considered fixed and typical for specific area in which dairy farms were located. This information was based on previous survey on home-grown forage carried out in the same area by Bellingeri et al. (Citation2019).
The single feeds used in the rations were then aggregated or not in specific feed categories as follow: corn silage (CS); high moisture ear corn (HMC); alfalfa silage (LS); small-grain (mainly wheat, barley and triticale) or annual crops of ryegrass (Lolium multiflorum, Lam.; var westervoldicum) silage (GS); alfalfa hay (LH); hay from perennial ryegrass (Lolium multiflorum L.; var. Italicum) or from annual ryegrass (GH); straw (STRAW); distillers dried grains with solubles, soft white wheat bran and other by-products of wheat grains, pressed beet pulp, brewers grains (ByProduct); solvent-extracted soybean meal and de-hulled soybean meal (HVProteinFeed); steam-flaked, expeller or extruded soybean (TRTProteinFeed); solvent-extracted rapeseed meal and solvent-extracted sunflower meal (LVProteinFeed); corn meal (YellowStarchFeed); barley, wheat and triticale meals (WhiteStarchFeed); steam flaked corn (TRTStarchFeed); soybean grain and flax seed (FullFatSeed); fats (FatFeed); cotton seeds (CottonSeed); maltodextrins, sugarcane and beet molasses (Molasses); mineral-vitamin-salt supplements and other additives (MinVit); compound feeds, used in more than 3.5 kg/cow per day, with a CP concentration lower than 21% as fed (StarchCompoundFeed); compound feeds, used in more than 3.5 kg/cow per day, with a CP concentration higher than 30% as fed (ProteinCompoundFeed); compound feeds, used in less than 3.5 kg/cow per day, with a CP concentration between 21% and 30% as fed (ProteinRestrictedFeed). When possible, information about the exact compound feeds formula was obtained, otherwise the classification in these categories was based on the label.
The Nutrient Requirements of Dairy Cattle (NRC Citation2001) was used for recreating the farm diets within the software RazioBest (version 5.30, edited by Luigi Calamari, Università Cattolica del Sacro Cuore, Piacenza, Italy) with the objective to estimate animal requirements, energy supply, energy use efficiency and energy balance as below detailed. As indicative average, the requirements were calculated for lactating dairy cow of 47 months of age, 650 kg of body weight (BW), 60 pregnancy days, 150 days from calving, 2 lactations, Holstein-Friesian as breed, 13 months as calving interval, 29 months as age at first calving, and a body condition score of 3.0 (scale 1–5). The other nutritional inputs in the software were filled by using information gathered in each dairy farm. Furthermore, specific environmental data (temperature, wind speed, and humidity) were used in agreement to the day of TMR sampling. The chemical composition of all forage ingredients (i.e. CS, HMC, LS, GS, LH, GH, Straw) used in farm rations were characterised as described below and these values were used in diet formulation. For StarchCompoundFeed, ProteinCompoundFeed, and ProteinRestrictedFeed, the chemical parameters reported on the label were used. For all other feeds, we referred to nutritional NRC (Citation2001) database.
Farm performance calculations and technical indexes
Technical and economic parameters were calculated for each farm based on collected inputs, and they were: the 4.0% of Fat Corrected Milk (4% FCM; NRC Citation2001) and the Energy Corrected Milk (ECM; milk normalised for energy contents considering 3.50% of fat and 3.20% of protein; NRC Citation2001). Other inputs gathered were: observed DMI (real DMI), obtained as the difference between the amount of feed delivered to lactating dairy cow groups and estimation of the residual orts in the feeder, as declared by the farmer the successive day of the interview; the FE specifically indicated the ratio between the kilograms of FCM4.0 produced over the kilograms of dry matter consumed by lactating animals; the metabolisable energy efficiency (MEE), representing the ability of cows to convert the daily metabolisable energy supply into milk energy; or the net energy efficiency (NEE), being the ability of animals to transform the net energy of diet into milk energy (VandeHaar and St-Pierre Citation2006). The residual energy intake (RFI), representing the difference between what dairy cow consumed and what it was predicted to consume, was also calculated (Atzori et al. Citation2021). The economic indexes such as income over feed costs (IOFC, €/cow/day), income equal feed costs (IEFC, l/cow/day) and feed cost per hundredweight of milk (Feed Cost, €/kg of milk) were also calculated as reported by Atzori et al. (Citation2021). They were calculated taking into account data gathered on only lactating animals and not the unproductive categories and referring to feed costs declared by each farm for purchased feeds or applying the local market price to home-grown produced feeds (mainly hay and silage; Bellingeri et al. Citation2019).
On-site collection of samples and analysis
On-site sample collection included forage (silage, haylage and hay), TMR, faecal (at least from 10 lactating dairy cows representative of whole lactating herd), and raw bulk tank milk samples from lactating herds. Samples were collected the day of farm visit. In two dairy farms in which these samples were collected, the lactating dairy cows were grouped in early- and late-lactation cows. The TMR and faecal samples were collected from both groups and proportionally pooled based on group herd consistency, meaning the number of cows in each group. Samples were placed inside portable freezers and transported to the laboratory for successive evaluations as detailed below. In particular, the forage and TMR samples were dried in a forced-air oven (60 °C, 48 h) for DM determination. These samples were ground to pass at 0.5 mm for near-infra-red spectroscopy (NIR) analysis and a 1 mm screen for gas production test. In particular, the forage samples were characterised by a Foss (Hilleroed, Denmark) NIR systems 5000 spectrophotometer equipped with a monochromator and transport module, scanning over the wavelength range 400–2500 nm, every 2 nm. The calibrations used to obtain TMR and forage characterisations were produced by a commercial forage testing laboratory (CRPA Lab, Reggio Emilia, Italy) and samples were analysed for ash, crude protein (CP), soluble CP, NDF, ADF, ADL, NDF degradability evaluated after 24 h of rumen incubation, ether extract (EE), starch, sugar, neutral detergent insoluble CP (NDICP), acid detergent insoluble CP (ADICP).
The TMR samples were characterised for gas production using a procedure previously described (Pirondini et al. Citation2015) and modified to specific conditions of this observational study. A deeply description of adopted procedures to measure gas production kinetics parameters, methane into bottle headspace and volatile fatty acids (VFA) in buffered rumen fluid at different times of incubations were reported by Ghilardelli et al. (Citation2022). Animal care was in accordance with the European Commission Council Directive guidelines (EU, Citation2010) for animals used for experimental and other scientific purposes.
The faecal samples were collected and stored in box with ice, where they are kept during transport to lab. Then, faecal samples were frozen at −20 °C before analysis. When de-frozen, they were analysed for chemical composition and fermentative faecal profile (i.e. VFA). In particular, about 1 kg aliquot of faeces were dried in a forced-air oven (60 °C, 48 h) for DM determination. These samples were ground to pass at 0.5 mm and analysed by NIR for characterisation of CP, NDF, starch and ADL, with the same NIR instrument described above and opportune calibrations. The NDF, starch, CP and ADL contents of faeces and TMR were used to obtain digestibility coefficients. The ADL was used as an internal marker to calculate digestion coefficients (Kotb and Luckey Citation1972) according to following equations:
(2)
(2)
with, X digestibility = digestibility coefficient of specific nutrient X (i.e. NDF, starch or CP). The suberscipt indicated samples (i.e. diet or faeces samples) in which the nutrient or internal marker were quantified, as described above.
A wet sample (about 50 g) of fresh faecal samples was extracted using a Stomacher blender (Seward Ltd., West Sussex, UK) for 3 min in distilled water (water:sample fresh weight ratio: 3:1). The mixture was filtered through gauze, and then an aliquot (2 mL) of the resulting solution was added to 1 mL of an oxalic acid solution (15.2 g/L) and 1 mL of a mixture of pivalic acid (internal standard, 1 g/L) and formic acid (50 mL/L). To remove solid impurities, the mixtures were shaken for 10 min, centrifuged at 4500 × g for 10 min, and the liquid phase was retained for determination of VFA using the GC equipment previously described.
The milk samples were collected before the day of the visit by the farm milk tank containing both afternoon and successive morning milking, and then stored at 4 °C. Then, the milk samples were analysed the day of the visit for butterfat, protein, lactose, casein content using infra-red measurements (MilkoScan FT 120, Foss Electric, Hillerød, Denmark) according to Chessa et al. (Citation2014). The urea nitrogen was determined in skimmed milk using a spectrophotometric assay and a urea nitrogen kit (cat# 0018255440, Instrumentation laboratory, Milano, Italy) in association with an auto-analyzer (ILAB-650, Instrumentation Laboratory, Lexington, MA). The somatic cell count (SCC) was determined using an optical fluorimetric method with an automated cell counter (Fossomatic 180, Foss Electric).
Statistical analysis
The cluster analysis is a multivariate statistical technique commonly used to group n subjects (i.e. farm rations of productive animals) into k groups (i.e. nutritional strategies), when not a priori grouping information is available. As a result, farm rations of lactating dairy cows that are grouped in the same cluster could be considered similar for specific characteristics (i.e. ingredients), whereas there is heterogeneity across clusters (CL). In this study, the hierarchical cluster analysis considered the type and amount (i.e. % DM) of different feeds used in lactating dairy cow rations to create nutritional strategy CL. The analysis used the unweighted pair group mean with the arithmetic averages (UPGMA) method by the CLUSTER procedure of SAS (Citation2004). Then, the CL grouping different dairy farms were presented for ingredient inclusion and diet characteristics.
The data were then analysed in agreement to a completely randomised design, with the main fixed effect represented by nutritional strategy group. The GLM procedure of SAS (Citation2004) was used and lsmeans were post-hoc compared by using LSMEANS option. The differences among means were declared at a p < .05, whereas retained important tendencies for a 0.05 < p < .10.
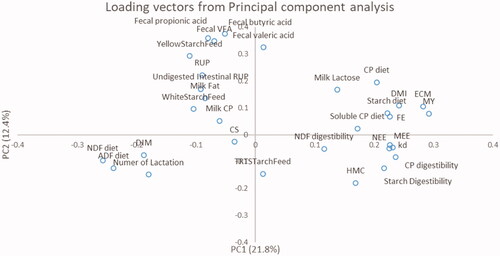
Principal component (PC) analysis was performed using the PRINCOMP procedure of SAS (Citation2004) with the specific aim to determine correlations among specific parameters of interest. In particular, the Kaiser’s criterion (i.e. eigenvalue >1; Kaiser Citation1960) was adopted to extract principal components (Braeken and Van Assen Citation2017). The loading plots of PC1 and PC2, the first two eigenvalues, were used to verify relations among different parameters. The angles were used to study relationships between variables (acute and obtuse respectively for positive and negative relationships), than the relationships among variables were quantified with simple linear Pearson correlation analysis using CORR procedure of SAS (Citation2004).
Results
Characteristics of identified nutritional strategy clusters
Six different CL were identified and they grouped respectively 4 (CL 1), 4 (CL 2), 18 (CL 3), 21 (CL 4), 9 (CL 5) and 10 (CL 6) farm rations (Figure ). Table reported the feed inclusion in diets. Regarding forage inclusion level, the CS was the lowest in CL 1 with respect to others (i.e. 16.3% DM vs. 30.8% DM, respectively; p < .05), characterised by having the greatest variability (i.e. SD ±11.2% DM). The HMC was not used in diets of CL 2, 3, and 5, whereas the CL 4 and 6 used the highest amount of this ingredient (i.e. on average 17.9% DM). The CL 1 was characterised by the highest inclusion of LS, being equal to 14.9 ± 8.0% DM, whereas the inclusion level for other CL resulted lower than 3.0% DM.
Figure 1. Dendrogram of cluster analysis.
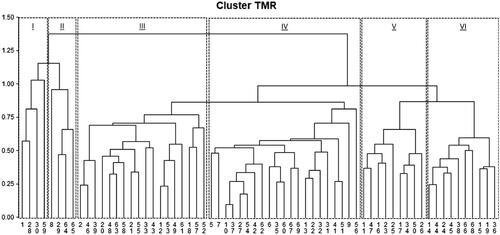
Table 1. Diet ingredient formulation in different nutritional strategy clusters.
Concerning CP ingredients, the CL 3 and 4 used HVProteinFeed by an inclusion level of about 10% DM, whereas other CL included less than 2% DM of this CP source. Similarly, the dairy rations of CL 3 and 4 were characterised by the use of TRTProteinFeed, with the greatest (p < .05) inclusion observed in CL 4 (i.e. 1.3% DM). The ProteinCompoundFeed inclusion level resulted about 23.0% DM or CL 5 and 6, and greater (p < .05) than CL 1 for which an inclusion level of 12.0% DM was calculated. The use of this ingredient in other cluster was negligible. Lastly, the ProteinRestrictedFeed was adopted only in CL 3 and 4, at an average inclusion level of 3.3% DM.
The inclusion level of YellowStarchFeed differed among CL, with the CL 3 and 5 characterised by the greatest values (i.e. >20.0% DM) and CL 1 in which this ingredient was not used. The inclusion levels of StarchCompoundFeed was higher than 25.0% DM for CL 1 and 2, whereas this ingredient was not or poorly used in other CL.
Chemical diet parameters calculated or measured by NIR and gas production profile
The ration parameters (Table ), as calculated by NRC (Citation2001), did not differ among CL, except for content of different fibre fractions. In particular, the CL 1 and 3 had greater (p < .05) values with respect to other CL for fibre fractions (i.e. NDF or ADF). The diets of CL 1, 4 and 6, all including HCM, were characterised by a rate of gas production (kd, 1/h) higher than CL 3 (i.e. 0.52 vs. 0.42 1/h). The final volume was the greatest in CL 3 (217.2 mL/g OM) and the lowest in CL 2 (176.2 mL/g OM). No differences in methane production dynamics were reported among CL.
Table 2. Diet composition calculated by using analysed feed composition and the output parameters obtained from the NRC (Citation2001) animal nutrition model or gas production parameters in different nutritional strategy clusters.
Differences in herd characteristics, milk production, feed efficiency, diet digestibility among clusters
A similar herd composition among CL was observed, despite the CL 4 was tendentially greater than other (Table ). No difference in DIM was observed, except for CL 2 being characterised by a longer (p < .05) DIM than other CL (i.e. 241 vs. 182 days, respectively). The milk yield tended (p = .07) to differ among CL, with CL 4 and 6 had a milk yield higher than 33.0 kg/cow per day, whereas CL 2 and 3 values lower than 30 kg/cow per day. No differences were observed among CL for the majority of milk parameters, except lactose that was lower in CL 1 than CL 3, 4, 5 and 6 (4.95 ± 0.07% vs. 5.02 ± 0.04%, respectively).
Table 3. Herd characteristics, milk yield and composition in different nutritional strategy clusters.
The DMI, reported on Table , did not differed among CL and was equal to 22.5 ± 0.7 kg/cow per day. The FE differed among CL, resulting the greatest (p < .05) for CL 4 and the lowest (p < .05) for CL 2. Tendentially (0.05 < p < .10), both MEE and NEE showed a similar pathway among CL, with CL 1 and 4 being the most efficient and the CL 2 the less efficient. The REI did not differ among cluster and had average value of 4.3 ± 1.1 Mcal/day. The estimate NDF digestibility did not change among cluster, despite the numerically greatest values were measured in CL 1 and CL 4 (i.e. higher than 69.0% NDF intake). The greatest (p < .05) starch digestibility was observed in CL 1, 4, and 6, with values greater than 98.5% starch intake. The estimate CP digestibility was the greatest (p < .05) in CL 1 and 4 (i.e. higher than 84% CP intake), whereas it was the lowest in CL 2 (i.e. 72.8 ± 8.9% CP intake).
Table 4. Estimated diet digestibility and economic indexes in different nutritional strategy clusters.
Both IOFC and IEFC tended to differ among CL (p = .083 and .053, respectively), with dairy farms grouped in CL 1, 3, 4 and 6 having an IOFC greater than 6.00 €/cow/day or CL 3, 4 and 6 showing an IEFC lower than 16.0 L/cow/day. The lowest (p < .05) feed costs were calculated for CL 3, 4 and 6 (i.e. 0.19 €/kg of milk), whereas the greatest for CL 2 (i.e. 0.24 €/kg of milk).
Faecal fermentation profile among clusters
The faecal profile was characterised for single and total VFA (Table ). The faecal concentrations of acetic acid, propionic acid, butyric acid, valeric acid and total VFA were higher in CL 5 than CL 1 and 6. The single VFA, when expressed as percentage of total faecal VFA, did not change among CL, except for butyric acid that resulted higher (p < .05) in CL 5 than CL 1, 4 and 6.
Table 5. Faecal fermentation profile for different nutritional strategy clusters.
Correlations among variables as assessed by principal component analysis
To study correlations among different parameters (Figure ), the loading vectors were plotted on the first two extracted components, explaining respectively the 22.8 and 12.4% of total system variability. The starch and protein contents of TMR were negatively correlated (p < .05) to dietary NDF and ADF (r >− 0.60) and positively related (p < .05) to milk yield (r > 0.28), lactose (r = 0.47 for starch and r = 0.29 for protein), DMI (r > 0.37), and FE (r > 0.20; 0.05 < p < .10). A negative relationship was observed between DIM and FE, MEE or NEE (r = − 0.46, − 0.38, − 0.36, p < .05; respectively). The inclusion level of HMC into diets increased the FE (r = 0.28; p < .05), kd of gas production (r = 0.48; p < .05), CP and starch digestibility of the diets (r = 0.38 and 0.47; p < .05; respectively). The inclusion of YellowStarchFeed increased (p < .05) the propionic (r = 0.31), butyric (r = 0.60) and valeric (r = 0.31) faecal concentrations. Similarly, these VFA were increased by dietary RUP (r > 0.20, p < .05), whereas the amount of RUP undigested in intestinal tract increased only butyric acid (r = 0.25; p < .05). Lastly, the faecal concentration of propionic acid tended to decrease (r = − 0.19, 0.05 < p < .10) when TRTStarchFeed increased.
Figure 2. Loading scores or specific parameters of interest on first two extracted principal components.
Discussion
Farm clustering
Previous surveys or studies characterising different nutritional strategies were carried out either in this area (Borreani et al. Citation2013; Guerci et al. Citation2013; Pirondini et al. Citation2015; Gislon, Bava, et al. Citation2020) or in other intensive dairy locations both from Europe and US (Arriaga et al. Citation2009; Dutreuil et al. Citation2014; Hardie et al. Citation2014). In these published studies, the grouping of the collected diets was mostly arbitrary or based on single diet characteristics. In particular, Pirondini et al. (Citation2015) grouped diets based on starch:ADF increasing rations, by identifying four dietary groups (i.e. starch:ADF as percentage on average equal to 37, 77, 116, or 138). Borreani et al. (Citation2013) identified five different farming system. In particular, three were selected according to the proportion of commercial concentrate mix fed to lactating cows (i.e. great proportion, medium proportion, or no commercial concentrate mix in cow feeding). The first three systems all used corn silage as the main component of the diet. The fourth and the fifth systems replaced part of the corn silage in the cow diet with grass or legume (mainly alfalfa) silage or with fresh herbage, cut and fed indoors. Arriaga et al. (Citation2009) identified three different nutritional strategies, based on the use of TMR, purchased complete feed or component feeding.
To the best of our knowledge, only Hardie et al. (Citation2014) used a non-hierarchical clustering method based on nine variables related to general farm characteristics, feed supplementation, and grazing to partition the farms into nutritional strategies CL. Our intention was to describe here how the cluster analysis could be useful to identify, without a priori criterion and using a statistical basis, the different nutritional approaches, that seems also drivers of higher feed efficiency, better rumen functionality and higher economic performances. In our opinion, a feeding strategy identification should be data driven, deduced from opportune statistical techniques and applied to farm data. Based on the nutritional insights gathered from this analysis, the CL can be grouped and summarised as follow:
Cluster 1 (n = 4), that could be labeled as HMC and legume silage strategy, in which HMC was used. It was characterized by greatest level of LS. These diets were also characterized by high inclusion levels of both steam flacked corn (i.e., TRTStarchFeed), starch- and protein-compound feeds.
Cluster 2 (n = 4), can be labeled as compound feed strategy. HMC was not used and the starch components are mainly corn meal (i.e., YellowStarchFeed) and StarchCompoundFeed, which also provided the protein quota of the diet.
Cluster 3 (n = 18), labeled as corn and soy meals strategy, in which HMC was not used. HMC was not used and the protein quota was provided by use of soybean meal (i.e., HVProteinFeed) and ProteinRestrictedFeed. The starch quota was provided by corn meal.
Cluster 4 (n = 21), labeled as HMC and soy meal strategy. The protein quota was provided by use of soybean meal (i.e., HVProteinFeed), TRTProteinFeed and ProteinRestrictedFeed.
Cluster 5 (n = 9), labeled as protein compound feed strategy, in which HMC was not used. The protein quota was provided by ProteinCompoundFeed. The starch quota was provided by corn meal and steam flacked corn.
Cluster 6 (n = 10), labeled as HMC and protein compound feeds strategy. The protein quota was provided by ProteinCompoundFeed.
The number of farms among CL cannot be considered indicative of statistical distribution in the area even considering that the farms were sampled randomly. Even though, CL 3 and 4 that are highly represented are probably the most common nutritional strategies adopted in Northern Italy. Two identified CL grouped only four dairy farms, thus appearing poor representative of specific productive reality, which could reflect the limited period of sampling activity, even if it as planned to cover a broad range of farm choices. In particular, Gislon, Colombini, et al. (Citation2020) characterised, from a forage system and crop plan point of view, the most common nutritional strategies adopted in northern Italy for production of Grana Padano and Parmigiano Reggiano PDO cheeses, distinguishing among four feeding systems, such as: a corn silage-based that could include the most part of farms of this study; a double-cropped corn and legume or grass silages that could eventually include farms from the CL1; a double-cropped corn and winter cereal silages that could include farms from the CL 2 and 3; a system with dried forages from alfalfa and permanent meadows, that was not included in current observational study. Furthermore, and as observed by Gislon, Bava, et al. (Citation2020), surveying 171 intensive dairy farms in the same area of study, corn silage, corn grain meal, and soybean meal were the most popular ingredients included in TMR for lactating cows, mainly due to the high yield and availability of corn and the nutrient densities of these feeds. Interestingly, by applying a multivariate logistic regression, they also observed that high uses of corn silage and corn meal (more than 30% or 20% of DM, respectively) reduced feed efficiency without improvements on milk yield. Moreover, the inclusion of soybean meal (>15% of DM) exposed the farms to higher greenhouses gas emissions.
Ration parameters calculated by NRC (Citation2001) animal nutritional model or measured by NIR
The formulated diets did not differ among CL, as calculated by using the NRC (Citation2001). In particular, dairy rations were formulated to guarantee a DMI of 23.2 ± 0.7 kg/cow per day. Furthermore, the energy and CP levels appeared adequate, being ME, NEl and CP equal on the whole average to 2.23 ± 0.07 Mcal/kg DM, 1.57 ± 0.02 Mcal/kg DM and 16.4 ± 0.4% DM, respectively. Compared to previous surveys carried out in the same area, similar TMR composition values were reported (Borreani et al. Citation2013; Pirondini et al. Citation2015). The gas and methane production dynamics (Table ) slightly changed among CL. In particular, the compound feed nutritional strategy was characterised by the lowest gas production with respect to other CL. The loss of differences in gas production dynamic could be due to a compensative effect of different soluble fractions constituting the tested diets. Similarly, the dynamic of methane production did not differ among CL, showing a final methane production values of 21.7 ± 0.8 mL/g OM. These values appeared in line with previous experiments (Cattani et al. Citation2014; Maccarana et al. Citation2016). Xu et al. (Citation2010) reported a methane production of 16.9 ml/g DM with respect a final volume of gas production equal to 163 mL/g DM. Similarly, Cattani et al. (Citation2014) reported a final production of 23.0 mL/g DM, representing the 12.3% of total gas production. Greater proportion of methane production with respect to final gas volume were instead reported by Pirondini et al. (Citation2012) when evaluating diets with different starch to ADF ratio. In particular, values of about 24% percentage were reported, and this could be due to specific test conditions in which gas production test was carried out (Maccarana et al. Citation2016). Gislon, Bava, et al. (Citation2020) observed differences in greenhouses gas emissions among farms with different diets (i.e. higher methane with corn silage < 30% and alfalfa < 12% of DM, respectively), but it has to be highlighted that emissions in the present study were determined per gram of TMR cumulatively per farm or as emission intensities per litre of milk, thus with a partial focus and not pursuing a complete LCA approach.
Differences in milk production, feed efficiency, diet digestibility and profitability among clusters
The dairy farms belonging to different nutritional strategies tended (0.05 < p < .10) to differ for production performance, in term of both normal and corrected milk yields. We observed production levels higher than 33 kg/cow per day in nutritional strategies including HMC (CL1, CL4 and CL6) despite differences in other silages or starch and protein sources. Usually, greater ruminal and total-tract starch digestibility is measured when dairy cows were fed HMC compared with dry corn (Firkins et al. Citation2001; Ferraretto et al. Citation2013). This is mainly related to breakdown of the hydrophobic starch-protein matrix surrounding starch granules during ensiling (Gallo et al. Citation2014), which allows for greater microbial fermentation and enzymatic digestion of starch by ruminants (McAllister et al. Citation1993). Starch digestibility of HMC, however, may be altered by several factors, including mean particle size (Ferraretto et al. Citation2013; Gallo et al. Citation2016, Citation2018), harvest maturity and moisture content (Correa et al. Citation2002), and endosperm type (Philippeau et al. Citation1999) as well as anti-nutritional factors or mycotoxin contaminations (Gallo et al. Citation2021). Despite this, the HMC has a greater rumen rate of starch degradation with respect to corn meal, being the latter harvested in a more advanced stage of maturity (Masoero et al. Citation2011; Hoffman et al. Citation2012; Ferraretto et al. Citation2015) with possible effect on starch degradability and rumen fermentation syncronyzation. No differences were reported for milk characteristics, except for lactose content that resulted higher in CL4 (i.e. HMC and soy meal), CL5 (i.e. corn meals and protein compound feeds) or CL6 (i.e. HMC and protein compound feeds) nutritional strategies. This could support the idea of shifts in energy partitioning among different GIT due to inclusion of HMC (CL4 and CL6) or steam flaked corn (CL5). As a matter of fact, an increase in glucose availability for animal was assumed, thus influencing the total milk yield as well as lactose content of milk (Oba et al. Citation2015; Al-Qaisi et al. Citation2020). Accordingly, a positive relationship between rate of HMC inclusion into diet and DMI, feed efficiency, energy intake and partitioning (i.e. lactose of milk) or milk yield was observed thus corroborating nutritional aspects discussed before.
Feed efficiency strongly affects milk production efficiency and economics of dairy farm, as recently reviewed by Bach et al. (Citation2020). These authors stated that the increase in the conversion of feed resource by the animals could improve their milk production efficiency and this mainly depends by herd advancements in genetic as well as different adopted nutritional strategies, animal health and general herd management. In particular, dairy farms characterised by a great feed efficiency result effective in enhancing milk production per present cow, reducing maintenance costs and bringing important advantages for reduced environmental impact at farm level (Pulina et al. Citation2020). The feed as well as energy efficiencies depends by different factors related to animal (i.e. level of production, physiological status, digestive function, metabolic partitioning), genetics or management of the herd (i.e. distribution of cows among different group, DIM and order of lactation). VandeHaar and St-Pierre (Citation2006) estimated that feed efficiency of North American dairy cows has doubled in the past 50 years, mainly due to selection and management towards increased productivity, resulting in the dilution of feeding maintenance costs, as well as the improved assessment of nutritional feed value, the genetic improvement of forages (e.g.: corn silage) and other feedstuffs or the use of several energy additives and co-products (e.g.: glycerol or soap). In current survey, the analysed farms strongly differed, both among or within CL, for feed or energy efficiency despite CL appeared similar for DMI, DIM and average lactation number. In particular, values of FE, MEE, or NEE greater than 1.60, 0.42 and 0.66 were observed for many farms, suggesting the opportunity for large improvement, in particular for less efficient situations.
The faecal fermentation profile was characterised as indirect marker of fermentation occurring in the lower GIT (Doelman et al. Citation2019). In particular, some CL showed a greater amount of propionic acid and butyric acids, with values respectively greater than 60 or 35 mmol/kg DM of faeces in strategies without inclusion of HMC (i.e. CL2, CL3, and CL5), thus supporting the idea a portion of starch reached this tract of GIT undegraded and fermentation undergone. Also valeric acid, mainly related to fermentation of amino acids, resulted higher with the CL5 (i.e. corn meal and protein compound feed) with respect to cluster characterised by inclusion of HMC or steamed flaked corn (i.e. CL1, CL4 and CL6). The total production of VFA ranged from 340.7 mmol/kg DM up to 493.2 mmol/kg DM in CL 1 and 5, respectively. These values appeared slightly lower than those previously reported (Calamari et al. Citation2018) in similar nutritional conditions. The reason of this numerical discrepancy could be related to donor animals, being in Calamari et al. (Citation2018) survey the cows selected according to parity and lactation stage (i.e. 7 cows in early lactation: 30–90 d in milk (DIM), and 7 cows in mid lactation: 160–240 DIM). In this survey, representative faecal samples of all lactating cows were randomly collected, thus surely collecting faeces from early- to late lactation stage. Said that, the faecal VFA measurements provided a non-invasive method to assess changes in fermentation patterns occurring in the lower GIT. When dietary corn meal inclusion increased, a greater fermentation of undigested organic matter in lower GIT was observed. Contrarily, the increase in inclusion of heat-treated starch source, such as steam flaked corn, reduced faecal fermentation. The amount of meal particles fermented or escaped by rumen-reticulum compartment strongly depend by mean particle size of the meals (Hoffman et al. Citation2012; Gallo et al. Citation2018). We proposed a linear function to estimate a processing adjusting factor of starch digestion based on mean particle size (mPS) (Gallo et al. Citation2016). In particular, for each 1-mm increase in mPS of corn meals a linear decrease in rate of starch degradation equal to −0.049 or a decrease in 7 h in vitro starch degradability equal to 6.3% was proposed. Despite no data on mPS of corn meals used in different TMR was measured, the lower fermentation observed in diets including corn meals could be related to either low fermentatibility or high rate of passage of meal particles from rumen-reticulum compartments to intestine. The incomplete hydrolysis of starch by gastro-intestinal amylolytic enzymatic pool could cause an excess of fermentable materials in large intestine where residing microbial populations are active in fermenting nutrients and producing VFA (Mills et al. Citation1999; Beauchemin et al. Citation2004; Owens et al. Citation2016). However, quantification of the bacterial species present would provide a more sensitive analysis of GIT dynamics, and this represents a further and planned upgrade of current investigation. It is of relevant interest that the feed profile of diets identified by the CL also were associated to different economic performances of the farms (Table ). CL 1, 2 and 5 resulted in the higher feeding costs per kg of milk being also associated to lower feed efficiency (Table ). In fact, differences in economical performances seems more associated to the animal response to the diet for milk production than to the cost of the used feeds. Particularly, the use of protein compound feeds in CL5 and CL6 was associated to both higher and lower feed costs per kg of milk, and seem that the difference was more related to the use of HMC as before highlighted. Otherwise CL1, with HMC and legume silages showed intermediate economic performances (i.e.: IOFC, IEFC, feed cost per kg of milk), in comparison with other CL (Table ). It confirms that feed efficiency is a major driver of economic performances (Bach et al. Citation2020). Atzori et al. (Citation2021) observed that from a multivariate perspective the effect of feed efficiency is split between energy efficiency and economic efficiency and explains half part of these partial indicators used at field level for farm management.
Insights and implications
Looking at the whole picture of determined and calculated indicators (Tables ) and correlation among variables (Figure ), the comparison of the diet formula, the chemical composition, the ruminal parameter and the faecal fermentation profile suggested that the use of HMC or steamed flaked corn was associated to higher feed efficiency and digestibility and better economical performances. Furthermore, it could be speculated that each cluster also reflected the combined effect among the farmer choice, for the used feeds and the specific nutritional strategy, and the approach suggested by the nutritionist for diet formulation. In this sense, a larger number of feeds probably could bring higher variety of nutrients and degradability rates, perhaps favouring rumen fermentations. Focussing on the nutritional results, a better synchronisation between rumen available protein and energy could be hypothesised as possible cause of higher use of HMC and steamed flaked corn into diets. It acted enhancing the degradability potential of the diet, probably increasing ruminal fermentation synchronisation, microbial CP production, thus assuring a better utilisation of nutrient in rumen-reticulum compartment and in the first tract of intestine. In fact, this is specifically underlined by the multivariate analysis the chemical characterisation is well described by the first principal component whereas the fermentative characterisation by the second principal component of the latent structure (Figure ). Otherwise, corn meal based diet was probably characterised by less rumen fermentability of dietary nutrients, mainly carbohydrates, and rapid escape of particles from rumen-reticulum compartment, that can cause excesses of unfermented particles in the last part of intestine, when gastric-intestinal enzymatic pools are unable to completely hydrolyse starch and other nutrients. It also causes increases of the concentration of certain VFA into large bowel intestinal compartment and of nutrients in faeces.
The better synchronisation between energy and protein fractions into rumen-reticulum compartment implies that maximum microbial protein synthesis could be achieved by matching carbohydrates and protein degradation rates (Herrera-Saldana et al. Citation1990; Zadeh et al. Citation2013; Hackmann and Firkins Citation2015), thus maximising ruminal microbial protein production, speeding the rumen emptying and reducing dietary fill effect (Gregorini et al. Citation2009; Mertens and Grant Citation2020). As stated by Mertens (Citation1997), the major direct physiological feedback control mechanism for meal pattern and daily DMI is probably distension and fill effect of diets. However, it is more evident that a full rumen compartment can provide the signal to terminate eating, especially when rations are high in fibre and low in energy (Mertens Citation1987; Stensig and Robinson Citation1997). Furthermore, osmotic and rumen acid loads also may be a signal for short-term regulation of feeding behaviour (Huhtanen et al. Citation2002; Fessenden et al. Citation2019).
The characterisation of VFA in faeces could be useful, in a next step of investigation, to link the faecal fermentation profile with rapid information regarding the performance of diets and the presence of undigested particles into intestine, thus creating a suitable and on farm applicable monitoring system. As a matter of facts, this study highlights that diet characterisation need to be considered from a different point of view. Any specific nutrient reported in Table can be associated to HMC diets vs. those without HMC. Even though, the values of milk yield (Table ), starch and protein digestibility, feed efficiency and IOFC (Table ) resulted higher in nutritional strategies, including HMC in respect to other ones. It suggested that the choice of including HMC in corn silage based diets for lactating cows might be relevant to improve farm performances both in technical and economical terms. However, it also pointed out that, from a nutritional point of view, further characterisations of lactating cows diets should be based on both feed and nutrients, targeting the nutrient use efficiency at digestive level, specifically nutrient degradation rate, rumen fermentation synchronisations and faecal outputs more than single feeds or chemical parameters.
It is also insightful to notice that herd level data can also bring useful information for nutritional strategies when diets are compared adopting homogenous criteria. From this point of view, nutritional indicators as protein and starch digestibility and faecal fermentation profile should be included to evaluate the efficient use of nutrients either among or within specific identified nutritional strategies.
Conclusions
Extracted CL pointed out that nutritional strategy differed depending on the choice of including the starch and protein quota of the diet either as raw materials or as compound feeds, and corn meal and protein compound feeds. The inclusion of HMC and steamed flaked corn enhanced the differentiation of starch degradability potential, probably increasing ruminal fermentation synchronisation, microbial CP production and a better use of nutrients in gastro-intestinal tract. Otherwise, corn meal based diets increased the intestinal fermentations and faecal output of nutrients. In terms of farm performances, the nutritional strategies based on HCM resulted more efficient and profitable than other nutritional strategies. The use of HMC should be considered when approaching the crop planning or the dairy cows diet formulation in corn silage based systems.
Disclosure statement
No potential conflict of interest was reported by the authors.
Data availability statement
The data that support the findings of this study are available from the corresponding author, AG, upon reasonable request.
Additional information
Funding
References
- Al-Qaisi M, Mayorga EJ, Horst EA, Kvidera SK, McCarthy CS, Abeyta MA, Goetz BM, Ramirez-Ramirez HA, Timms LL, Baumgard LH. 2020. Validating a heat stress model: the effects of an electric heat blanket and nutritional plane on lactating dairy cows. J Dairy Sci. 103:5550–5560.
- Arriaga H, Pinto M, Calsamiglia S, Merino P. 2009. Nutritional and management strategies on nitrogen and phosphorus use efficiency of lactating dairy cattle on commercial farms: an environmental perspective. J Dairy Sci. 92:204–215.
- Atzori AS, Tedeschi LO, Cannas A. 2013. A multivariate and stochastic approach to identify key variables to rank dairy farms on profitability. J. Dairy Sci. 96(5):3378–3387.
- Atzori AS, Valsecchi C, Manca E, Masoero F, Cannas A, Gallo A. 2021. Assessment of feed and economic efficiency of dairy farms based on multivariate aggregation of partial indicators measured on field. J Dairy Sci. 104:12679–12692.
- Bach A, Terré M, Vidal M. 2020. Symposium review: decomposing efficiency of milk production and maximizing profit. J Dairy Sci. 103:5709–5725.
- Beauchemin KA, Colombatto D, Morgavi DP, Yang WZ, Rode LM. 2004. Mode of action of exogenous cell wall degrading enzymes for ruminants. Can J Anim Sci. 84(1):13–22.
- Bellingeri A, Cabrera VE, Gallo A, Liang D, Masoero F. 2019. A survey of dairy cattle management, crop planning, and forages cost of production in Northern Italy. Ital J Anim Sci. 18(1):786–798.
- Bellingeri A, Gallo A, Liang D, Masoero F, Cabrera VE. 2020. Development of a linear programming model for the optimal allocation of nutritional resources in a dairy herd. J Dairy Sci. 103:10898–10916.
- Borreani G, Coppa M, Revello-Chion A, Comino L, Giaccone D, Ferlay A, Tabacco E. 2013. Effect of different feeding strategies in intensive dairy farming systems on milk fatty acid profiles, and implications on feeding costs in Italy. J Dairy Sci. 96:6840–6855.
- Braeken J, Van Assen MALM. 2017. An empirical Kaiser criterion. Psychol Methods. 22:450–466.
- Cabrera VE, Solís D, del Corral J. 2010. Determinants of technical efficiency among dairy farms in Wisconsin. J Dairy Sci. 93:387–393.
- Calamari L, Morera P, Bani P, Minuti A, Basiricò L, Vitali A, Bernabucci U. 2018. Effect of hot season on blood parameters, fecal fermentative parameters, and occurrence of Clostridium tyrobutyricum spores in feces of lactating dairy cows. J Dairy Sci. 101:4437–4447.
- Cattani M, Tagliapietra F, Maccarana L, Hansen HH, Bailoni L, Schiavon S. 2014. Technical note: in vitro total gas and methane production measurements from closed or vented rumen batch culture systems. J Dairy Sci. 97:1736–1741.
- Chessa S, Bulgari O, Rizzi R, Calamari L, Bani P, Biffani S, Caroli AM. 2014. Selection for milk coagulation properties predicted by Fourier transform infrared spectroscopy in the Italian Holstein-Friesian breed. J Dairy Sci. 97:4512–4521.
- Correa CES, Shaver RD, Pereira MN, Lauer JG, Kohn K. 2002. Relationship between corn vitreousness and ruminal in situ starch degradability. J Dairy Sci. 85:3008–3012.
- Doelman J, McKnight LL, Carson M, Nichols K, Waterman DF, Metcalf JA. 2019. Postruminal infusion of calcium gluconate increases milk fat production and alters fecal volatile fatty acid profile in lactating dairy cows. J Dairy Sci. 102:1274–1280.
- Dutreuil M, Wattiaux M, Hardie CA, Cabrera VE. 2014. Feeding strategies and manure management for cost-effective mitigation of greenhouse gas emissions from dairy farms in Wisconsin. J Dairy Sci. 97:1–14.
- EU, 2010. Directive 2010/63/EU of the European parliament and of the Council of 22 September 2010 on the protection of animals used for scientific purposes (text with EEA relevance). Off J Eur Union. L276:33–79.
- Ferraretto LF, Crump PM, Shaver RD. 2013. Effect of cereal grain type and corn grain harvesting and processing methods on intake, digestion, and milk production by dairy cows through a meta-analysis. J Dairy Sci. 96(1):533–550.
- Ferraretto LF, Fonseca AC, Sniffen CJ, Formigoni A, Shaver RD. 2015. Effect of corn silage hybrids differing in starch and neutral detergent fiber digestibility on lactation performance and total-tract nutrient digestibility by dairy cows. J Dairy Sci. 98:395–405.
- Fessenden SW, Hackmann TJ, Ross DA, Block E, Foskolos A, Van Amburgh ME. 2019. Rumen digestion kinetics, microbial yield, and omasal flows of nonmicrobial, bacterial, and protozoal amino acids in lactating dairy cattle fed fermentation by-products or urea as a soluble nitrogen source. J Dairy Sci. 102:3036–3052.
- Firkins JL, Eastridge ML, Noftsger SM. 2001. Effects of grain variability and processing on starch utilization by lactating dairy cattle: effects of grain variability and processin. J Anim. Sci. 79:218–238.
- Gallo A, Ghilardelli F, Atzori AS, Zara S, Novak B, Faas J, Fancello F. 2021. Co-occurrence of regulated and emerging mycotoxins in corn silage: relationships with fermentation quality and bacterial communities. Toxins (Basel). 13(3):232.
- Gallo A, Giuberti G, Atzori AS, Masoero F. 2018. Short communication: in vitro rumen gas production and starch degradation of starch-based feeds depend on mean particle size. J Dairy Sci. 101:6142–6149.
- Gallo A, Giuberti G, Masoero F. 2016. Gas production and starch degradability of corn and barley meals differing in mean particle size. J Dairy Sci. 99:1–13.
- Gallo A, Giuberti G, Masoero F, Palmonari A, Fiorentini L, Moschini M. 2014. Response on yield and nutritive value of two commercial maize hybrids as a consequence of a water irrigation reduction. Ital J Anim Sci. 13(3):3341.
- Gislon G, Bava L, Colombini S, Zucali M, Crovetto GM, Sandrucci A. 2020. Looking for high-production and sustainable diets for lactating cows: a survey in Italy. J Dairy Sci. 103(5):4863–4873..
- Gislon G, Colombini S, Borreani G, Crovetto GM, Sandrucci A, Galassi G, Tabacco E, Rapetti L. 2020. Milk production, methane emissions, nitrogen, and energy balance of cows fed diets based on different forage systems. J Dairy Sci. 103(9):8048–8061..
- Gregorini P, Soder KJ, Kensinger RS. 2009. Effects of rumen fill on short-term ingestive behavior and circulating concentrations of ghrelin, insulin, and glucose of dairy cows foraging vegetative micro-swards. J Dairy Sci. 92:2095–2105.
- Guerci M, Bava L, Zucali M, Sandrucci A, Penati C, Tamburini A. 2013. Effect of farming strategies on environmental impact of intensive dairy farms in Italy. J Dairy Res. 80:300–308.
- Ghilardelli F, Ferronato G, Gallo A. 2022. Near-infrared calibration models for estimating volatile fatty acids and methane production from in vitro rumen fermentation of different total mixed rations volatile fatty acids and methane production from mixed rations. JDSC. 3, 19–25.
- Hackmann TJ, Firkins JL. 2015. Maximizing efficiency of rumen microbial protein production. Front Microbiol. 6:465.
- Hardie CA, Wattiaux M, Dutreuil M, Gildersleeve R, Keuler NS, Cabrera VE. 2014. Feeding strategies on certified organic dairy farms in Wisconsin and their effect on milk production and income over feed costs. J Dairy Sci. 97:4612–4623.
- Hennessy T, Buckley C, Dillon E, Donnellan T, Hanrahan K, Moran B, Ryan M. 2013. Measuring farm level sustainability with the Teagasc National Farm Survey. Oak Park, Carlow, Ireland: Teagasc Publications Office.
- Herrera-Saldana R, Gomez-Alarcon R, Torabi M, Huber JT. 1990. Influence of synchronizing protein and starch degradation in the rumen on nutrient utilization and microbial protein synthesis. J. Dairy Sci. 73:142–148.
- Hoffman PC, Mertens DR, Larson J, Coblentz WK, Shaver RD. 2012. A query for effective mean particle size in dry and high-moisture corns. J. Dairy Sci. 95:3467–3477.
- Huhtanen P, Khalili H, Nousiainen J, Rinne M, Jaakkola S, Heikkilä T, Nousiainen J. 2002. Prediction of the relative intake potential of grass silage by dairy cows. Livest. Prod. Sci. 73(2–3):111–130.
- Kaiser HF. 1960. The application of electronic computers to factor analysis. Educ Psychol Meas. 20(1):141–151. http://dx.doi.org/10.1177/001316446002000116.
- Kotb AR, Luckey TD. 1972. Markers in nutrition. Nutr Abstr Rev. 42:813–845.
- Maccarana L, Cattani M, Tagliapietra F, Bailoni L, Schiavon S. 2016. Influence of main dietary chemical constituents on the in vitro gas and methane production in diets for dairy cows. J Anim Sci Biotechnol. 7:54.
- Masoero F, Gallo A, Zanfi C, Giuberti G, Spanghero M. 2011. Effect of nitrogen fertilization on chemical composition and rumen fermentation of different parts of plants of three corn hybrids. Anim Feed Sci Technol. 164(3–4):207–216.
- McAllister TA, Phillippe RC, Rode LM, Cheng KJ. 1993. Effect of the protein matrix on the digestion of cereal grains by ruminal microorganisms. J Anim Sci. 71(1):205–212.
- Mertens DR. 1987. Predicting intake and digestibility using mathematical models of ruminal function. J Anim Sci. 64:1548–1558.
- Mertens DR. 1997. Creating a system for meeting the fiber requirements of dairy cows. J Dairy Sci. 80(7):1463–1481.
- Mertens DR, Grant RJ. 2020. Digestibility and intake. In: Moore KJ, Collins M, Nelson CJ, Redfearn DD, editors. Forages volume II: the science of grassland agriculture. 7th ed. Hoboken (NJ): Wiley. Print ISBN:9781119436577.
- Mills JAN, France J, Dijkstra J. 1999. A review of starch digestion in the lactating dairy cow and proposals for a mechanistic model: 2. Postruminal starch digestion and small intestinal glucose absorption. J Anim Feed Sci. 8(4):451–481.
- NRC 2001. Nutrient requirements of dairy cattle. 7th rev ed. Washington (DC): National Academy of Sciences.
- Oba M, Mewis JL, Zhining Z. 2015. Effects of ruminal doses of sucrose, lactose, and corn starch on ruminal fermentation and expression of genes in ruminal epithelial cells. J Dairy Sci. 98:586–594.
- de Ondarza MB, Tricarico JM. 2017. Review: advantages and limitations of dairy efficiency measures and the effects of nutrition and feeding management interventions. Prof Anim Sci. 33(4):393–400.
- Owens CE, Zinn RA, Hassen A, Owens FN. 2016. Mathematical linkage of total-tract digestion of starch and neutral detergent fiber to their fecal concentrations and the effect of site of starch digestion on extent of digestion and energetic efficiency of cattle. Prof Anim Sci. 32(5):531–549.
- Philippeau C, Le Deschault De Monredon F, Michalet-Doreau B. 1999. Relationship between ruminal starch degradation and the physical characteristics of corn grain. J Anim Sci. 77:238–243.
- Pirondini M, Colombini S, Mele M, Malagutti L, Rapetti L, Galassi G, Crovetto GM. 2015. Effect of dietary starch concentration and fish oil supplementation on milk yield and composition, diet digestibility, and methane emissions in lactating dairy cows. J Dairy Sci. 98:357–372.
- Pulina G, Tondo A, Danieli PP, Primi R, Crovetto GM, Fantini A, Macciotta NPP, Atzori AS. 2020. How to manage cows yielding 20,000 kg of milk: technical challenges and environmental implications. Ital J Anim Sci. 19(1):865–879.
- Sas Institute 2004. Sas/Stat user’s guide. Version 9. Cary (NC): Sas Institute Inc.
- Skevas T, Thompson W, Brown S, Cabrera VE. 2020. Milk income over feed cost margin, margin protection program, and farm finances for a sample of Wisconsin Dairies in 2000–2017. Appl Econ Perspect Policy. 0:1–20.
- de Souza RA, Tempelman RJ, Allen MS, VandeHaar MJ. 2019. Updating predictions of dry matter intake of lactating dairy cows. J Dairy Sci. 102:7948–7960.
- Stensig T, Robinson PH. 1997. Digestion and passage kinetics of forage fiber in dairy cows as affected by fiber-free concentrate in the diet. J Dairy Sci. 80:1339–1352.
- Pirondini M, Malagutti L, Colombini S, Amodeo P, Crovetto GM. 2012. Methane yield from dry and lactating cows diets in the Po plain (Italy) using an in vitro gas production technique. Ital J Anim Sci.11(3):330–5.
- Turner B, Menendez H, Gates R, Tedeschi LO, Atzori AS. 2016. System dynamics modeling for agricultural & natural resource management issues: review of some past cases and forecasting future roles. Resouces, Resources 2016, 5(4), 40:1–24.
- Valvekar M, Cabrera VE, Gould BW. 2010. Identifying cost-minimizing strategies for guaranteeing target dairy income over feed cost via use of the Livestock Gross Margin dairy insurance program. J Dairy Sci. 93:3350–3357.
- VandeHaar MJ, St-Pierre N. 2006. Major advances in nutrition: relevance to the sustainability of the dairy industry. J Dairy Sci. 89(4):1280–1291.
- Xu M, Rinker M, McLeod KR, Harmon DL. 2010. Yucca schidigera extract decreases in vitro methane production in a variety of forages and diets. Anim Feed Sci Technol. 159(1–2):18–26.
- Zadeh JB, Moradi Z, Moradi N. 2013. Synchronization of energy and protein on supply synthesis microbial protein. Int J Adv Biol Biomed Res. 1:594–600.