
 ?Mathematical formulae have been encoded as MathML and are displayed in this HTML version using MathJax in order to improve their display. Uncheck the box to turn MathJax off. This feature requires Javascript. Click on a formula to zoom.
Abstract
Pedigree analysis is an important tool for assessing genetic variability and detecting heritage patterns in domestic animals. This study aimed to (1) assess genetic variability, (2) estimate genetic parameters for daily milk yield (DMY), fat content (FC), and protein content (PC), and (3) estimate the impact of inbreeding on the aforementioned dairy traits in Istrian sheep breed. The generation interval was 3.8 years. The average family size per sire and dam was 13.5 and 1.6, respectively. There were 923 female and 282 male founders (f), 105 male and 137 female effective founders (fe), and 72 male and 95 female effective ancestors (fa). A total of 28 sires and 34 dams explained 50% of the genetic variability. The effective number of male and female founder genomes (fne) was 33 and 53, respectively. Low fe/f (0.37 and 0.15), high fe/fa (1.45 and 1.44), and low fne/fe (0.45 and 0.39) for males and females indicated overuse of a small number of animals in reproduction and substantial loss of founder alleles. The heritabilities of MY, FC, and PC were 0.09, 0.03, and 0.06, respectively. Genetic correlations between DMY and FC, DMY and PC, and FC and PC were −0.22, −0.27, and 0.70, respectively. Regression of phenotypes on inbreeding coefficient () within the animal genetic model revealed negligible inbreeding depression for all traits (p<.01; a 1% increase in
decreased DMY, FC, and PC by 0.002 kg/day, 0.01%, and 0.002%, respectively). Regression of breeding values on
was insignificant for all traits (p>.05).
Genetic diversity, genetic parameters and the impact of inbreeding on dairy traits were estimated using pedigree information.
Results indicate recent loss of genetic variability, low heritability and negligible impact of inbreeding on dairy traits.
Genomic optimum contribution selection is the best solution to achieve genetic gain and slow down the loss of genetic variability in this population.
HIGHLIGHTS
Introduction
Dairy sheep farming has a long tradition in Mediterranean countries. Sheep cheese and curd are the main dairy products, usually priced above those of other milk. The Istrian sheep originates from the Istrian peninsula and has been bred for centuries in semi-arid climatic conditions with long, dry, hot summers and mild winters. Nowadays, the breed is also widespread in the Karst region of neighbouring countries Slovenia and Italy (Piasentier et al. Citation2002). Originally, the breed was classified as a dual-purpose breed (milk and meat), but more recently, with average milk production of 160.9 kg (CAAF Citation2020) and selection towards dairy traits, it is classified more like a dairy breed (Mioč et al. Citation2012). The milk recording system started in early 2000 following ICAR guidelines and the breeding programme was officially established in 2011 (Mioč et al. Citation2011). BLUP genetic evaluation for dairy traits has been conducted for about a decade now.
Strong selection pressure usually results in a substantial genetic gain, but intensive use of a limited number of genetically superior animals leads to higher inbreeding rates and loss of genetic variability (Falconer and Mckay Citation1996; Mrode Citation2014). The impact of selection on genetic variability can be assessed from the pedigree by calculating rates of inbreeding, co-ancestry, and effective population size (de Rochambeau et al. Citation2000; Goyache et al. Citation2003), as well as the contribution of founders, ancestors, effective founders, and founder genomes (Maignel et al. Citation1996; Boichard et al. Citation1997). Estimates of some of the above parameters have been reported in numerous studies (e.g. Eteqadi et al. Citation2014; Rodriguez-Ramilo et al. Citation2019; Barbosa et al. Citation2020; Domínguez-Viveros et al. Citation2020; Hashemi and Hossein-Zadeh Citation2020).
Genetic parameters such as heritability and genetic correlation represent important information to predict response to selection (Carta et al. Citation2009). Test‒day records from routine milking controls in modern sheep breeding programs usually represent the phenotypes for both, the estimation of genetic parameters and prediction of breeding values (BVs). Genetic parameters for dairy traits have been reported prevalently for French and Spanish dairy sheep populations such as Lacune (Barillet and Boichard Citation1994), Corsican, Red-Faced Manech, Black-Faced Manech, and Basco-Béarnaise breeds (Astruc et al. Citation2002); Churra (Baro et al. Citation1994; El-Saied et al. Citation1998), Latxa and Manchega sheep (Serrano et al. Citation2001; Legarra et al. Citation2003). However, there are also reports for breeds from other countries such as Slovenia: Bovec, Improved Bovec, and Istrian Pramenka (Brežnik Citation1999; Komprej et al. Citation2009); Czechia: East Friesian, Lacaune, Sumavska, and crossbreeds (Bauer et al. Citation2012); and Slovakia: Tsigai and Improved Valachian (Oravcová et al. Citation2005; Oravcova Citation2014), and Lacune (Oravcova Citation2007).
When kinship is neglected, selection and mating based solely on BLUP results have a tendency to increase the rate of inbreeding, which can be accompanied by inbreeding depression and deleterious recessive alleles in the homozygous state (Falconer and Mckay Citation1996). Despite numerous reports on the impact of inbreeding on growth traits in sheep and dairy traits in cattle, there are no reports on the impact of inbreeding on dairy traits in sheep. However, Murphy et al. (Citation2017) hypothesised that due to the determined negative correlation between inbreeding and retained heterosis, inbreeding depression on dairy traits may also be present in sheep as well. In many cases, the non-significant effects of inbreeding on performance traits in sheep may have been the result of low pedigree completeness and a certain number of animals without phenotypic records. To bridge this gap in their studies, some authors decided to evaluate the effect of inbreeding on BVs (Barbosa et al. Citation2020).
The impact of non-genetic factors on dairy traits has been extensively studied in Istrian sheep so far (Vrdoljak et al. Citation2012; Kasap et al. Citation2019, Citation2021), but without addressing the issue of population genetic parameters. The objectives of this study were to (1) assess genetic diversity, (2) estimate genetic parameters using the multi-trait repeatability test–day model for daily milk yield (DMY), fat content (FC), and protein content (PC), and (3) estimate the effect of inbreeding on the abovementioned dairy traits.
Material and methods
Phenotypic and pedigree data
Phenotypic records for dairy traits (DMY, FC, and PC) and pedigree information were provided by the Ministry of Agriculture. Phenotypic records were collected according to alternate AT4 schemes (morning/evening system) following the ICAR guidelines (ICAR Citation2018). Initially, there were 51,405 test–day records collected in the period from February 2006 to August 2020. Before the final inferential statistical analysis, the original data set was ‘pruned’ as described by Spehar et al. (Citation2020). Summary statistics for dairy traits used in the inferential statistical analysis are presented in Table .
Table 1. Descriptive statistics for dairy traits.
The pedigree file was created using all available relationships to phenotyped ewes (5,071). After pruning of the initial file (7,050 animals), a total of 6,853 animals were included in the pedigree (Table ). The proportion of base animals (both ancestors unknown) was ∼14%. Of the ∼86% of non–base animals, ∼90% had both parents known, 3% only sire known, and 6% only dam known. Pedigree analysis was used to characterise the population structure based on the following parameters:
Table 2. Pedigree structure.
Demographic structure
Generation interval (GI) ‒ defined as the average age of the parents at the birth of their selected offspring (Falconer and Mckay Citation1996) and was calculated considering the four pathways: sire–son, sire–daughter, dam–son and dam–daughter.
Family size ‒ the number of offspring of an individual that becomes breeding individuals in the next generation (Falconer and Mckay Citation1996). The genetic contribution of the parents is usually not the same, leading to variation in family size and consequently an increase in the rate of inbreeding.
Pedigree quality
Number of fully traced generations (NTG) ‒ represents the number of generations separating an individual from its furthest ancestor.
Maximum number of complete generations (NCG) ‒ identifies the furthest generation with two known ancestors.
Number of equivalent complete generations (NECG) ‒ expresses the sum of all known ancestors counting how many generations have been traced. It is calculated for those individuals having at least one parent known following Maignel et al. (Citation1996):
(1)
where
Pedigree completeness ‒ is related to the number of generations that separate the individual from its most distant ancestor and the number of equivalent full generations and was assessed by calculating the pedigree completeness index (PCI) based on five generations as proposed by MacCluer et al. (Citation1983). This parameter summarises the proportion of known ancestors in each ascending generation as follows:
where
where
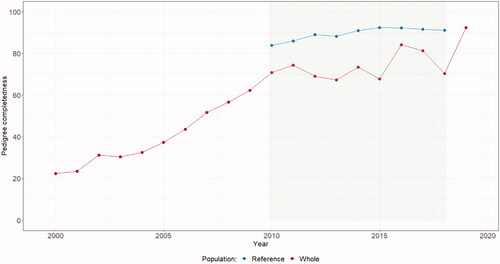
In order to provide enough information for accurate estimation of population genetic parameters, only animals with sufficient pedigree information (born from 2010 to 2018 with PCI ≥ 0.5 and NECG ≥ 3) were retained in the reference population (Figure ).
Figure 1. Average pedigree completeness index (PCI) by year of birth for animals in the pedigree (the green area corresponds to the reference population).
Parameters based on probability of gene origin
Number of founders (f) ‒ founder is an animal with unknown genetic connections to other animals in the pedigree except for its own progeny (Lacy Citation1989).
Effective number of founders (
where
Effective number of ancestors (
where
Effective number of founder genomes (
where is expected genetic contribution of the
founder and
is expected proportion of founders
alleles which remain in the current population. The
is an indication of the random loss of alleles. Since alleles are lost in every generation, the effective number of founder genomes decreases in every generation and is therefore sensitive to depth of pedigree (Sørensen et al. Citation2005). The ratio
/
indicates the impact of drift where lower values indicates more loss of genetic diversity through drift.
Parameters based on probability of gene origin
Coefficient of inbreeding (
Coefficient of co-ancestry ‒ the
Covariance components estimation and prediction of breeding values
Covariance components were estimated by REML using analytical gradients in the VCE–6 (Groeneveld et al. Citation2008) based on multi-trait repeatability test–day model. The same model was used to predict BVs. The model included the following fixed class effects: parity (1–6), litter size (singles, twins), the season of lambing (58 classes), and flock (92 classes). Days in milk (DIM), age at lambing, and the were fitted as covariates. DIM was modelled using the Ali–Schaeffer lactation curve (Ali and Schaeffer Citation1987) nested within parity and litter size for DMY and within parity for FC and PC. Age at lambing was modelled as linear regression nested within parity in the model for DMY. The random part of the model was the same for all traits and included flock–test–day, permanent environmental effect within lactations, direct additive genetic effect, and residual.
The matrix notation of the model is as follows:
(7)
(7)
where: y is a vector of the phenotypic observations, X is an incidence matrix for the fixed effects;
and
are incidence matrices for the flock–test–day, permanent environmental, and additive genetic effects, respectively;
is a vector of unknown fixed effects;
and
are vectors of unknown random effects;
is a vector of residuals. The variance structure of random effects is:
where
is an identity matrix for individual random effects and residual,
where
is an additive genetic relationship matrix, and
The assumption was that residuals, as well as trivial random effects, were not correlated.
Impact of inbreeding on dairy traits
The effect of inbreeding on phenotypes was obtained by regressing test day records on in the fixed part of the animal genetic model. The impact of inbreeding on dairy traits was additionally estimated by regressing BVs on
Results
The demographic structure of Istrian sheep is presented in Table . The average GI was 3.8 years. The GI differed between sires and dams. The longest GI was determined in the dam–daughter pathway which lasted 4.3 years, followed by dam–son (4.0 years). Higher GI for dam lines are often observed as females are usually kept in breeding for a longer period. The GI for sire–son and sire–daughter pathways were shorter and lasted 3.4 and 3.5 years, respectively. The maximum number of breeding progeny per sire and dam was 93 and 7, respectively. The average family size of sires and dams was 13.5 and 1.6, respectively.
Table 3. Demographic structure.
Pedigree completeness of the reference population is presented in Table . NECG, NTG, NCG, and PCI were 4.12, 2.69, 6.74, and 0.88, respectively. Figure shows PCI trends for the total and reference population. The steep increase in pedigree completeness observed from 2000 to 2010 was not surprising, as official pedigree recording in this population began in the early 2000s. The PCI for the reference population was above 80% throughout the period studied and exceeded 90% in the last two years. The correlation between the NECG and PCI was 0.96, confirming that they assess more or less the same thing.
Table 4. Pedigree quality of the reference population.
Estimates of the population parameters involved in assessing genetic variability are presented in Table . The number of female and male founders () was 923 and 282, and the number of effective founders (
) 105 and 137, respectively. The
which represents the minimum number of ancestors to allow a full explanation of the genetic diversity of the population, was 72 for males and 95 for females. A relatively small number of ancestors (28 males and 34 females) explained 50% of the genetic variability. The estimated
was 33 for males and 53 for females, indicating the presence of lower proportions of founder genes in the reference population. The
ratio, which estimates genetic loss due to unequal contribution of the founders was low, especially for ewes (0.15), evidencing substantial historical overuse of some animals. The
/
ratio was equally high for both genders (∼1.45) indicating a substantial loss of variability due to genetic bottleneck. The
/
ratio was similarly low for males (0.45) and females (0.39), additionally proving a substantial loss of founder alleles between generations.
Table 5. Pedigree-based estimates derived from the probabilities of gene origin.
The proportion of inbred and non-inbred animals was 72.05% and 27.95%, respectively (Table ). The highest proportion of animals (about 30%) had <6.25%, while
between 6.25% and 18.75% was found in about 30% of the animals. A high level of inbreeding (
>25%) was found in 10% of the population. The average
in the reference population was 7.83%. The average coefficient of co-ancestry was 0.0116. The average rate of inbreeding per generation was 0.31% (Figure ).
Figure 2. The number of all animals, number of inbred animals and average per generation.
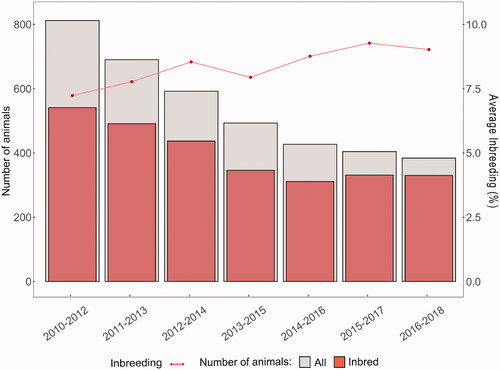
Table 6. Distribution of inbreeding coefficient () by classes of inbreeding and descriptive statistics of
in the reference population.
Heritabilities of MY (0.09 ± 0.004), FC (0.03 ± 0.002), and PC (0.06 ± 0.002) obtained from the multi-trait repeatability test–day model were low compared to commonly reported values for these traits in dairy sheep populations (Table ). Additive genetic correlations between DMY and FC, and DMY and PC were −0.22 and −0.27, respectively (Table ). The estimated additive genetic correlation between FC and PC was 0.70.
Table 7. Ratios of variance components in total variance (± standard errors).
Table 8. Genetic correlations between dairy traits.
Regression of phenotypic values on the revealed negligible but significant inbreeding depression (p < .01) for all traits (Table ). It was estimated that a 1% increase in
decreased DMY, FC, and PC for 0.002 kg/day, 0.01%, and 0.002%, respectively. The regression of breeding values on
was both negligible and insignificant (p > .05) for all traits analysed.
Table 9. Estimation of regression slope of on dairy traits.
Discussion
Monitoring genetic variability in populations undergoing selection is an important step in livestock breeding programs and can be accomplished using a variety of ‘tools’. Nowadays, genomic data overtake the main role in this field (Meuwissen et al. Citation2020), however, pedigree-derived parameters still represent the major source of information in many studies and conservation breeding programs (Goyache et al. Citation2003; Gutiérrez et al. Citation2003). Estimation of genetic parameters related to diversity (effective number of founders, ancestors, inbreeding, etc.) and inheritance of traits (heritabilities and genetic correlations) from genealogical data significantly depends on the construction of the reference population. Only animals with sufficient ancestral information fairly contribute to the estimates of population-specific parameters and only they should compose the reference population (Boichard et al. Citation1997; Gutiérrez et al. Citation2003; Sørensen et al. Citation2005). Deep quality control of the overall pedigree in this population revealed a steep decline in the pedigree completeness with each ancestral generation which was not surprising since both, phenotype and pedigree recording, in this population started about two decades ago. However, the ‘poor’ pedigree quality parameters were related to the very old animals that were not included in further analysis. Animals born after 2010 showed a much better pedigree profile, especially after the additional pruning (NECG, NTG, NCG, and PCI were 4.12, 2.69, 6.74, and 0.88, respectively).
Even though it was not the main goal of the study, we estimated the generation interval (GI) because it represents an important population parameter for predicting response to selection and provides an indication about dynamics of generations change in the population under concern. Since increased selection intensity tends to reduce GI, it results in a more rapid loss of genetic variability (Boichard et al. Citation1997; Gutiérrez et al. Citation2003), it can also provide some insight about the level of genetic erosion in populations under selection. The average GI (3.8 years) fits well with estimates of this parameter in many dairy sheep populations (Barros et al. Citation2017; Hashemi and Hossein-Zadeh Citation2020) suggesting intermediate selection pressure. Taking into account selection for milk yield and the above-noted relationship between GI and loss of genetic variability, the shorter sire-progeny pathway leads us to the conclusion that rams had a greater contribution to genetic erosion in this population.
The genealogical parameters based on probabilities of gene origin, such as
have been recognised as important population demographic parameters since their conceptualisation (Boichard et al. Citation1997) and have been widely used in many studies on genetic diversity in livestock populations (Toro et al. Citation2014). The parameters
are very sensitive to the subset of populations used in their estimation, so the ratios
and
/
are more conclusive. By simultaneously taking into account the estimates of the above parameters, it is obvious that the Istrian sheep has suffered a substantial loss of genetic variability. The
of 0.37 (rams) and 0.15 (ewes) indicate disequilibrium between founder contributions and evidence the overuse of a small number of animals as parents over many generations. This result was not surprising when considering the size of this closed population and the practices of breeders in their flocks. In many of the flocks encompassed by this study, breeders rarely purchase rams from another flock, thus increasing inbreeding and reducing genetic variability. The
has been ‘poorly’ reported for sheep populations (e.g. Goyache et al. (Citation2003) reported 0.24 in Xalda, Ghafouri-Kesbi (Citation2010) reported 0.14 in Zandi, and Mokhtari et al. (Citation2014) reported 0.086 in Iran-Black sheep). The most commonly reported measure was
This parameter has been associated with the ‘bottleneck’ effect in wild populations, analogous to the anthropogenic ‘culling’ force in domestic animals. The
approaching to unity represents a desirable state of the population from a conservation point of view and our estimate for this parameter was quite high for both genders (∼1.45). The result obtained indicates a substantial loss of genetic diversity due to a lower than possible number of effectively contributing animals which were used in the reproduction. Significantly lower estimates of
were reported in Morada Nova hair sheep (∼1.0, McManus et al. Citation2019), Shall (1.001, Hashemi and Hossein-Zadeh Citation2020), Dorper (1.09, Kiya et al. Citation2019), Segurena (1.12, Barros et al. Citation2017), Iran-Black sheep (1.18, Mokhtari et al. Citation2014), and Moghani breed (1.22, Mokhtari et al. Citation2015), but there were also reports of considerably higher estimates such as for Baluchi sheep (1.7, Tahmoorespur and Sheikhloo Citation2011), Xalda (2.02, Goyache et al. Citation2003), and Kermani sheep (2.07, Mokhtari et al. Citation2013). Ancestors are considered to have a large marginal contribution to the reference population if their genes were passed through many descendants. According to our estimates, about 50% of the total genetic variation was explained by only 28 rams and 34 ewes. Our pedigree quality control gave substantial credibility to the obtained results, but they undoubtedly deviate from the true parameters due to the lack of pedigree information for some animals. It is ungrateful to compare these results between populations, but it seems that the Istrian sheep lies somewhere between the above-mentioned sheep populations. The
which accounts for all random losses of genes during segregations was estimated to be 33 rams and 53 ewes, additionally proving that some sires and dams were used more intensively in reproduction. A similar
was reported for Kermani (48, Mokhtari et al. Citation2013), and higher
for Moghani (67, Mokhtari et al. Citation2015), and Zandi sheep (74, Ghafouri-Kesbi Citation2010). Simultaneous comparisons (rams and ewes) of estimated
(923, 282),
(105, 137),
(72, 95), and
(33, 53) and their ratios imply substantial loss of founder alleles in this population. However, since founders are always arbitrary, the obtained results must be taken with precaution and should serve as a good approximation (Mrode Citation2014).
Pedigrees of dairy sheep populations, particularly those bred in low-input systems, are often not as deep as those of dairy cattle which often leads to underestimation of the coefficient of inbreeding () and inbreeding rate. The
in this population was pretty high at 7.83% and well above the values commonly reported for sheep populations. A high proportion of animals (43%) had an
above 6.25%, exceeding the threshold for ‘passive inbreeding’ advocated by Miglior (Citation2000). The estimated
in the different sheep production types were mostly between 1 and 4 as follows: Zandi and Afshari sheep (1.46% and 1.2%, Ghafouri-Kesbi Citation2010, Citation2012), Xalda sheep (1.5%, Goyache et al. Citation2003), Shall sheep (1.62%, Hashemi and Hossein-Zadeh Citation2020), Mehraban sheep (1.69%, Yavarifard et al. Citation2014), Santa Inês sheep (2.33%, Pedrosa et al. Citation2010), Moghani sheep (2.93%, Hossein-Zadeh Citation2012), French dairy sheep breeds (2.34–3.11%, Rodriguez-Ramilo et al. Citation2019), Elsenburg Merino high and low lines (3.9% and 1.6%, Jorgensen et al. Citation2020), Bharat Merino sheep (2.59%, Gowane et al. Citation2013), and for seven low numbered French sheep populations (1.9–2.4% Danchin-Burge et al. Citation2010). Estimates below 1% were reported for Guilan (0.15%, Eteqadi et al. Citation2014), Dorper (0.32%, Kiya et al. Citation2019), and Segurena sheep (0.60%, Barros et al. Citation2017). However, many of the above studies did not report pedigree completeness and criteria for defining the reference population, so inbreeding may have been underestimated due to missing pedigree information.
The Istrian sheep is a small closed population with sufficient ancestral information to detect inbreeding, and the determined was somewhat to be expected, especially when selection is considered. In small populations, there are generally fewer candidate animals to select from, and breeding without a specifically designed mating plan tends to increase
especially in trait-selection breeding programs with the mating of superior animals that share more IBD alleles (inherited from common ancestors). The average rate of inbreeding was estimated to be 0.31% which could be threatening to the genetic diversity of the population. It is impossible to completely avoid inbreeding in this low-numbered sheep population, but an exchange of rams between flocks (Goyache et al. Citation2003) or using a rotational mating scheme (Mokhtari et al. Citation2013) should be helpful to maintain it at an acceptable level. The above schemes should be helpful not only in maintaining genetic diversity but also in providing genetic links between flocks which is an important prerequisite for a successful between flock BLUP genetic evaluation system (Simm et al. Citation2001; Eikje et al. Citation2008).
The average coefficient of co-ancestry can be used as a good proxy for genetic heterogeneity, but it is not as informative as (e.g. a large number of selected related animals such as sibs produced by ‘re-matings’ do not necessarily imply an increase in homogeneity caused by inbreeding). This is particularly true for optimisation selection programs where the coefficient of co-ancestry plays an important role in generating mating schemes ( Eteqadi et al. Citation2014; Ghavi Hossein-Zadeh Citation2016). The estimate of average relatedness (0.0116) was pretty high compared to some other breeds such as Shall (0.000072, Hashemi and Hossein-Zadeh Citation2020), Guilan (0.000144572, Eteqadi et al. Citation2014), and Mehraban sheep (∼0.0002, Yavarifard et al. Citation2014). The reasons are the same as discussed above for
Selection for dairy yield traits in this population is likely to continue so the further loss of genetic variability is expected. However, the rate of genetic erosion should be slowed, preferably by applying the principles of Optimal Contribution Selection (OCS, Colleau et al. Citation2004; Hinrichs et al. Citation2006). The genetic contributions of selected candidates to the next generation should be optimised to balance the benefits and risks of selection by maximising genetic gain and restricting the matting of closely related animals. The earlier the OCS is implemented, the greater the benefit can be expected. Initial steps towards genomic OCS in this population have already been conducted, and the willingness of breeders to participate appears promising for the breed from both perspectives, conservation and selection.
The trait-related genetic parameters play an important role in predicting genetic gain and their estimation is very sensitive to the population genetic background and the statistical model used to estimate them. Accordingly, it is very ungrateful to use the genetic parameters estimated in one population for genetic evaluation (or prediction of genetic gain) in another population, which is why we devoted the second part of the study to this issue. Heritabilities for DMY (0.09), FC (0.03), and PC (0.06) were generally low and to some extent comparable only to estimates reported by Komprej et al. (Citation2009) for three Slovenian dairy breeds, Oravcová et al. (Citation2005) for Improved Valachian, and Othmane et al. (Citation2002) for the Churra breed. In the majority of other studies, heritabilities were considerably higher, and regularly exceeded 0.15 for DMY (e.g. 0.18, El-Saied et al. Citation1998), 0.20 for FC (e.g. 0.24, Barillet and Boichard Citation1994), and 0.20 for PC (e.g. 0.20, Hamann et al. Citation2004). The low heritability in this population likely reflects directional selection that reduces additive genetic variance in the population (so called Bulmer effect, Bulmer Citation1971). The estimates probably reflect the true parameters in this population, but it is also possible that they were misestimated as a consequence of low connectedness between flocks due to the limited exchange of breeding animals between them. Additive genetic correlations between DMY and FC, DMY and PC, and FC and PC were −0.22, −0.27, and 0.70, respectively. Their direction was generally in agreement with a majority of previous reports, while the magnitude was most consistent with the reports of Brežnik et al. (1999) for Slovenian dairy breeds (–0.29, −0.31, and 0.63) and Oravcová et al. (Citation2005) for Improved Valachian (–0.29, −0.30, and 0.57) and Tsigai breeds (–0.23, −0.27, and 0.58). Although higher milk yield leads to higher protein and fat yield per ewe and still results in higher profitability for breeders, the obtained correlations suggest that further selection only for DMY will definitely ‘dilute’ milk, which might make it unsuitable for cheese manufacturers in Istria. Therefore, we hereby encourage multi-trait approach selection to achieve a balance between milk yield and its’ quality loss. This approach was proposed by the national selection program for this breed but is still rarely applied among the breeders.
The third part of the study was devoted to the impact of inbreeding on dairy traits. Trait-related effects of inbreeding were usually reported for lower fertility, prolificacy, disease resistance, vigour, and survivability in many livestock populations. However, information about the impact of inbreeding on dairy traits in lactating animals has been pretty scarce, particularly for sheep. The results of some previous studies on sheep have led us to hypothesise that inbreeding affects dairy yield traits as well (e.g. the negative correlation between inbreeding and retained heterosis for dairy traits (Murphy et al. Citation2017) and the negative impact of ewe’s level of inbreeding on the early performance of her lambs (Ercanbrack and Knight Citation1991; Norberg and Sorensen Citation2007). By estimating the impact of inbreeding using an animal genetic model, these results represent some of the first direct insights into this issue in dairy sheep populations. Fitting the covariate in the multivariate statistical model allowed estimation of this effect by simultaneously accounting for all available information affecting phenotype. The statistical significance of the effect examined suggested the potential presence of inbreeding depression, but the very limited magnitude of the effect made the results inconclusive to great extent. These small magnitudes of the effect could be due to a skewed distribution of the
i.e. the prevalence of animals with low
The majority of the population (∼ 63%) had
below 12.5%, which could ‘dilute’ the true magnitude of inbreeding, as 10% (‘rule of the thumb’) is considered a benchmark for detecting deleterious effects of inbreeding on reproduction or immune response to disease. For more conclusive results, i.e. to capture the true effect, it would be necessary to have more inbreds with high
However, we hope that such a scenario will not occur in this population in the future, as we are taking all possible actions to keep
low by following the principles of Optimal Contribution Selection to prevent further genetic erosion and the possible deterioration of ‘fitness’ traits. Further studies on this issue are needed, preferably in already highly inbred populations using a similar statistical approach (animal genetic model) and not by simply regressing
on phenotypes (the most common approach). All parameters estimated in this study suggest that the basic principles of Optimal Contribution Selection should be followed in order to optimally exploit the genetic pool in terms of selection and conservation of this breed.
Conclusion
The analysis of genetic variability and trait-related parameters provided valuable information on past breeding activities in the population of the Istrian sheep. The determined parameters of genetic diversity impose a need to prevent further loss of genetic variability while trying to keep the selection going on. To achieve genetic gain, selection must be based on the estimated breeding values. This is especially important in the presence of the low heritabilities as determined here. Results pertaining to the effect of inbreeding on dairy traits are not entirely conclusive and require additional study prior to any generalisation. In the future, a carefully designed breeding plan needs to be applied to maximise the available genetic pool of this breed, preferably following the basic principles of Optimal Contribution Selection.
Acknowledgments
The authors thank the Croatian Science Foundation for its financial support. The authors also acknowledge the support from Istrian sheep breeders, the Croatian Agency for Agriculture and Food, and the Ministry of Agriculture.
Disclosure statement
No potential conflict of interest was reported by the author(s).
Data availability statement
All data analysed during this study are included in this published article. The data reported in this study are available from the corresponding author, Marija Špehar, PhD.
Additional information
Funding
References
- Ali TE, Schaeffer LR. 1987. Accounting for covariances among test day milk yields in dairy cows. Can J Anim Sci. 67(3):637–644.
- Astruc JM, Barillet F, Barbat A, Clément V, Boichard D. 2002. Genetic evaluation of dairy sheep in France. In Proceedings of the 7th World Congress on Genetics Applied to Livestock Production. Montpellier, France, p. 231–234.
- Barillet F, Boichard D. 1994. Use of first lactation testday data for genetic evaluation of the Lacaune dairy sheep. In Proceedings of the 5th World Congress on Genetics Applied to Livestock Production. Guelph, Canada, p. 111–114.
- Barros EA, Brasil LHA, Tejero JP, Delgado-Bermejo JV, Ribeiro MN. 2017. Population structure and genetic variability of the Segurena sheep breed through pedigree analysis and inbreeding effects on growth traits. Small Rumin Res. 149:128–133.
- Barbosa ACB, Romano GSR, Velarde JMDS, Ferraz JBS, Pedrosa VB, Luis Pinto FB. 2020. Pedigree analysis of Santa Inês sheep and inbreeding effects on performance traits. Rev Mex Cienc Pecu. 11(2):590–604.
- Baro JA, Carriedo JA, San Primitivo F. 1994. Genetic parameters of test day measures for somatic cell count, milk yield, and protein percentage of milking ewes. J Dairy Sci. 77(9):2658–2662.
- Bauer J, Milerski M, Přibyl J, Vostry L. 2012. Estimation of genetic parameters and evaluation of test-day milk production in sheep. Czech J Anim Sci. 57(11):522–528.
- Boichard D, Maignel L, Verrier E. 1997. The value of using probabilities of gene origin to measure genetic variability in a population. Genet Sel Evol. 29(1):5–23.
- Boichard D. 2002. PEDIG: a fortran package for pedigree analysis suited for large populations. In Proceedings of the 7th World Congress on Genetics Applied to Livestock Production. Montpellier, France, p. 19–23.
- Brežnik S. 1999. Estimation of dispersion parameters of sheep milk traits [Master of Science Thesis]. Domžale, Slovenia: University of Ljubljana, Biotechnical Faculty, Zootechnical Department. p. 73.
- Bulmer MG. 1971. The effect of selection of genetic variability. Am Nat. 105(943):201–211.
- CAAF. 2020. Annual report for 2019. Sheep and Goats. Croatian Agency for Agriculture and Food, Osijek.
- Carta A, Casu S, Salaris S. 2009. Invited review: current state of genetic improvement in dairy sheep. J Dairy Sci. 92(12):5814–5833.
- Colleau JJ, Moureaux S, Briend M, Bechu J. 2004. A method for the dynamic management of genetic variability in dairy cattle. Genet Sel Evol. 36(4):373–394.
- Danchin-Burge C, Palhiere I, Francois D, Bibé B, Leroy G, Verrier E. 2010. Pedigree analysis of seven small French sheep populations and implications for the management of rare breeds. J Anim Sci. 88(2):505–516.
- Domínguez-Viveros J, Rodríguez-Almeida FA, Medellín-Cázares A, Gutiérrez JP. 2020. Pedigree analysis in ten sheep populations in Mexico. Rev Mex Cienc Pecu. 11(4):1071–1086.
- Eikje LS, Ådnøy T, Klemetsdal G. 2008. The Norwegian sheep breeding scheme: description, genetic and phenotypic change. Animal. 2(2):167–176.
- El-Saied UM, Carriedo JA, Baro JA, De La Fuente LF, San Primitivo F. 1998. Genetic and environmental estimations for test-day and standardized milk yield of dairy sheep. Small Rumin Res. 27(3):209–215.
- Ercanbrack SK, Knight AD. 1991. Effects of inbreeding on reproduction and wool production of Rambouillet, Targhee, and Columbia ewes. J Anim Sci. 69(12):4734–4744.
- Eteqadi B, Hossein-Zadeh N, Shadparvar AA. 2014. Population structureand inbreeding effects on body weight traits of Guilan sheep in Iran. Small Rumin Res. 119(1–3):45–51.
- Falconer DS, Mckay TFC. 1996. Introduction to quantitative genetics. 4th edn. Longman, Harlow, England.
- Ghafouri-Kesbi F. 2010. Analysis of genetic diversity in a close population of Zandi sheep using genealogical information. J Genet. 89(4):479–483.
- Ghafouri-Kesbi F. 2012. Using pedigree information to study genetic diversity and re-evaluating a selection program in an experimental flock of Afshari sheep. Arch Anim Breed. 55(4):375–384.
- Hossein-Zadeh NG. 2012. Inbreeding effects on body weight traits of Iranian Moghani sheep. Arch Anim Breed. 55(2):171–178.
- Hossein-Zadeh N. 2016. Analysis of population structure and genetic variability in Iranian buffaloes (Bubalus bubalis) using pedigree information. Anim Prod Sci. 56(7):1130–1135.
- Gowane GR, Prakash V, Chopra A, Prince LLL. 2013. Population structure and effect of inbreeding on lamb growth in Bharat Merino sheep. Small Rumin Res. 114(1):72–79.
- Groeneveld E, Kovač M, Mielenz N. 2008. VCE User’s guide and reference manual, Version 6.0.
- Goyache F, Gutiérrez JP, Fernández I, Gomez E, Alvarez I, Díez J, Royo LJ. 2003. Using pedigree information to monitor genetic variability of endangered populations: the Xalda sheep breed of Asturias as an example. J Anim Breed Genet. 120(2):95–103.
- Gutiérrez JP, Altarriba J, Diaz C, Quintanilla R, Canon J, Piedrafita J. 2003. Pedigree analysis of eight Spanish beef cattle breeds. Genet Sel Evol. 35(1):43–63.
- Hamann H, Horstick A, Wessels A, Distl O. 2004. Estimation of genetic parameters for test day milk production, somatic cell count and litter size at birth in East Friesian ewes. Livest Prod Sci. 87(2-3):153–160.
- Hashemi M, Hossein-Zadeh NG. 2020. Population genetic structure analysis of Shall sheep using pedigree information and effect of inbreeding on growth traits. Italian J Anim Sci. 19(1):1195–1203.
- Hinrichs D, Wetten M, Meuwissen THE. 2006. An algorithm to compute optimal genetic contributions in selection programs with large numbers of candidates. J Anim Sci. 84(12):3212–3218.
- ICAR. 2018. International Committee for Animal Recording. Section 16. Guidelines for Performance Recording in Dairy Sheep and Dairy Goats. Changes approved by the ICAR General Assembly in Auckland, New Zealand, on 10th February 2018.
- Jorgensen P, Nel CL, Scholtz AJ, Cloete SWP. 2020. Pedigree analysis of the Elsenburg Merino resource flock. Agri Probe. 17(1):56–60.
- Kasap A, Špehar M, Držaić V, Mulc D, Barać Z, Antunović Z, Mioč B. 2019. Impact of parity and litter size on dairy traits in Istrian ewes. j Cent Eur Agric. 20(2):556–562.
- Kasap A, Ramljak J, Mioč B, Držaić V, Širić I, Jurković D, Špehar M. 2021. The impact of age at first lambing on milk yield and lactation length in a population of Istrian sheep under semi-intensive management. Animals. 11(6):1604–1610.
- Kiya CK, Pedrosa VB, Muniz KFA, Gusmão AL, Batista LFP. 2019. Population structure of a nucleus herd of Dorper sheep and inbreeding effects on growth, carcass, and reproductive traits. Small Rumin Res. 177:141–145.
- Komprej A, Gorjanc G, Kon D, Kovač M. 2009. Covariance components by a repeatability model in Slovenian dairy sheep using test-day records. Czech J Anim Sci. 54(9):426–434.
- Lacy RC. 1989. Analysis of founder representations in pedigrees: founder equivalents and founder genome equivalents. Zoo Biol. 8(2):111–123.
- Legarra A, Ugarte E, Arrese F. 2003. Analysis of the genetic progress in the Latxa breed breeding program. ITEA. 99:192–202.
- MacCluer JW, Boyce AJ, Dyke B, Weitkamp LR, Pfenning DW, Parsons CJ. 1983. Inbreeding and pedigree structure in Standardbred horses. J Hered. 74(6):394–399.
- Maignel L, Boichard D, Verrier E. 1996. Genetic variability of French dairy breeds estimated from pedigree information. Inter Bull. 14:49–54.
- McManus C, Facó O, Shiotsuki L, Jivago de PRJL, Peripolli V. 2019. Pedigree analysis of Brazilian Morada Nova hair sheep. Small Rumin Res. 170:37–42.
- Meuwissen THE, Luo Z. 1992. Computing inbreeding coefficients in large populations. Genet Sel Evol. 24(4):305–313.
- Meuwissen THE, Sonesson AK, Gebregiwergis G, Woolliams JA. 2020. Management of genetic diversity in the era of genomics. Front Genet. 11:880.
- Miglior F. 2000. Impact of inbreeding – managing a declining Holstein gene pool. In Proceedings of the 10th World Holstein Friesian Conference. Sydney, NSW, Australia, p. 108–113.
- Mioč B, Pavić V, Barać Z, Vnučec I, Prpić Z, Mulc D, Špehar M. 2011. Program uzgoja ovaca u Republici Hrvatskoj. (Breeding program for sheep in Croatia) Hrvatski savez uzgajivača ovaca i koza, Zagreb.
- Mioč B, Prpić Z, Barać Z, Vnučec I. 2012. Istarska ovca, hrvatska izvorna pasmina. Hrvatski savez uzgajivača ovaca i koza, Zagreb.
- Mokhtari MS, Shahrbabak M, Esmailizadeh AK, Abdollahi-Arpanahi R, Gutierrez JP. 2013. Genetic diversity in Kermani sheep assessed from pedigree analysis (Short communication). Small Rumin Res. 114(2–3):202–205.
- Mokhtari MS, Moradi Shahrbabak M, Esmailizadeh AK, Moradi Shahrbabak H, Gutierrez JP. 2014. Pedigree analysis of Iran-Black sheep and inbreeding effects on growth and reproduction traits. Small Rumin Res. 116(1):14–20.
- Mokhtari MS, Miraei-Ashtiani SR, Jafaroghli M, Gutiérrez JP. 2015. Studying genetic diversity in Moghani sheep using pedigree analysis. J Agric Sci Tech. 17:1151–1160.
- Mrode RA. 2014. Linear models for the prediction of animal breeding values, third ed. CABI Oxfordshire, UK.
- Murphy TW, Berger YM, Holman PW, Baldin M, Burgett RL, Thomas DL. 2017. Estimates of genetic parameters, genetic trends, and inbreeding in a crossbred dairy sheep research flock in the United States. J Anim Sci. 95(10):4300–4309.
- Norberg E, Sorensen AC. 2007. Inbreeding trend and inbreeding depression in the Danish populations of Texel, Shropshire, and Oxford Down. J Anim Sci. 85(2):299–304.
- Oravcová M, Groeneveld E, Kovač M, Peškovičová D, Margetı́n M. 2005. Estimation of genetic and environmental parameters of milk production traits in Slovak purebred sheep using test-day model. Small Rumin Res. 56(1–3):113–120. 2004.03.002
- Oravcova M. 2007. Genetic evaluation for milk production traits in Slovakian Lacaune sheep. Slovak J Anim Sci. 40(4):172–179.
- Oravcova M. 2014. Variance components and genetic parameters estimated for daily milk yield in individual months of lactation: the case of Tsigai sheep. Vet Med Zoot. 68 (90):55–59.
- Othmane MH, Carriedo JA, De la Fuente LF, San Primitivio F. 2002. Factors affecting test-day milk composition in dairy ewes, and relationships amongst various milk components. J Dairy Res. 69(1):53–62.
- Pedrosa VB, Santana JL, Oliveira PS, Eler JP, Ferraz JBS. 2010. Population structure and inbreeding effects on growth traits of Santa Inês sheep in Brazil. Small Rumin Res. 93(2-3):135–139.
- Piasentier E, Valusso R, Leonarduzzi R, Pittia P, Kompan D. 2002. Quality of Italian Istrian Milk lamb meat. Influence of carcass weight and feeding system. Ital J Anim Sci. 1(1):65–77.
- R Core Team. 2020. R: A language and environment for statistical computing. R Foundation for Statistical Computing, Vienna, Austria. Available online: https://www.R-project.org/. (accessed on 1 April 2021).
- Rodriguez-Ramilo ST, Elsen JM, Legarra A. 2019. Inbreeding and effective population size in French dairy sheep: comparison between genomic and pedigree estimates. J Dairy Sci. 102(5):4227–4237.
- de Rochambeau H, Fournet-Hanocq F, Vu J, Khang T. 2000. Measuring and managing genetic variability in small populations. Ann Zootech. 49(2):77–93.
- Serrano M, Ugarte E, Jurado JJ, Pérez-Guzmán MD, Legarra A. 2001. Test day models and genetic parameters in Latxa and Manchega dairy ewes. Livest Prod Sci. 67(3):253–264. (00)00203-7
- Simm G, Lewis RM, Collins JE, Nieuwhof GJ. 2001. Use of sire referencing schemes to select for improved carcass composition in sheep. J. Anim. Sci. 79:255–259.
- Sørensen AC, Sørensen MK, Berg P. 2005. Inbreeding in Danish dairy cattle breeds. J Dairy Sci. 88(5):1865–1872. (05)72861-7
- Spehar M, Mulc D, Barać Z, Mioč B, Kasap A. 2020. Estimation of genetic parameters for dairy traits in Pag sheep with single and multi – trait test–day models. Small Rumin Res. 183:106029.
- Tahmoorespur M, Sheikhloo M. 2011. Pedigree analysis of the closed nucleus of Iranian Baluchi sheep. Small Rumin Res. 99(1):1–6.
- Toro MA, Villanueva B, Fernandez J. 2014. Genomics applied to management strategies in conservation programmes. Livestock Sci. 166:48–53.
- Vrdoljak J, Špehar M, Pavić V, Mioč B, Barać Z. 2012. The influence of environmental factors on daily milk yield and fat and protein content in Istrian sheep. Dairy. 62(3):192–199.
- Yavarifard R, Hossein-Zadeh NG, Shadparvar AA. 2014. Population genetic structure analysis and effect of inbreeding on body weights at different ages in Iranian Mehraban sheep. J Anim Sci Tech. 56(31):1–9..
- Wellmann R. 2019. Optimum contribution selection for animal breeding and conservation: the R package optiSel. BMC Bioinformatics. 20(1):25.