
Abstract
This study was conducted to determine the effects of different proportions of Broussonetia papyrifera (BP)-fermented feed in the diet to replace part of soybean meal on the production performance, egg quality and caecal microbiota of laying hens in the late laying period. In the experiment, 360 Hy-line brown laying hens (67-week-old) were randomly divided into 4 groups with 6 replicates in each group and 15 chickens in each replicate. The control group was fed with basic diets, and EG1, EG2 and EG3 groups were used in 1.5%, 3% and 4.5% BP-fermented feed to replace corn and soybean meal in the basic diet, respectively. The pre-feeding period was 7 days, and the experiment period was 56 days. In terms of production performance, the average daily egg production in the EG3 decreased significantly compared with that in the control group (p < .05). In terms of caecal microorganisms, the abundance indices of Sobs, Chao, and ACE community distribution in EG2 significantly increased compared with those in the control group (p < .05). At the phylum level, the abundance of WPS-2 in all experimental groups significantly increased (p < .05). The abundance of Actinobacteria in EG1 increased significantly, and that of Campilobacterota and Elusimicrobiota in EG2 significantly increased (p < .05). At the genus level, Olsenella in EG1 increased significantly (p<.05) and UCG-008 in EG3 increased significantly (p < .05) with increasing replacement ratio of BP-fermented feed compared with the control group. The results suggest that based on the production performance, the recommended replacement amount is 3%.
BP-fermented feed can be used as a new protein feed in layers diet at late laying stages.
BP-fermented feed had no significant impact on improved egg production performance and egg quality.
Replacing part of soybean meal with BP-fermented feed can significantly increase the WPS-2 and Actinobacteria and other phyla, resulting in changes in the intestinal microbes of laying hens.
Highlights
Introduction
Corn and soybean meal are the main components of poultry feed, of which soybean meal (SBM) usually accounts for more than 40% of the diet (Al-Ajeeli et al. Citation2018). Given that soybean meal is genetically modified, the health problems of poultry are related to the use of soybean meal in the diet (Lappè et al. Citation1998). The main anti-nutritional factors of soybeans are trypsin inhibitors, lectins, isoflavones and saponins (Sharma et al. Citation2013). If soy oestrogen isoflavones, such as genistein are transferred to eggs, then they may have adverse effects on human health (Saitoh et al. Citation2001). Therefore, reducing or replacing part of the corn and soybean meal in the diet should be considered to reduce the adverse health effects on poultry.
Broussonetia papyrifera (B. papyrifera), which belongs to the family of Moraceae, is also known as mulberry tree, mulberry, paper wood, banknote tree, milk tree and deer tree. It is a perennial deciduous tree, and it is widely distributed, fast-growing and highly adaptable (Yalley et al. Citation2020). The roots (Ryu et al. Citation2010), fruits, leaf (Tsai et al. Citation2009), bark and stems of B. papyrifera have anti-oxidation (Tsai et al. Citation2009), anti-pain (Lin et al. Citation2008), anti-tyrosinase (Tian et al. Citation2019) and anti-inflammatory (Ko et al. Citation2013) properties. Chinese scholars have bred a new hybrid of B. papyrifera with a crude protein (CP) content as high as about 20%, which is similar to the protein content in feeds, such as soybean meal and alfalfa (Peng et al. Citation2019). As one of China’s top 10 targeted poverty alleviation projects, over 300,000 hectares of B. papyrifera are cultivated in China (Si et al. Citation2018). Given that its crude fibre content is higher than that of alfalfa and mulberry leaves, it affects the palatability and is not conducive to the digestion and absorption of livestock and poultry. Through silage fermentation, the probiotics can be enriched, and the palatability can be effectively improved and release more protein that can be used by animals (Si et al. Citation2018). Zhang et al. (Citation2019) reported that added 20% and 30% BP-fermented feed to Xiangsha pig diet and found that it had no significant effect on its growth performance and could improve muscle flavour and quality. However, the application of BP-fermented feed in poultry has not been reported.
The intestinal microbiota is a collection of hundreds of microbial groups, which play an important role in feed metabolism, stimulating the immune system, and competing and repelling pathogenic microorganisms (Elokil et al. Citation2020). The integrity of gastrointestinal and intestinal microbial communities plays an important role in nutrient absorption, immune development and disease resistance (Liu et al. Citation2021) (Jandhyala et al. Citation2015). Changes in gastrointestinal microbial community may have implications on feed efficiency, productivity and health of chickens (Shang et al. Citation2018). Understanding the roles of chicken gastrointestinal tract microbiota and current methods used in microbiome research is essential to improve the poultry gastrointestinal tract microbiome.
Hy-Line Brown laying hens are favoured by many breeders because of their gentle temperament, strong adaptability, early production, long period of peak egg production, good production performance, more eggs, high survival rate and high feed conversion rate. With the ageing of laying hens, some problems occur in the late stage of laying, such as decline in production performance and egg quality (Wang et al. Citation2018). It has become one of the research hotspots in the poultry industry to improve the production performance and egg quality in the later stage of laying and prolong the peak period of laying. BP-fermented feed contains flavonoids and terpenoid chemicals, which have certain antibacterial and antiviral effects that can improve the immunity of livestock and poultry (Tian et al. Citation2019). However, that limited information available on the effects of BP-fermented feed as a feed additive on poultry diets, particularly on the intestinal microbiota in the late laying period. We hypothesised that diets with BP-fermented feed can improve the quality of the egg and the performance of laying hens through gut microbial changes during the late laying period. Thus, the present study was conducted to determine the effects of different proportions of BP-fermented feed in the diet to replace part of soybean meal on the egg production, egg quality, and caecal microbiota of laying hens during the late laying period to provide valuable reference for the application of BP-fermented feed as a new protein feed.
Material and methods
All the animal experiments were approved by the Institutional Animal Care and Use Committee of the Henan University of Science and Technology, Luoyang, China. (HAUST-EAW-2021-C00227)
Preparation of BP-fermented feed
The BP-fermented feed was produced by Hejia (Luoyang) Agricultural Technology Co., Ltd. When the plant height reached 90–120 cm, it was cut and crushed. Enterococcus faecalis (CICC10396) was added into water and activated for 2–3 h. After that, 0.5 g of Enterococcus faecalis (1 × 10¹¹cfu/g) was added per kilogram of B. papyrifera powder, and the mixture of the feed ingredients was put into packaging bags and sealed for fermentation at 25–30 °C for 20 days.
The nutrient level of fermented feed of the whole plant is shown in Table . Dry matter (DM), crude protein (CP), crude ash (Ash), crude fibre (CF), neutral detergent fibre (NDF) and acid detergent fibre (ADF) were determined according to the method of Zhang Liying (Zhang Citation2007).
Table 1. Nutrient levels of Broussonetia papyrifera (BP)-fermented feed (air-dry basis) [%].
Laying hens, diets and experimental design
Hy-Line Brown layers (67-week-old, n = 360) were randomly divided into 4 treatment groups with 6 replicates of 15 hens. The hens were housed in 120 cages with a size of 64 cm × 35 cm × 35 cm (three hens each). The hens had free access to feed and water during the experiment and exposed to a 16:8 light–dark cycle. The average room temperature was 20 ± 3 °C. Differences in egg production rate among the four groups before the start of the experiment were insignificant.
Laying hens in the control group were fed with corn-soybean meal-based laying hen basal diet, and those in the experimental groups were given with basic diet with 1.5% BP-fermented feed (EG1), 3% BP-fermented feed (EG2) and 4.5% BP-fermented feed (EG3) replacing corn and soybean meal in the basic diet. The diets were formulated to be isocaloric and isonitrogenous and to meet the nutrient requirements of laying hens according to the Management Guide of National Research Council (NRC, 1994). Crude protein (method 976.06), available phosphorus (method 993.31), calcium (method 927.02) and amino acid composition (method 994.12) were analysed in accordance with the method of AOAC (1999). Table shows the composition and nutrient levels of the basal diet. The entire process included a 7-day pre-experiment and a 56-day formal experiment.
Table 2. Composition and nutrient levels of the basal diet (air-dry basis) [%].
Production performance
During the experiment period, eggs were collected at 17:00 every day, and the number of eggs laid and weight of eggs in each group was recorded in detail. The feed intake of repeated layers in each group was counted every week. Average daily feed intake, average egg weight, average daily egg production, laying rate and feed-to-egg ratio were determined and recorded.
Egg quality
On the 28th and 56th days of the experiment, six saleable eggs (i.e. no shell defects or cracks), samples were collected for each repeat for egg quality determination. Eggshell colour, Haugh unit, albumen height and yolk colour were measured with egg quality analyser (ORKA EA-01, Israel). Among them, eggshell colour was measured with a QCR eggshell colour reflectometer. Haugh units were calculated from the HU formula [HU= 100 log (H − 1.7 W0.37 + 7.57)]. Egg shape index was calculated with electronic Vernier callipers. The strength of the eggshell was measured using strength tester (NFN388, Japan). After removing the inner shell membrane with tweezers, a spiral micrometer was used to measure the thickness of the sharp end, blunt end, and middle part of the eggshell thickness. An electronic analytical balance (Mettler-Toledo MS-TS, Switzerland) was used to measure the yolk and eggshell weight to calculate the relative weight of the yolk (yolk weight/egg weight × 100) and the relative weight of the eggshell (eggshell weight/egg Weight × 100).
Caecal microbiome
At the end of the transplantation experiment, one laying hen for each repetition was randomly selected, fasted for 12 h and subjected to carotid bloodletting to death. The laying hens were dissected on a sterile operating table, and the caecum was cut at the same site with sterilised scissors and a scalpel. The caecum sample was removed and placed in a sterile EP tube for temporary storage in liquid nitrogen. The sample was then transferred to −80 °C freezer and frozen for 16S rDNA V3-V4 region amplification and sequencing analysis.
DNA extraction and PCR amplification
Microbial DNA was extracted from the caecum samples by using the EZNA Soil DNA Kit (Omega Bio-tek, Norcross, GA, USA) in accordance with the manufacturer’s protocols. Final DNA concentration and purification were determined using a NanoDrop 2000 UV vis spectrophotometer (Thermo Scientific, Wilmington, USA). DNA quality was checked via 1% agarose gel electrophoresis. The V3–V4 hypervariable regions of the bacterial 16S rRNA gene were amplified with primers 338 F(5′-ACTCCTACGGGAGGCAGCAG-3′) and 806 R(5′-GGACTACHVGGGTWTCTAAT-3′) on a thermocycler PCR system (GeneAmp 9700, ABI, USA). The PCR reactions were conducted as follows: denaturation at 95 °C for 3 min, followed by 27 cycles at 95 °C for 30 s, 55 °C for 30 s and 72 °C for 45 s, and a final extension at 72 °C for 10 min. The reactions were performed in triplicate, and 20 μL of the reaction mixture contained 4 μL of 5 × FastPfu buffer, 2 μL of 2.5 mM dNTPs, 0.8 μL of each primer (5 μM), 0.8 μL of Reverse Primer (5 μM), 0.4 μL of FastPfu Polymerase, 0.2 μL of BSA and 10 ng of Template DNA and supplemented with ddH2O to 20 μL. The PCR products were electrophoresed using 2% agarose gel, purified using the AxyPrep DNA Gel Extraction Kit (Axygen Biosciences, Union City, CA, USA) and quantified using QuantiFluor-ST (Promega, USA) in accordance with the manufacturer’s protocol.
Illumina MiSeq sequencing
The purified amplicons were pooled in equimolar and paired-end sequenced (2 × 300) on an Illumina MiSeq platform (Illumina, San Diego, USA) in accordance with the standard protocols of Majorbio Bio-Pharm Technology Co., Ltd (Shanghai, China). The raw reads were deposited into the NCBI Sequence Read Archive database (accession PRJNA783706).
Sequencing data processing
Raw fastq files were demultiplexed, quality filtered using Trimmomatic and merged using FLASH with the following criteria: (i) the reads were truncated at any site receiving an average quality score < 20 over a 50-base pair (bp) sliding window; (ii) the primers were exactly matched, thereby allowing two-nucleotide mismatching, and the reads containing ambiguous bases were removed; and (iii) the sequences with overlaps longer than 10 bp were merged on the basis of their overlap sequences.
Operational taxonomic units (OTUs) were clustered with 97% similarity cut-off using UPARSE (version 7.1, http://drive5.com/uparse/). Chimeric sequences were identified and removed using UCHIME. The taxonomy of each 16S rRNA gene sequence was analysed using the RDP classifier algorithm (http://rdp.cme.msu.edu/) against the Silva (SSU123) 16S rRNA database with a confidence threshold of 70%.
Statistical analysis
Data were analysed using one-way ANOVA on SPSS 22.0 (SPSS Inc., Chicago, IL, USA). The significance of the mean differences among the groups was identified using the Tukey’s test. Data significance was determined at p<.05. Alpha diversity and rarefaction curve analyses consisting of community diversity (Simpson and Shannon indices) and richness indices (Sobs, Chao and ACE) were performed using mothur based on summary single command. Beta diversity analysis was performed to investigate the diversity among the samples. Principal component analysis (PCA) was calculated using mothur to describe distances among the samples. Permutational multivariate ANOVA (PERMANOVA) was used to conduct statistically significant analysis at the OTU level. The Wilcoxon rank-sum test was used to analyse significant differences in abundance at phylum and genus level among between the four groups.
Results
Production performance
Figure shows no significant difference in Egg-laying rate. Table shows the laying performance of hens. Compared with the CON, the average daily egg yield in EG3 was significantly reduced. The average daily feed intake (ADFI), average egg weight, egg production rate and there was no significant difference in the feed-to-egg ratio (p > .05). The mortality of each experimental group was significantly lower than that of the CON (p<.05).
Figure 1. Egg-laying rate period interaction line chart. CON: control group; EG1: 1.5% BP-fermented feed replacement group; EG2: 3% BP-fermented feed replacement group; EG3: 4.5% BP-fermented feed replacement group.
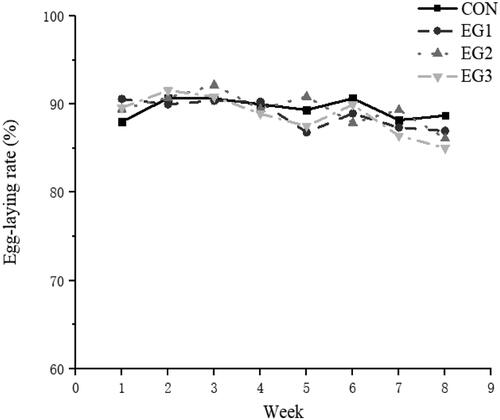
Table 3. Effects of Broussonetia papyrifera (BP)-fermented feed on performance of laying hens during later laying period.
Egg quality
Table shows the egg quality of hens. No significant effects on egg quality (egg shape index, eggshell colour, eggshell strength, albumen height, Haugh unit, yolk colour, eggshell thickness, relative weight of yolk, relative weight of egg shell and cholesterol content of egg yolk) of laying hens were found in the late laying period (p > .05).
Table 4. Effects of Broussonetia papyrifera (BP)-fermented feed on egg quality of laying hens during later laying period.
Caecal microbiota
Microbial diversity and community composition of caecal microbiota in laying hens were evaluated by 16 s rDNA amplicon sequencing. The optimised amplification region of the sample sequence was 338 F_806R, and the number of samples was 24. A total of 1,145,398 sequences, and 477,060,771 pairs of bases were obtained. The original data are shown in Table .
Table 5. Sequencing data.
Alpha diversity analysis
As shown in Figure , when the number of sequences is greater than 10,000, the rarefaction curves of each group of samples become flat, which indicates that the test sample sequence is sufficient and can cover most microbial populations.
Figure 2. Rarefaction curves (n = 6). The dilution curve is to randomly select a certain number of sequences from the sample and calculate the alpha diversity index of the samples corresponding to these sequences. The extracted data volume is used as the abscissa, and the alpha diversity index value is used as the ordinate to draw the curve according to whether the curve is flat to judge and whether the amount of sequencing data this time is sufficient. CON: control group; EG1: 1.5% BP-fermented feed replacement group; EG2: 3% BP-fermented feed replacement group; EG3: 4.5% BP-fermented feed replacement group.
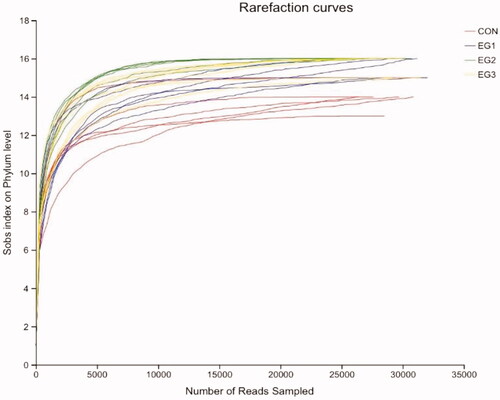
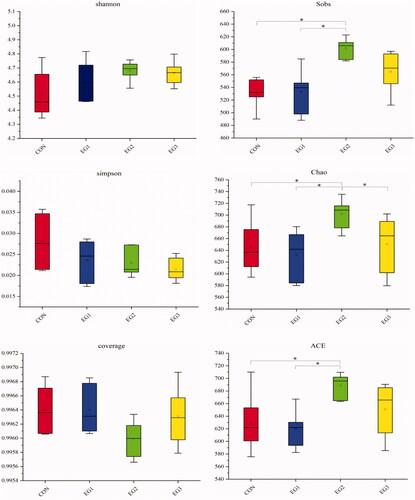
Figure shows no significant difference in the distribution diversity of the caecal microbial community between CON and BP-fermented feed replacement groups (p > .05). The abundance indices of Sobs, Chao and ACE community distribution in EG2 were significantly increased compared with those in CON (p < .05).
Figure 3. Alpha indexes data of caecum samples of hens. When studying the microbial diversity of the caecum, alpha diversity index is often used to reflect the diversity and abundance of the microbial community. The indexes for calculating the diversity of the community include Shannon and Simpson. Coverage index is used to describe community coverage. The indices used to calculate the abundance of community distribution are Sobs, Chao and ACE. CON: control group; EG1: 1.5% BP-fermented feed replacement group; EG2: 3% BP-fermented feed replacement group; EG3: 4.5% BP-fermented feed replacement group.
Beta diversity analysis
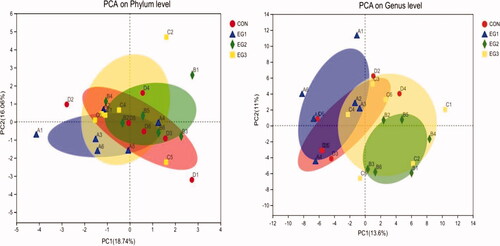
In Figure , CON and the BP-fermented feed replacement groups are basically indistinguishable at the phylum level due to error within the group, and the separation effect between groups is not significant (p > .05). At the genus level, the separation effect between CON and EG2 is obvious. Hence, caecal microflora significantly differed among CON and BP-fermented feed replacement groups (p < .05).
Figure 4. Score plot of PCA models. Principal component analysis (PCA) is a method used to simplify data set analysis to effectively establish the "main" in the data set. Part and structure, eliminate noise and redundancy, reduce the dimensionality of the complex data in the original sample, and visually display the simple structure behind the complex data. The abscissa and ordinate represent the two selected principal components, and the percentage represents the contribution of the principal component to the difference in sample composition. Points of different colours and shapes represent samples of different groups, and the closer the two sample points are, the more similar the composition of the two samples species is. CON: control group; EG1: 1.5% BP-fermented feed replacement group; EG2: 3% BP-fermented feed replacement group; EG3: 4.5% BP-fermented feed replacement group.
Species composition analysis
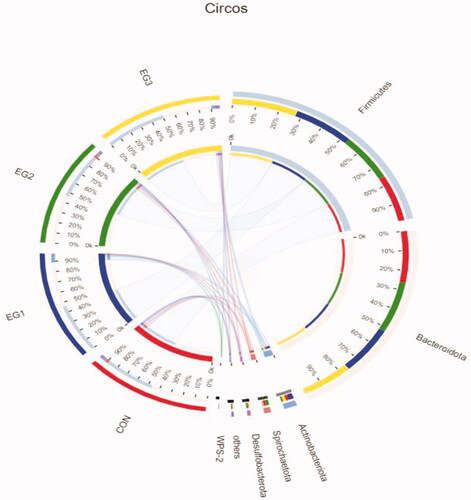
As shown in Figure , at the phylum level, the caecal microbial community of laying hens at the late laying stage evaluated through Illumina Miseq sequencing was divided into Firmicutes, Bacteroidetes, Actinobacteria, Spirochaetes, Deferribacteres, WPS-2 and other bacteria phyla. The dominant flora of each group at the phylum level was Firmicutes and Bacteroidetes, which account for about 90% of the total caecal microbes. The average relative abundance levels of Firmicutes in each group (CON, EG1, EG2, EG3) were 43.22%, 46.94%, 43.74% and 51.71%, respectively. The average relative abundance levels of Bacteroidetes in each group (CON, EG1, EG2, EG3) were 47.99%, 44.28%, 47.99% and 41.04%, respectively.
Figure 5. Circos samples and species relationship map at the Phylum level. In the Circos sample-species relationship diagram, the left semicircle indicates the composition of the species in the sample, the colour of the outer ribbon represents which group it comes from, the colour of the inner ribbon represents the species and the length represents the relative abundance of the species in the corresponding sample. The right semicircle represents the distribution ratio of species in different samples at the taxonomic level. The outer ribbon represents the species, the inner ribbon colour represents different groups and the length represents the distribution ratio of the sample in a certain species. CON: control group; EG1: 1.5% BP-fermented feed replacement group; EG2: 3% BP-fermented feed replacement group; EG3: 4.5% BP-fermented feed replacement group.
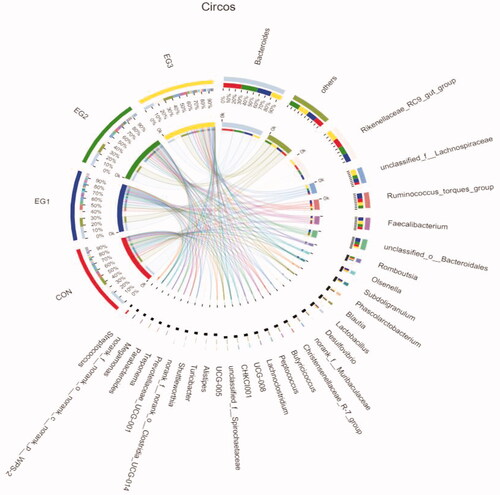
As shown in Figure , at the genus level, the caecal microbial community of laying hens at the later stage of laying evaluated through Illumina Miseq sequencing was found to be composed of Bacteroides, Rikenellaceae_RC9_gut_group, Ruminococcus_torques_group, Faecalibacterium and other bacterial genera. The dominant flora of each group at the genus level was Bacteroides and Rikenellaceae_RC9_gut_group (relative abundance at the genus level is greater than 12%). The average relative abundance levels of Bacteroides in each group (CON, EG1, EG2, EG3) were 24.13, 18.82, 22.25% and 15.2% respectively. The average relative abundance levels of Rikenellaceae_RC9_gut_group in each group (CON, EG1, EG2, EG3) were 13.21%, 12.2%, 13.06% and 14.66%, respectively.
Figure 6. Circos samples and species relationship map at the Genus level. In the Circos sample-species relationship diagram, the left semicircle indicates the composition of the species in the sample, the colour of the outer ribbon represents which group it comes from, the colour of the inner ribbon represents the species and the length represents the relative abundance of the species in the corresponding sample. The right semicircle represents the distribution ratio of species in different samples at the taxonomic level. The outer ribbon represents the species, the inner ribbon colour represents different groups and the length represents the distribution ratio of the sample in a certain species. CON: control group; EG1: 1.5% BP-fermented feed replacement group; EG2: 3% BP-fermented feed replacement group; EG3: 4.5% BP-fermented feed replacement group.
Species difference analysis
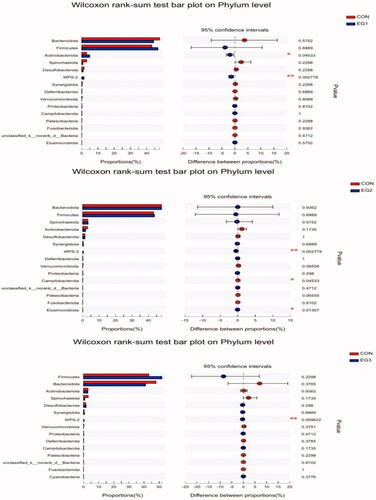
As shown in Figure , at the phylum level, the abundance of WPS-2 in all experimental groups significantly increased (p < .05). Compared with CON, the abundance of Actinobacteria in EG1 significantly increased (p < .05), and that of Campilobacterota and Elusimicrobiota in EG2 significantly increased (p < .05).
Figure 7. Wilcoxon rank-sum test bar plot on Phylum level. The Wilcoxon rank-sum test was used to analyse significant differences in species abundance at phylum level among the four groups. CON: control group; EG1: 1.5% BP-fermented feed replacement group; EG2: 3% BP-fermented feed replacement group; EG3: 4.5% BP-fermented feed replacement group.
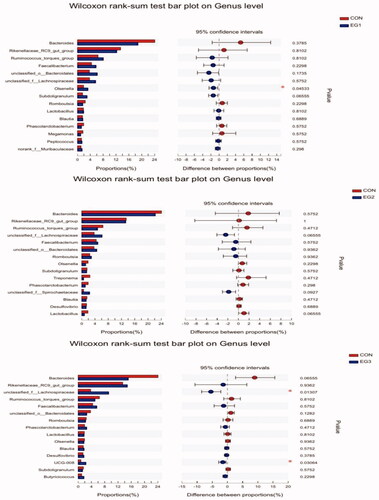
As shown in Figure , at the genus level, compared with CON, the abundance of the Olsenella in EG1 increased significantly (p < .05), and that of UCG-008 in EG3 significantly increased with the increasing replacement ratio of BP-fermented feed (p < .05).
Figure 8. Wilcoxon rank-sum test bar plot on Genus level. The Wilcoxon rank-sum test was used to analyse significant differences in species abundance at genus level among the four groups. CON: control group; EG1: 1.5% BP-fermented feed replacement group; EG2: 3% BP-fermented feed replacement group; EG3: 4.5% BP-fermented feed replacement group.
Discussion
Effects of BP-fermented feed on production performance and egg quality
At present, few reports are available on the application of BP-fermented feed in layer feed. In this experiment, no adverse effects were observed on the egg production rate, average daily feed intake, feed-to-egg ratio and average egg weight of laying hens with increasing substitution ratio of BP-fermented feed. However, in EG3, when the amount of the substitution of BP-fermented feed reached 4.5%, the egg production of laying hens was significantly reduced. Previous studies reported that the content of tannic acid would significantly decrease after fermentation (Rakesh et al. Citation2000). Anti-nutritional factors could form complexes with carbohydrate and protein, presumed may to be the cause of decreased production performance (Frazier et al. Citation2010).
Egg quality is mainly reflected by indicators such as egg shape index, egg shell strength, egg shell thickness, Huff unit and egg yolk colour(Silversides and Scott Citation2001). In the present study, no significant difference in egg quality parameters was found among the four groups.
Effects of BP-fermented on caecal microbiota
The sac of the chicken caecum is an important site for fermentation and digestion, which are vital to the health and immunity of poultry, and are the focus of research on intestinal microbiota (Pan and Yu Citation2014). Various dietary factors, including feed ingredients, antibiotic growth promoters, and diet supplements, may change the composition of the caecal microbiota (Hubert et al. Citation2019). The intestinal microbiota participates in regulating various host metabolic pathways, shaping the immune system (Shang et al. Citation2018), keeping the intestinal mucosa intact (Jandhyala et al. Citation2015), and secreting certain enzymes and other metabolites (Khan et al. Citation2020), which is beneficial to the host.
In evaluating the microbial diversity of caecum, alpha diversity index is often used to reflect the diversity and abundance of microbial communities. The indices for calculating the diversity of the community include Shannon and Simpson. Coverage index is used to describe community coverage. The indices used to calculate the abundance of community distribution are Sobs, Chao and ACE. In this experiment, the distribution abundance index of Sobs, Chao and ACE communities in EG2 increased significantly, indicating that the caecal microbial diversity increased.
Most of the microorganisms that form the caecal microbiota of chickens are Firmicutes, Bacteroides and Proteobacteria (Chen et al. Citation2020). Firmicutes and Bacteroides account for more than 90% of the relative abundance of intestinal microbiota, and they play a key role in maintaining intestinal homeostasis (Lan et al. Citation2005). In addition, the abundance of Actinobacteria, Elusimicrobiota and WPS-2 increased significantly in this experiment. Actinomycetes mainly included three anaerobic bacterium families such as Bifidobacterium, Propionibacterium and Corynebacterium (Barka et al. Citation2016), and the most representative of which is Bifidobacterium in the intestinal tract. Bifidobacteria produce a large amount of short-chain fatty acids (SCFA), which are the main final product of microbial fermentation. SCFAs not only promote the absorption of intestinal juice, but also have a proliferation effect on colon cells. Beneficial microorganisms inhibit the growth of pathogens through mechanisms, such as competitive rejection, secretion of SCFA, antimicrobial peptides and activation of the host immune system (Kulshreshtha et al. Citation2014), thereby improving the antibacterial activity of animals and maintaining the intestinal barrier (Binda et al. Citation2018). In the present study, the abundance of Actinobacteria increased, indicating that it has a potentially beneficial effect on improving intestinal health. We also observed significant differences in the relative abundance of Elusimicrobiota and WPS-2 between BP-fermented feed replacement groups and control group, but the function of these phyla in the caecum of hens is still unclear and needs further study.
At the genus level, the dominant flora in each group is Bacteroides and Rikenellaceae_RC9_gut_group. This result is similar to the report of Chen (Chen et al. Citation2020) but is inconsistent with the data of Wang (Wang et al. Citation2017). The difference in the results may be related to the age (Shang et al. Citation2018), breed (Zhao et al. Citation2013), diet (Kumar et al. Citation2018) and feeding environment (Nordentoft et al. Citation2011) of the chicken. In the present study, except for these unclassified genera, two main genera have large differences in proportion between CON and the BP-fermented feed replacement groups: Olsenella in EG1 increased significantly (p < .05), and UCG-008 in EG3 significantly increased. However, limited reports provide information about Olsenella and UCG-008. Therefore, evaluating the possible effect of the enrichment of this OTU on chicken’s caecum microbial community may be difficult. To the best of our knowledge, the effects of replacing part of the diet with BP-fermented feed on the hens’ caecal microbiota have not been reported yet. Therefore, the cause and effect relationships of these changes in the present study still need to be determined.
Conclusion
Partially replacing BP-fermented feed to the basic feed (corn -soybean meal) of laying hens at the late laying stage has no adverse effects on production performance and egg quality. It has a certain degree of influence on the structure of the caecal microbial flora, but has no adverse effect on the normal dominant flora. Based on the production performance, the recommended replacement amount is 3%.
Ethical approval
All the animal experiments were approved by the Institutional Animal Care and Use Committee of the Henan University of Science and Technology, Luoyang, China. (HAUST-EAW-2021-C00227).
Disclosure statement
No potential conflict of interests was reported by the authors
Additional information
Funding
References
- Al-Ajeeli MN, Leyva-Jimenez H, Abdaljaleel RA, Jameel Y, Hashim MM, Archer G, Bailey CA. 2018. Evaluation of the performance of Hy-Line Brown laying hens fed soybean or soybean-free diets using cage or free-range rearing systems. Poultr Sci. 97(3):812–819.
- Barka EA, Vatsa P, Sanchez L, Gaveau-Vaillant N, Jacquard C, Meier-Kolthoff JP, Klenk H-P, Clément C, Ouhdouch Y, van Wezel GP. 2016. Taxonomy, physiology, and natural products of actinobacteria. Microbiol Mol Biol Rev. 80(1):1–43.
- Binda C, Lopetuso LR, Rizzatti G, Gibiino G, Cennamo V, Gasbarrini A. 2018. Actinobacteria: a relevant minority for the maintenance of gut homeostasis. Dig Liver Dis. 50(5):421–428.
- Chen X, Zhan Y, Ma W, Zhu Y, Wang Z. 2020. Effects of antimicrobial peptides on egg production, egg quality and caecal microbiota of hens during the late laying period. Anim Sci J. 91(1):e13387.
- Chen X, Zhang Y, Ma W, Wang Z. 2020. Effects of Ligustrum lucidum on egg production, egg quality, and caecal microbiota of hens during the late laying period. Ital J Anim Sci. 19(1):687–696.
- Elokil AA, Abouelezz K, Adetula AA, Ahmad HI, Mo C, Sun C, Li S. 2020. Investigation of the impact of gut microbiotas on fertility of stored sperm by types of hens. Poult Sci. 99(2):1174–1184.
- Frazier RA, Deaville ER, Green RJ, Stringano E, Willoughby I, Plant J, Mueller-Harvey I. 2010. Interactions of tea tannins and condensed tannins with proteins. J Pharm Biomed Anal. 51(2):490–495.
- Hubert SM, Al-Ajeeli M, Bailey CA, Athrey G. 2019. The role of housing environment and dietary protein source on the gut microbiota of chicken. Animals. 9(12):1085.
- Jandhyala SM, Talukdar R, Subramanyam C, Vuyyuru H, Sasikala M, Nageshwar Reddy D. 2015. Role of the normal gut microbiota. World J Gastroenterol. 21(29):8787–8803.
- Khan S, Moore RJ, Stanley D, Chousalkar KK. 2020. The gut microbiota of laying hens and its manipulation with prebiotics and probiotics to enhance gut health and food safety. Appl Environ Microbiol. 86(13):e00600–00620.
- Ko HJ, Oh SK, Jin JH, Son KH, Kim HP. 2013. Inhibition of experimental systemic inflammation (septic inflammation) and chronic bronchitis by new phytoformula BL containing Broussonetia papyrifera and Lonicera japonica. Biomol Ther (Seoul)). 21(1):66–71.
- Kulshreshtha G, Rathgeber B, Stratton G, Thomas N, Evans F, Critchley A, Hafting J, Prithiviraj B. 2014. Feed supplementation with red seaweeds, Chondrus crispus and Sarcodiotheca gaudichaudii, affects performance, egg quality, and gut microbiota of layer hens. Poultr Sci. 93(12):2991–3001.
- Kumar S, Chen C, Indugu N, Werlang GO, Singh M, Kim WK, Thippareddi H. 2018. Effect of antibiotic withdrawal in feed on chicken gut microbial dynamics, immunity, growth performance and prevalence of foodborne pathogens. PLoS One. 13(2):e0192450.
- Lan Y, Verstegen MWA, Tamminga S, Williams BA. 2005. The role of the commensal gut microbial community in broiler chickens. World's. Poult Sci J. 61(1):95–104.
- Lappè MA, Bailey EB, Childress C, Setchell KD. 1998. Alterations in clinically important phytoestrogens in genetically modified, herbicide-tolerant soybeans. J Med Food. 1(4):241–245.
- Lin LW, Chen HY, Wu CR, Liao PM, Lin YT, Hsieh MT, Ching H. 2008. Comparison with various parts of Broussonetia papyrifera as to the antinociceptive and anti-inflammatory activities in rodents. Biosci Biotechnol Biochem. 72(9):2377–2384.
- Liu Y, Yan T, Ren Z, Yang X. 2021. Age-associated changes in caecal microbiome and their apparent correlations with growth performances of layer pullets. Anim Nutr. 7(3):841–848.
- Nordentoft S, Mølbak L, Bjerrum L, De Vylder J, Van Immerseel F, Pedersen K. 2011. The influence of the cage system and colonisation of Salmonella Enteritidis on the microbial gut flora of laying hens studied by T-RFLP and 454 pyrosequencing. BMC Microbiol. 11(1):187.
- Pan D, Yu Z. 2014. Intestinal microbiome of poultry and its interaction with host and diet. Gut Microbes. 5(1):108–119.
- Peng X, Liu H, Chen P, Tang F, Hu Y, Wang F, Pi Z, Zhao M, Chen N, Chen H, et al. 2019. A chromosome-scale genome assembly of paper mulberry (Broussonetia papyrifera) provides new insights into its forage and papermaking usage. Mol Plant. 12(5):661–677.
- Rakesh DD, Bhat TK, Singh B. 2000. Effect of fungal treatment on composition, tannin levels, and digestibility of black locust (Robinia pseudoacacia) leaves. J Gen Appl Microbiol. 46(2):99–103.
- Ryu HW, Lee BW, Curtis-Long MJ, Jung S, Ryu YB, Lee WS, Park KH. 2010. Polyphenols from Broussonetia papyrifera displaying potent alpha-glucosidase inhibition. J Agric Food Chem. 58(1):202–208.
- Saitoh S, Sato T, Harada H, Takita T. 2001. Transfer of soy isoflavone into the egg yolk of chickens. Biosci Biotechnol Biochem. 65(10):2220–2225.
- Shang Y, Kumar S, Oakley B, Kim WK. 2018. Chicken gut microbiota: importance and detection technology. Front Vet Sci. 5:254.
- Sharma S, Goyal R, Barwal S. 2013. Domestic processing effects on physicochemical, nutritional and anti-nutritional attributes in soybean (Glycine max L. Merill). Int Food Res J. 20(6):3203–3209.
- Si B, Tao H, Zhang X, Guo J, Cui K, Tu Y, Diao Q. 2018. Effect of Broussonetia papyrifera L. (paper mulberry) silage on dry matter intake, milk composition, antioxidant capacity and milk fatty acid profile in dairy cows. Asian Aust J Anim Sci. 31(8):1259–1266.
- Si B, Xu W, Zhang X, Guo J, Diao Q, Tu Y. 2018. Influence of different additives on fermentation quality of hybrid paper mulberry silage. Chin J Anim Nutr. 30(11):4670–4675.
- Silversides FG, Scott TA. 2001. Effect of storage and layer age on quality of eggs from two lines of hens. Poult Sci. 80(8):1240–1245.
- Tian JL, Liu TL, Xue JJ, Hong W, Zhang Y, Zhang DX, Cui CC, Liu MC, Niu SL. 2019. Flavanoids derivatives from the root bark of Broussonetia papyrifera as a tyrosinase inhibitor. Ind Crops Prod. 138:111445.
- Tsai FH, Lien JC, Lin LW, Chen HY, Ching H, Wu CR. 2009. Protective effect of Broussonetia papyrifera against hydrogen peroxide-induced oxidative stress in SH-SY5Y cells. Biosci Biotechnol Biochem. 73(9):1933–1939.
- Wang Y, Sun J, Zhong H, Li N, Xu H, Zhu Q, Liu Y. 2017. Effect of probiotics on the meat flavour and gut microbiota of chicken. Sci Rep. 7(1):6400.
- Wang XC, Wang XH, Wang J, Wang H, Zhang HJ, Wu SG, Qi GH. 2018. Dietary tea polyphenol supplementation improved egg production performance, albumen quality, and magnum morphology of Hy-Line Brown hens during the late laying period1. J Anim Sci. 96(1):225–235.
- Yalley MK, Adusu D, Bunyamin AR, Okyere I, Asare A. 2020. Natural Regeneration of Indigenous Tree Species in Broussonetia papyrifera Invaded Sites in Pra -Anum Forest Reserve. Int J for Res. 2020:1–9.
- Zhang L. 2007. Feed analysis and feed quality detection technology. Beijing, China: Agricultural University Press.
- Zhang X, Zhu S, Yang Q, Su Z, Tan H, Liu C, Wu M, Duan Y, Yin Y. 2019. Effects of Broussonetia papyrifera fermented feed on growth performance, carcass quality and meat quality of xiangsha pigs commercial line of commercial pigs. Chin J Anim Nutr. 12:5760–5771.
- Zhao L, Wang G, Siegel P, He C, Wang H, Zhao W, Zhai Z, Tian F, Zhao J, Zhang H, et al. 2013. Quantitative genetic background of the host influences gut microbiomes in chickens. Sci Rep. 3:1163.