
Abstract
Various environmental, constructional, and human-related factors affect overall eggs production. The egg poultry production has been analysed in barn housing system depending on birds' life cycle time and environmental conditions (carbon dioxide concentration, outdoor and indoor temperature, indoor relative humidity). Within the present research study, the data provided by the Baltic poultry industry company has been analysed. Outside temperature, environmental conditions, carbon dioxide (CO2) and ammonia (NH3) concentrations were continuously monitored in two-storey tunnel-ventilated layer house from January to June 2021. CO2 and NH3 gas concentrations were higher during the winter (p < .05). The outdoor temperature during investigation was in range from −27 °C to +13 °C. The indoor temperature and CO2 concentration were higher on the 2nd storey (p < .05) and influenced by outdoor temperature. The relationships between CO2 gas concentrations and environmental conditions (indoor and outdoor temperature, indoor relative humidity) have been detected in the research. The indoor relative humidity tended to be negatively correlated with indoor temperature (rxy = −0.59) and positively correlated with CO2 concentration (rxy = 0.68, rxy = 0.54); the indoor temperature increased, then relative humidity and CO2 decreased. Results showed that the hen-day egg production and feed conversion ratio (FCR) depend on the hen age (p < .05) and temperature (p < .05), and not depend on the CO2 levels. If the CO2 and NH3 levels are in acceptable range, gases will not influence hen performance.
Introduction
The housing system and environmental conditions at the farm play an essential role in improving hen productivity during the laying period of hens. Many factors and their interactions influence hen's performance, such as the breed, animal welfare, location, climate and management during the rearing and laying period (Yasmeen et al. Citation2008; Windhorst Citation2017). The laying hens housing systems permitted and used in the European Union are enriched cages and alternative systems (non-cage systems) (Council Directive 1999/74/EC Citation1999). The main advantages of keeping the laying hens in cages are better hygiene and the comparatively low risk of infection (Vučemilo et al. Citation2010). The main benefits of keeping in barn systems are hens’ freedom, moving, and increased bone strength of the hens. The environmental factors that determine laying hen productivity are temperature, relative humidity, ventilation, and lighting. The comfort temperature for hens ranged between 18 °C–22 °C, relative humidity between 60–70% and the temperature and humidity index (THI) should not exceed values greater than 70 for good egg production (Rosario Díaz et al. Citation2018). THI values for semi-cold bioclimate in Rosario Díaz et al. (Citation2018) research were evaluated using Dikmen and Hansen (Citation2009) equation, depending on indoor air temperature (°C) and indoor relative humidity (%).
Poultry is an essential contributor of ammonia (NH3) and also contribute to greenhouse gases (GHG) such as carbon dioxide (CO2), methane (CH4), and nitrous oxide (N2O) (Brouček and Čermák 2011). Emission intensity can be influenced by a combination of factors, depending on the species, system and region. Ventilation efficiency and rate improve the level and emissions of NH3 and CO2. Ammonia concentration in a poultry farm is proportional to ventilation rates. Poultry housing system, house cleaning frequency, and house cleaning methods influence the air quality at the farm. The ammonia and CO2 concentrations are influenced by season and outside temperature. According to Lim et al. (Citation2004) investigation, average daily ammonia concentrations from December to June were much higher during the colder months compare to the warmer months. During the summer, ammonia concentration is lower than in winter, and it is due to the higher ventilation rate in poultry houses during warm weather in summer. Ammonia concentration and ventilation rate tend to be lower during the winter; whereas, the temperature and ventilation intensity influence the ammonia and CO2 concentrations (Kilic and Yaslioglu Citation2014; Zheng et al. Citation2020).
Ammonia gas concentration at the farm reduces hens’ productivity and the egg quality due to respiratory and metabolic disorders; however, hen performance depends on the hen age, ammonia level, and duration of unacceptable ammonia level at farm. Significantly lower egg weight during investigation (Li et al. Citation2020) was found for hens kept under low temperature and higher ammonia concentrations (p < .05). The effect of CO2 and NH3 levels on egg production, feed consumption and feed conversion ratio was investigated by Kocaman et al. (Citation2006). Authors concluded that there is negative relationship between CO2 and egg production (r = −0.36).
This study aims are to analyse CO2 and NH3 levels and evaluate the effect of factors on gases in a commercial layer farm and check the hypothesis on the effect of CO2 levels on hens' productivity.
Material and methods
Birds and facilities
A Baltic laying hens’ farm participated in this study. The input and output production system data have been collected at the farm with nominal capacity of 120 thousands layer hens. Lohmann Brown breed layer hens have been kept in an alternative keeping system, such as a barn system – multi-tier aviaries. At the two-storey tunnel-ventilated barn without heating system, hen stoke density does not exceed nine laying hens per m2 usable area. Hens have been provided with automatic feeders and waterers. The stocking density changed during the production cycle due to hens’ mortality.
In study implemented farm the egg production system starts when 16 weeks old hens are placed in the building to prepare them for the laying cycle and begin laying eggs. Hens are kept for around 75 weeks, and when hens are about 90 weeks old and hens’ day productivity is lower than 70%, they are slaughtered. All–in and all-out production system has been applied. A downtime of approximately two weeks is implemented after each laying period. There are two weeks between production cycles. During this time, the building is cleaned and is disinfected.
The amount of feed and water, mortality rate, hen age and weight, and productivity (egg count and egg weight, g) has been controlled at the farm.
The feed is given ad libitum and the feeding program at the farm during the hens laying period was adapted to nutrient levels according to the hen age. Started from 50 weeks of age the main ingredients of the layer feed are wheat (around 42%) and maize (around 20%). Feed contains around 16% of protein and extra calcium for egg shell formation.
The total daily egg production and the number of defective eggs (dirty eggs, broken eggs) were recorded. The non-defective eggs were weighted and the average daily egg weight of non-defective eggs was calculated. Hen-day egg production (%) was calculated as the ratio of the total number of eggs produced in a day to the total number of hens presented on that day. Feed consumption ratio per kg egg mass (FCR/Kg) was calculated – the ratio of total feed consumed to the total egg mass. The total egg mass was calculated as average daily egg weight multiplied by the total number of hens presented on that day. Hen productivity data have been daily collected at the farm. The current research has used the data timescale from the 21st of January to the 08th of June 2021, when hens were 58–77 weeks old.
Environment monitoring
Outside temperature and the environmental conditions in laying hen house were measured daily. The environmental monitoring was carried out in laying hen house from the 21st of January till the 8th of June 2021 at the 1st and 2nd storey of the hen house.
Temperature and humidity were measured at a central point of the building. CO2 gas concentrations (ppm) was measured with infra-red gas sensor IR-2 (GDS Technologies Garforth, UK) and NH3 gas concentrations (ppm) with ammonia sensor NH3/MR-100 (Membrapor AG, Birkenweg, Switzerland). Continuous monitoring of the CO2 and NH3 gas concentration operated automatically with a 10 min sampling interval. The average CO2 and NH3 concentrations were calculated using hourly data. The log transformation reduces data variability, and the transformed values of CO2 and NH3 concentrations were used for further calculations.
Data analysis
The analysis of variance was used to determine hen house environmental conditions and CO2 significant differences among investigation months and among 1st and 2nd storey of the hen house. The differences among factor groups were compared using Bonferroni test.
Regression and correlation analysis were used to evaluate the relationship between
CO2 concentration levels and environmental conditions at the farm (indoor and outdoor temperature, indoor humidity);
the number of birds in lying hens' house and CO2 level;
hen age and hen productivity traits.
Hen-day egg production (%), egg weight (g), feed consumption ratio (FCR/Kg) depending on CO2 level and environmental factors (temperature and humidity).
The differences and relationship were considered significant when p-value < .05.
Results
Environmental conditions at farm
The relative indoor humidity of the hen house was in the range from 47% to 57%, and it was in the acceptable range. The indoor temperature on the 2nd storey is higher compared to the 1st storey (Figure ); thereby, the CO2 concentration is higher on the 2nd storey (Figure ). The indoor temperature on the 1st storey was influenced by weather conditions – outdoor temperature. The indoor temperature during winter and springtime on the first storey was from + 15 °C to + 21 °C and at the second storey was above 19 °C. The outdoor temperature during investigation was in range from −27 °C to +13 °C.
Figure 1. Indoor humidity (a), outdoor (outdoor T) and indoor temperature (IT) at 1st and 2nd storey (b).
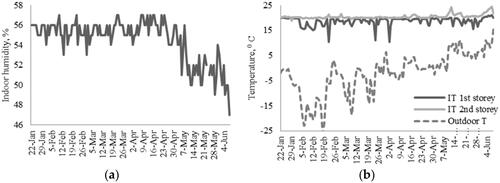
Figure 2. Transformed CO2 concentrations in the hen house.
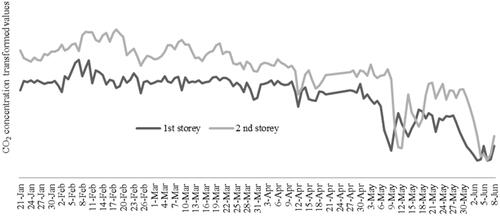
The CO2 concentrations at a hen house were higher on the 2nd storey compared to the 1st storey, and differences ranged between 0.02% and 5% during the investigation period (Figure ). CO2 concentration differences between storeys ranged between 0.6% and 4% in the winter months (January, February) and between 0.02% and 5% in spring months (March, April, May).
CO2 levels in the laying hen house tend to decrease over time and in spring months are lower compared to the wintertime. A significantly higher average CO2 level was in February than in the other months (p < .05). The differences between storeys in CO2 levels were significant in all presented months (p < .05) except May. NH3 levels in the laying hen house showed clear seasonal patterns. They were detected only during the wintertime in January and February, when the ventilation rate in the hen house was low due to the cold weather. The hen house is provided with an automatic ventilation system, and NH3 was not detected during springtime. NH3 concentrations in hen house were deficient in the investigation period and were within the sensor's undetected limit (0.25 ppm). Therefore, these values were excluded from the analysis. The data from the current study show that NH3 was less common on the first storey than on the second storey. NH3 gas is lighter than CO2 and air; NH3 will rise and not settle down.
Level of CO2 concentration depending on environmental conditions and number of hens
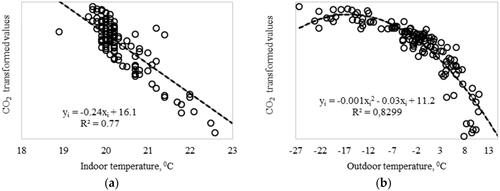
Relationships between indoor, outdoor temperature and CO2 concentration at the 2nd storey are shown in Figure . The negative linear relationship was found between indoor temperature and CO2 (rxy = −0.84, p < .05) and non-linear relationship between outdoor temperature and CO2 concentration. Higher ventilation rates at the farm are used in the warmer days; thereby the CO2 concentration is decreased with the increase in the temperature. It can be concluded from the calculations on the second storey that the higher CO2 concentrations were when the indoor temperature was low and ranging between 19 °C and 21 °C. Low relationship was found between 1st storey temperature and CO2 concentration and data not shown.
Figure 3. Relationship between indoor temperature and CO2 concentration at 2nd storey (a); outdoor temperature and CO2 concentration at 2nd storey.
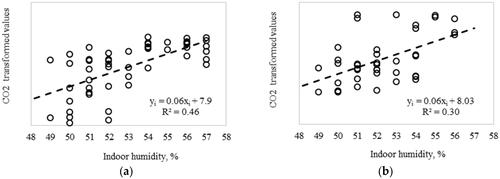
The indoor humidity tended to be negative correlated with indoor temperature (rxy = −0.59) and positive with CO2 concentration (Figure ). Numerically, the correlation coefficients between humidity and CO2 concentration were rxy = 0.68 and rxy = 0.54 for 1st storey and 2nd storey data, respectively.
Figure 4. Relationship between indoor humidity and CO2 concentration: (a) 1st storey; (b) 2nd storey.
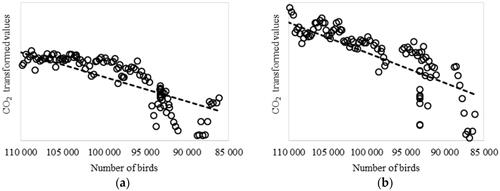
The relationship between stocking density and gases concentration were analysed. 58–77 weeks old hens were in the flock, and the hens during this age are with constant weight; thereby, the influence of the number of birds in the flock on gases concentration was analysed. In the monitoring period, there is a tendency that the CO2 concentrations are related to the number of birds in the flock and decreased over the winter – spring time (Figure ).
Figure 5. Relationship between the number of birds in laying hens' house and CO2 concentration: (a) 1st storey; (b) 2nd storey.
Hens performance and effect of the CO2 level on hens' performance
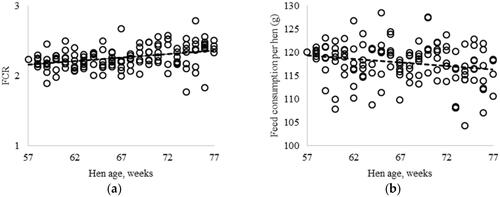
Lohmann Brown hens were 58–77-week-old, and hen-day egg production was slowly decreased, and egg weight was increased (Figure ). Hen-day egg production was in average higher than 80%. Average daily egg weight in January was in range from 63–65 g and in May 65–66 g, except on days when the average egg weight was 62 g and 64 g. Outlier values can be explained by the indoor temperature increasing. FCR ranged from 1.8 to 2.8 and was slightly lower during wintertime when hens consumed in average 118.4 g of feed per day (Figure ) and the hen egg production was higher.
Figure 6. Relationship between: (a) hen age (weeks) and hen-day egg production, %; (b) hen age (weeks) and egg weight (g).
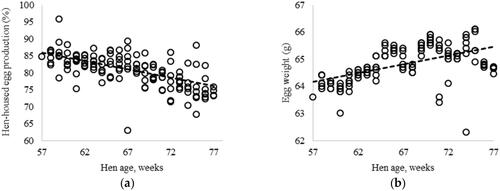
Figure 7. Relationship between: (a) hen age (weeks) and FCR; (b) hen age (weeks) and feed consumption per hen (g).
Hen productivity depended on hen age; thereby, the influence of the CO2 on the productivity was analysed during the investigation period. Correlation analysis results illustrated week relationships between CO2 concentration and hen productivity traits (hen-day egg production, egg weight and FCR) in investigation period (Table ).
Table 1. Correlation between hen productivity, hen age and environmental parameters.
During the investigation period, there was a moderate negative correlation between hen age and hen-day egg production and no statistically significant relationship between hen-day egg production and environmental factors (CO2 and indoor humidity). According to the results, the hen-day egg production and FCR were significantly influenced by hen age (p < .05) (Table ), and the influence of other factors, such as CO2 and indoor humidity, were not significant. It means the CO2 concentrations did not exceed the recommended level. Egg weight was influenced by hen age and environmental parameters (p < .05). This result may be because of low outdoor temperature in January and February, and low temperature increased hen feed intake, and it is caused in lower efficiency of feed and reducing in egg weight.
Discussion
The CO2 and NH3 gas concentrations were continuously monitored at the layer hen house – two-storey barn. The causes of emissions, namely, outdoor and indoor temperature, indoor relative humidity and number of hen in the flock were analysed.
CO2 and NH3 levels in the laying hen houses showed clear seasonal patterns and depended on environmental conditions because the barn is not heated. CO2 levels in the laying hen house in spring months were lover compared to the wintertime, and a significantly higher average CO2 level was in February compared to the other months (p < .05) when the ventilation rate in the building was low due to the cold weather. The current study data showed that the CO2 concentrations on the 1st storey were lower during winter when the outdoor temperatures were below 0 °C. Kilic and Yaslioglu (Citation2014), Zhao et al. (Citation2015) reported the ammonia and CO2 concentrations associated with ventilation efficiency and the rate at the farm. Kilic and Yaslioglu (Citation2014) found that the highest NH3 (10.58 ppm) and CO2 (904 ppm) concentrations for laying hen houses were recorded on June, when the average airflow rates was 14.5 m3·s−1·house−1. NH3 and CO2 associated with the ventilation rate and temperature. The lowest concentrations for NH3 (2.42 ppm) and CO2 (467 ppm) were measured in the morning. Zhao et al. (Citation2015) concluded that air pollution in laying hen farms in summer is lower due to the higher ventilation rate at the farm during this season. The CO2 concentration tended to be higher in the coldest days than the warmest days, and there is a relationship; thereby, the outdoor temperature increased than CO2 decreased. In Kocaman et al. (Citation2006), research presented a statistically significant difference between ammonia and CO2 levels in winter and spring months compared to the months in summer and autumn. The ammonia and CO2 concentrations were higher in the winter and spring months.
Our results show the indoor relative humidity tended to be negatively correlated with indoor temperature and positively correlated with CO2 concentration; the indoor temperature increased, then relative humidity and CO2 decreased. In Kocaman et al. (Citation2006), research was determined a negative relationship between temperature and CO2 (rxy = −0.45, p < .01), between temperature and NH3 (rxy = −0.43, p < .01), the temperature in poultry houses increased, and then CO2 and NH3 decreased. A positive relationship was found between relative humidity and CO2 (rxy = 0.35, p < .01), relative humidity and NH3 (rxy = 0.28, p < .05) and Zhao et al. (Citation2015) explained it by greater moisture content at the building with humid air.
NH3 levels in the house were detected only during the wintertime in January and February when the ventilation rate in the house was low due to the cold weather and was not detected during the springtime. NH3 concentrations were detected during the night-time because of regular – one time per day manure removal from the laying hen house. Poultry house cleaning frequency and house cleaning methods influence NH3 and CO2 levels. The effect of manure accumulation time on NH3 emission rate in the experimental study was evaluated by Chepete et al. (Citation2011) and Mendes et al. (Citation2012). The NH3 emission rate increased progressively with the manure accumulation time from one to five days (Chepete et al. Citation2011) and considerably for manure accumulation times higher than four days (Mendes et al. Citation2012). NH3 level at the farm can be improved using modern ventilation systems, but at the same time, NH3 gas emissions increase in the environment – near the farm (Naseem and King Citation2018).
In the hen house without heating birds are the main source of the CO2 and gas concentrations are positively correlated to the number of birds in the flock. Gases concentration increases with birds' weight and age (life cycle time) because poultry needs a high-protein diet. It is one of the reasons for the high level of NH3 and CO2 emissions in poultry houses.
Many authors mention the hen heat stress when the temperature during summertime rises and concentrations of CO2 and NH3 increase; heat stress affects hens' feed intake, feed efficiency and productivity (Kilic and Simsek Citation2013; Lara and Rostagno Citation2013; Wurtz et al. Citation2019). Li et al. (Citation2020) found that the low outdoor temperature, ammonia concentration, age of laying hens, and the interaction between the mentioned factors influence the laying hens' productivity, feed consumption and feed consumption efficiency and egg quality. In Kocaman et al. (Citation2006), research was determined a negative relationship between relative humidity, CO2, NH3 and hen-day egg production, CO2 and NH3 in poultry houses increased than egg production decreased. The CO2 and NH3 concentration increase also affected feed conversion ratio (FCR), which became worse – higher. During the research, the average temperature in laying hens' house was in the optimal range, with some extremes in the summer and the winter. According to the investigation results, if the temperature at the farm rises higher than 28 °C, the average feed consumption may decrease, and water intake may increase. If the temperature is in the optimal range (from +20 °C to +24 °C), the hen performance will increase. Laying hens have heat and cold stress, and stress can affect hens' performance. According to the results, the hen productivity traits were significantly influenced by hen age, indoor and outdoor temperature (p < .05), and other factors, such as CO2 and outdoor humidity, were not significant.
Conclusions
The study reports the results of the environmental conditions (temperature, humidity) and CO2 level at laying-hen commercial farm with two-storey barn housing system. Our results show that the temperature and CO2 level are higher on the 2nd storey and the farmers should pay more attention to environmental conditions on the 2nd storey during the hot weather. Environmental conditions and CO2 at farm are related to the outdoor temperature and CO2 level is higher during the winter time. Barn housed hens’ productivity has association with hen age and is influenced by environmental conditions at farm: high temperature reduces hen-day egg production and raises FCR. Hens at the farm are kept according to the recommendation of animal welfare standards and CO2 level doesn’t exceed recommended range, thereby, CO2 influence to the hen productivity was not significant.
Ethical approval
All applicable international, national and/or institutional guidelines for the care and use of animals were followed.
Acknowledgements
This research was funded by Specific Objective 1.1.1 "Improve research and innovation capacity and the ability of Latvian research institutions to attract external funding, by investing in human capital and infrastructure" 1.1.1.1. measure “Support for applied research” project No. 1.1.1.1/19/A/145 “HENCO2: Cloud based IT platform designed to improve poultry productivity and reduce greenhouse gas emissions".
Disclosure statement
The authors report no conflicts. The authors alone are responsible for the content and writing of this article.
Data availability statement
The data that support the findings of this study are available from Baltic laying hens’ farm. Restrictions apply to the availability of these data, which were used under licence for this study. Data are available from the authors with the permission of Baltic laying hens’ farm.
References
- Brouček J, Čermák B. 2015. Emission of harmful gases from poultry farms and possibilities of their reduction. Ekol Bratislava. 34 (1):89–100.
- Chepete JH, Xin H, Li H. 2011. Ammonia emissions of laying-hen Manure as affected by accumulation time. J Poult Sci. 48(2):133–138.
- Council Directive 1999/74/EC 1999. laying down minimum standarts for the protection of laying hens. Offic J L. 203:0053–0057.
- Dikmen S, Hansen PJ. 2009. Is the temperature-humidity index the best indicator of heat stress in lactating dairy cows in a subtropical environment? J Dairy Sci. 92(1):109–116.
- Kilic I, Simsek E. 2013. The effects of heat stress on egg production and quality of laying hens. J Anim Vet Adv. 12(1):42–47.
- Kilic I, Yaslioglu E. 2014. Ammonia and carbon dioxide concentrations in a layer house. Asian Austr J Anim Sci. 27(8):1211–1218.
- Kocaman B, Esenbuga N, Yildiz A, Lacin E. 2006. Effect of environmental conditions in poultry houses on the performance of laying hens. Int J Poult Sci. 5(1):26–30.
- Lara LJ, Rostagno MH. 2013. Impact of heat stress on poultry production. Animals. 3(2):356–369.
- Li D, Tong Q, Shi Z, Zheng W, Wang Y, Li B, Yan G. 2020. Effects of cold stress and ammonia concentration on productive performance and egg quality traits of laying hens. Animals. 10(12):2252.
- Lim TT, Heber AJ. Ji-Qin 2004. Air Quality Measurements at a Laying Hen House: Ammonia Concentrations and Emissions. Control. 686:1–9.
- Mendes LB, Xin H, Li H. 2012. Ammonia emissions of pullets and laying hens as affected by stocking density and manure accumulation time. Trans. ASABE. 55(3):1067–1075.
- Naseem S, King AJ. 2018. Ammonia production in poultry houses can affect health of humans, birds, and the environment-techniques for its reduction during poultry production. Environ Sci Pollut Res Int. 25(16):15269–15293.
- Rosario Díaz LÁ, Alavéz Ramírez R, Caballero Caballero M, Chiñas Castillo F, Montes Bernabé JL, Silva Rivera ME. 2018. Analysis of hygrothermal conditions for laying hens in the state of Oaxaca. Remexca. 21(21):4317–4327.
- Vučemilo M, Vinković B, Matković K, Štoković I, Jakšić S, Radović S, Granić K, Stubičan Đ. 2010. The influence of housing systems on the air quality and bacterial eggshell contamination of table eggs. Czech J Anim Sci. 55(6):243–249.
- Windhorst HW. 2017. Housing systems in laying hen husbandry – second part. Zootecnica International. [accessed 2022 January 13]:[5p.]. https://zootecnicainternational.com/poultry-facts/.
- Wurtz K, Camerlink I, D'Eath RB, Fernández AP, Norton T, Steibel J, Siegford J. 2019. Recording behaviour of indoor-housed farm animals automatically using machine vision technology: a systematic review. PLoS One. 14(12):e0226669.
- Yasmeen F, Mahmood S, Hassan M, Akhtar N, Yaseen M. 2008. Comparative productive performance and egg characteristics of pullets and spent layers. Pakistan Vet J. 28 (1):5–8.
- Zhao Y, Shepherd TA, Li H, Xin H. 2015. Environmental assessment of three egg production systems-Part I: Monitoring system and indoor air quality. Poult Sci. 94 (3):518–533.
- Zheng W, Xion Y, Gates RS, Wang Y, Koelkebeck KW. 2020. Air temperature, carbon dioxide, and ammonia assessment inside a commercial cage layer barn with manure-drying tunnels. Poult Sci. 99(8):3885–3896.