
 ?Mathematical formulae have been encoded as MathML and are displayed in this HTML version using MathJax in order to improve their display. Uncheck the box to turn MathJax off. This feature requires Javascript. Click on a formula to zoom.
Abstract
An experiment was conducted to evaluate the influence of dietary energy and nutrient density (END) on performance and egg quality in laying hens during the peak stage of the first laying cycle. A total of 360, 26-week-old Hy-Line W-36 laying hens were randomly allocated to a completely randomised design with five treatments, graded levels of dietary END (92–108%), with six replicates and 12 birds each. The diet with 100% END was formulated to meet the requirements recommended in the 2016 strain Management Guide. Experiment lasted for 12 weeks. Laying hens up to 33 weeks of age did not able to adjust feed intake (FI) with diet dilution. By increasing dietary END, hen-day egg production (EP), egg mass (EM), and feed conversion ratio (FCR) linearly improved. As birds got older, their FI capacity improved and birds regulated own FI with dietary END. The effect of dietary END was not significant on egg quality traits. During the 26–29 weeks of age, based on broken‐line regression models, the best balance of egg production performance traits and dietary END were found at 102, 104, and 105% for EW, EP & EM, and FCR, respectively. These values were estimated 5% lower for 30–33 week of age period. It is concluded, laying hens up to 33 weeks of age cannot adjust their FI with diet dilution, the gastrointestinal tract capacity is the main factor affects FI. Hence, a diet with higher energy and nutrients concentration require to achieve the desired production performance.
During the peaking period of laying cycle:
Feed consumption increase slowly.
Monitor feed consumption and adjust diet energy and nutrients level to actual feed intake.
Highlight
Introduction
Energy and nutrients requirement of laying hens will differ as a result of variation in egg production rate, egg size, and body weight. Considering that the feed cost represents more than 70% of the production cost, the formulation of the diet is on importance. As a result of this fact, it is becoming increasingly essential for producers to discover a balance between feeding their birds on a least-cost basis along with the correct concentration of dietary energy and nutrients (Alagawany and Mahrose Citation2014; Khatibi et al. Citation2021). The energy and nutrients consumption differ by increasing production age as a result of increasing feed intake ability (Abou-Kassem et al. Citation2019). Determine the economic intake of energy and nutrients will be important on a regular basis, taking into account not only the potential performance of the flock but also the relationship between the marginal cost of the ingredients and the marginal revenue for eggs. Hence, dietary energy and nutrients levels need periodic updating (Sakomura et al. Citation2015).
The nutritional management of laying hens during the peaking phase, first egg until production drops 2% below peak, has received tremendous interest in recent commercial egg-laying strain. When the laying hen is younger requires a diet with higher energy and nutrients concentration than later ages (dePersio et al. Citation2015). The greater comprehension of the effectuation of increasing dietary energy and nutrients density (END) will help egg producers to optimise early egg weight to enhance profits, especially whenever egg price determined as a result of egg size exists. Small egg size is usually an issue during the early stage of egg production. If egg weight may be improved quickly to cut back small and mid-sized eggs, egg producers will have a way to enhance profits based upon egg price, and egg size. Many studies demonstrate that increasing dietary energy or dietary fat significantly increases early egg weight (Bohnsack et al. Citation2002; Sohail et al. Citation2003; Wu et al. Citation2005; Citation2007). In this way, by optimisation dietary END may be improved profit (Leeson et al. Citation2001).
Furthermore, feed cost can significantly affect the earnings of poultry production. In many countries, vegetable oil that is used in high concentrate diets is relatively expensive, so dense diets are not economical (dePersio et al. Citation2015). Hence laying producers often are interested in feeding diluted diets. Today researchers often question the physical ability of modern laying hen to consume more feed when offered such low energy and nutrients density diets (Summers and Leeson Citation1993). This issue will undoubtedly be most acute for younger laying hens which their low inherent feed intake (Leeson et al. Citation2001). It has been reported current laying hens are not accurate in adjusting feed intakes with dietary energy and nutrients density (Morris Citation1968; Jalal et al. Citation2007; dePersio et al. Citation2015). Against the above reports, previous research has suggested that hens can regulate their feed intake to maintain energy consumption (Harms et al. Citation2000; Wu et al. Citation2005, Citation2007; Leeson and Summers Citation2009). In this manner, it's assumed that laying hens eat for their energy requirement, and thus birds will eat less of a high-energy diet and vice versa (Leeson et al. Citation2001). There is little research on the effect of increasing both dietary energy and nutrients on potential egg output, and egg quality. With regards to this background, the hypothesis of the present study was to judge the effect of increasing both dietary energy and nutrients on performance, egg composition, egg solids, egg quality, and profits of laying hens through the peak production phase of the first laying cycle (26–37 weeks of age).
Material and methods
The current study was done at the Poultry Research Station and the Animal Nutrition Laboratory, Ferdowsi University of Mashhad, Mashhad, Iran (Approval Number: 313/425/2016).
Feedstuffs analysis
Before to the experiment, the basal ingredients such as corn (data on as fed basis; DM, 88.01%; GE, 3939 kcal/kg; CP, 7.8%; EE, 4.1%; CF, 2.5%; ash, 1.2%), corn gluten (data on as fed basis; DM, 88.01%; GE, 3942 kcal/kg; CP, 64.6%; EE, 4.1%; CF, 2.5%; ash, 1.2%) and soybean meal (data on as fed basis; DM, 89.52%; GE, 4251 kcal/kg; CP, 46.86%; EE, 2.0%; CF, 2.5%; ash, 5.6%) were analysed for composition by the methods described (AOAC Citation2002) and corn (data on as fed basis; ME, 3330 kcal/kg; dig Lys, 0.22%; dig Met, 0.16%; dig TSAA, 0.33%; dig. Thr, 0.25%), corn gluten (data on as fed basis; ME, 3704 kcal/kg; dig Lys, 0.78%; dig Met, 1.44%; dig TSAA, 2.35%; dig. Thr, 1.76%), and soybean meal (data on as fed basis; ME, 2343 kcal/kg; dig Lys, 2.53%; dig Met, 0.56%; dig TSAA, 1.10%; dig Thr, 1.50%) were determined by Near-infrared spectroscopy (Amino NIR) through Evonik Co. (Evonik Nutrition & Care GmbH) agent in Tehran, Iran. These values were used for experimental diets formulation.
Housing, birds, and diets
A 12-week experiment was carried out with a total of 360, 26-wk-old Hy-Line W-36 laying hens. The birds were individually weighed and randomly assigned to five nutritional treatments in a completely randomised design with six replicates/treatment, and 12 birds/replicate. Pullets had been moved into the house at 18 weeks of age, four hens were housed in a cage “40 × 45 cm, 450 cm2/hen,” and fed a common ration from 18 to 25 weeks of age (mHy-Line Citation2016). Birds were reared in an environmentally controlled house with temperature maintained at approximately 18–22 °C and relative humidity was 40–50%. The initial lighting program was 12 h light and increased by 15 min/week until it reached to 16 h/day and remained constant at this point. Five experimental diets were formulated on a least-cost equation by user friendly feed formulation done again (UFFDA Citation1992) software (Table ). The control diet, 100% dietary energy and nutrients density (END), was formulated to meet energy and nutrients requirements as recommended by strain Management Guide (mHy-Line Citation2016) in the first phase of first laying cycle based 94 g/b daily feed intake. Other four diet were given 92, 96, 104, and 108% of that END. The dietary energy/protein (16.78 kcal/g) was maintained the same in different experimental diets. Similarly, ratios of dietary energy to amino acids, Ca, or available P were maintained constant. Diets were fed in mash form. All birds had free access to feed and water throughout the experimental period.
Table 1. Ingredients and nutrients composition of experimental diets.
Recording and calculate production performance
Birds were weighed at the initial and end of experiment. Egg production (number and weight) and mortality were recorded daily, egg weight was recorded weekly, feed intake and egg quality traits were recorded monthly. Feed intake was calculated by weighing the residual feed in feeders for the respective period. Feed consumption was adjusted for mortality. The absolute intake of energy, protein, Ca, available phosphorus, digestible amino acid was computed utilising the daily feed intake data, and the analysed diets ME and nutrients composition. The feed conversion ratio (FCR), adjusted for mortality and calculated as; total feed intake divided by total egg mass. Egg quality traits were measured using six eggs/replicate (36 eggs/treatment) produced during 3 consecutive days ended each month. Three eggs from each replicate were collected in the end of the experiment for measuring egg components, albumen solids, and yolk solids (Hossaninejad et al. Citation2021).
Economics traits were evaluated as the egg income minus over feed cost. Egg income was calculated by multiplying the average price of eggs during the experimental period by the total mass of eggs produced, which, the average price of a kg egg was $1.1 per kilogram. Feed cost was calculated by multiplying the ration price (based on the local price of feed ingredients in the diet) by the total amount of feed consumed during the experimental period (Khatibi et al. Citation2021). The feed costs per 1000 kg of diet for treatments 92% to 108% were $247.54, $266.36, $285.18, $304.00, and $322.81, respectively.
Egg quality traits
For evaluation egg quality traits, six eggs/replicate (36 eggs/treatment) from eggs laid throughout the three consecutive days by the end of every period (26–28 d) were randomly selected and transported to Egg Quality Laboratory in Ferdowsi University of Mashhad, Mashhad, Iran. On the sampled eggs, maximum width and length were measured by passing the eggs through the digital Calliper (0.05 mm, Model 1116–150, Insize Co. Ltd., Suzhou, China) to obtain the maximum points and then calculating the egg shape index by the following formula (Hossaninejad et al. Citation2021):
After weighing individual eggs with a digital electronic scale (0.001 g, Model GF 400, A&D Weighing Co. Ltd., CA.), the egg components, including yolk and albumen, were separated with a commercially hand-held egg separator. A moist cloth napkin was used to get rid of the adhering of albumen residues from the yolk, and then it absolutely was weighed. The eggshells were washed by water, dried for 48 h, and weighed (Hossaninejad et al. Citation2021). Eggshell thickness was measured employing a micrometre apparatus (0.001-mm, Model 293-240, Mitutoyo Co, Ltd., Kanagawa, Japan) at three disparate sites; top, middle, and bottom, averaged to calculate overall eggshell thickness. The albumen weight was calculated by subtracting yolk + shell weights from the whole egg weight. Haugh unit was calculated on the basis of the following formula, within just six hours h following the egg collection (Khatibi et al. Citation2021):
By the end of the experiment, five eggs from each replicate were used to analyse egg composition. The eggs components, including yolk and albumen, were separated as explained. Five yolks and five whites were pooled in separate containers and homogenised to make composite samples. Yolk was homogenised using a spatula, and white were homogenised in a Waring blender for 15 s. The homogenised samples were transferred to 20-mL sample vials and used for chemical analysis. Moisture, ether extract and nitrogen content was analysed by using the AOAC method (AOAC Citation2002). Three to four grams of sample were transferred to an aluminium dish and reweighed after drying in an electric oven at 75 °C for 72 h. Lipid content of egg yolk was determined by the extraction method. Nitrogen content of yolk was analysed by using a Nitrogen analyser. A factor of 6.25 was used to calculate protein content from the nitrogen values.
Blood collection and analysis
By the end of the experiment, one hen from each replicate (six/treatment) was randomly selected, and the blood sample was obtained from the brachial vein of every bird into non-heparinized tubes. After permitting the completion of clotting, blood samples were centrifuged at 1,900 g for 5 min at 4 °C to extract serum (Hossaninejad et al. Citation2021). Serum samples were separated and analysed, with kits from Pars Azmoon Company, Iran using a multi-test automatic random-access system auto-analyser (Cobas Bio, Roche Basel, Switzerland).
Statistical analysis
All data were analysed for normality using SAS 9.1 software through the Univariate plot normal procedure. Then, data were analysed by using the General Linear Model procedure of SAS 9.1 with dietary treatments as independent variables. Means were compared by the Tukey test when effects of dietary treatments were significant at 5% (Tukey Citation1991). Orthogonal polynomials for linear and quadratic responses to diet nutrients density were calculated to explore the relationships between dietary nutrients level as independent variables and the respective traits as dependent variables. The dietary energy and nutrients level for maximum response in performance variables, that’s R2 was significant, were predicted using the linear broken-line regression models, using the nonlinear modelling option in SAS, with the dietary nutrient’s density as the independent variable (Robbins et al. Citation2006). The iterative procedure makes repeated estimates for coefficients and minimises residual error before the best-fit line is achieved. To assist in choosing a suitable model, coefficient of determination (R2), adjusted R2 (adj. R2), root means square error (RMSE), and Akaike's information criterion (AIC) values were calculated suing the following formulas (Hossaninejad et al. Citation2021):
where: Y = dependent variable, L = theoretical maximum, R = requirement, X = independent variable, I = 1 (if X < R) or I = 0 (if X > R), U = rate constant, yt = observed values, ŷt = predicted values, N = number of observations, P = k + 1, and k is the number of parameters.
Result
Feed intake and absolute intakes of energy and nutrients
Mean values of daily feed intake (FI), and absolute intake of energy, protein, calcium, available phosphorus, digestible amino acids and their regression analysis values on dietary END was reported in Table . Laying hens up to 33 weeks of age were not successful to adjust feed intake with dietary END. The average daily FI during 26–29 and 30–33 weeks of age periods were nearly same between birds fed diet with different END. Thereupon, by increasing dietary END significantly and linearly (p < .001) increased bird’s daily energy and nutrients intake. During the 34–37 weeks of age as decreased dietary END, daily FI linearly increased (p < .001). Daily energy and nutrients intake were similar in birds fed by different dietary treatments.
Table 2. Calculated daily absolute intakes of energy and selected nutrients in the laying hens during the peak production phase of the first laying cyclea.
Egg production traits and profit
The effect of different treatments on egg production performance indices are shown in Table . There clearly was a substantial positive reaction to increasing dietary END on hen-day egg production (EP), egg weight (EW), egg mass (EM), and feed conversion ratio (FCR) during any particular 26–29- and 30–33-weeks period of age (linear effect, p < .01). The outcomes showed, birds fed diet containing 104% END as strain recommendation performed the beast EP and FCR. The egg production performance wasn't affected (p > .05) by dietary END throughout the 34–37 weeks old period except FCR (linear effect, p < .01). Significant linear responses as a result of increasing dietary END is observed for economic performance. Egg income minus feed cost linearly effect (P < .001), by increasing diet END for either during 26–29- or 30–33-weeks periods.
Table 3. Effect of dietary energy and nutrients density on egg production performance of laying hens during the peak production phase of the first laying cyclea.
Live body weight
Data for live body weight are presented in Table . Dietary END linearly effect (p < .05) live weight by the end and weight difference between the original and end of the experimental period. The average live weight at 37 weeks old was increased by increasing dietary END. The average live weight was highest in the birds fed the diet with 108% nutrients density as strain recommendation, and it had been absolutely 128 g greater than the birds fed diet with 92% nutrients density as strain recommendation (1802 g vs. 1673 g LBW).
Table 4. Effect of dietary energy and nutrients density on live body weight of laying hens during the peak production phase of the first laying cyclea.
Egg components and quality
Effect of different treatments on egg quality traits is given in Tables and . As dietary END increased, yolk and albumen absolute weight linearly increased (p < .05). Albumen solid percentage affected (p < .013) with a quadratic trend as dietary energy and nutrients density increased. The other egg quality traits such as hugh unit, shape index, shell special gravity, shell thickness, shell relative weight, and egg composition showed non-significant response (p > .05) to increasing dietary END.
Table 5. Effect of dietary energy and nutrients density on egg quality of laying hens during the peak production phase of the first laying cyclea.
Table 6. Effect of dietary energy and nutrients density on egg composition of laying hens during the peak production phase of the first laying cycle determined at the end of the experimenta.
Blood metabolites
The results for blood metabolites responses are shown in Table . Dietary END did not have a significant effect on blood metabolites such as triglyceride (TG), cholesterol (Chol), high-density lipoprotein cholesterol (HDL-C), low-density lipoprotein cholesterol (LDL-C), uric acid (UA), total protein (TP), creatinine (Cr) and albumin (Alb) in blood plasma of laying hens determined at the end of the experiment (Table ).
Table 7. Effect of dietary energy and nutrients density on blood metabolites of laying hens during the peak production phase of the first laying cycle determined at the end of the experimenta.
Estimated energy and nutrients requirement
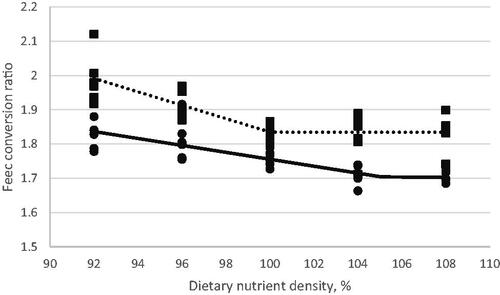
In order to investigate the effect of dietary END on egg performance, egg quality, and economic benefit traits in laying hens during the peak production phase of the first laying cycle, a crucial goal with this study was to estimate energy and nutrients requirement of Hy-Line W-36 laying hens. The optimisation model was solved using the NLIN program SAS 9.1 procedure. Fitted broken-line models for the egg performance traits during 26–29 and 30–33 weeks of age periods as a function of daily energy and nutrients consumption are shown in Figures . The best balance of performance traits and dietary END found were feeding at 102, 104, and 105% of dietary END recommendation during the 26–29 weeks of age for EW, EP&EM, and FCR, respectively. This values for EP, EM and FCR were obtained 98.5, 99.3 and 100% during later age (30–33 weeks of age).
Figure 1. Fitted broken-line plot of hen-day egg production of Hy-line-W36 laying hens during the peak production phase of the first laying cycle as a function of diet nutrients density (% of strain recommendation). (—●) Liner broken-line fitted model for 26–29 weeks of age period, Y = 95.46–0.167(104-X) × I, I = 1 (if X < 104) or I = 0 (if X > 104), p < .015, R2 = 0.26, the break point occurred at 104 ± 4.63. (…■) Liner broken-line fitted plot for 30–33 weeks of age period; Y = 90.13–0.2 (98.5-X) × I, I = 1 (if X < 98.5) or I = 0 (if X > 98.5), p < .034, R2 = 0.22, the break point occurred at 98.5 ± 3.81.
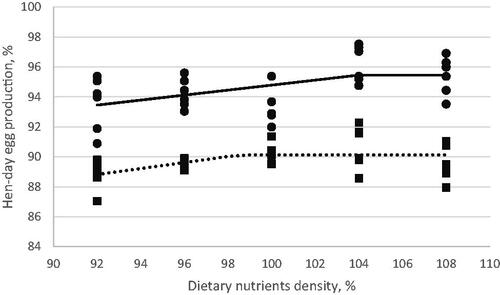
Figure 2. Fitted broken-line plot of average egg weight of Hy-line-W36 laying hens during the peak production phase of the first laying cycle as a function of diet nutrients density (% of strain recommendation). Liner broken-line fitted model for 26–29 weeks of age period; Y = 60.12–0.13 (102-X) × I, I = 1 (if X < 102) or I = 0 (if X > 102), p < .008, R2 = 0.30, the break point occurred at 102 ± 3.75.
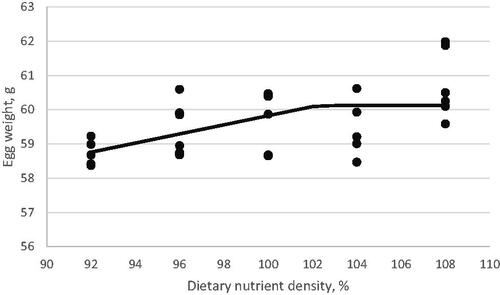
Figure 3. Fitted broken-line plot of egg mass of Hy-line-W36 laying hens during the peak production phase of the first laying cycle as a function of diet nutrients density (% of strain recommendation). (—●) Liner broken-line fitted plot for 26–29 weeks of age period; Y = 57.93–0.24 (104.4-X) × I, I = 1 (if X < 104.4) or I = 0 (if X > 104.4), p < .015, R2 = 0.62, the break point occurred at 104.4 ± 4.63. (…■) Liner broken-line fitted plot for 30–33 weeks of age period; Y = 54.85–0.27 (99.4-X) × I, I = 1 (if X < 99.4) or I = 0 (if X > 99.4), p < .001, R2 = 0.42, the break point occurred at 99.4 ± 3.81.
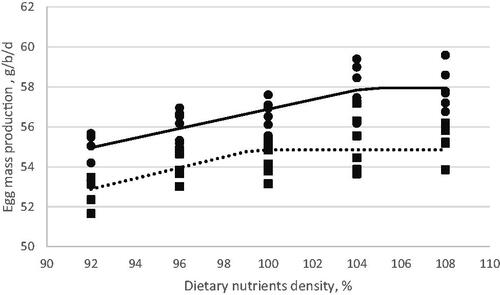
Figure 4. Fitted broken-line plot of feed conversion ratio of Hy-line-W36 laying hens during the peak production phase of the first laying cycle as a function of diet nutrients density (% of strain recommendation). (—●) Liner broken-line fitted plot for 26–29 weeks of age period; Y = 1.703 + 0.01 (105-X) × I, I = 1 (if X < 105) or I = 0 (if X > 105), p < .001, R2 = 0.73, the break point occurred at 105.2 ± 1.87. (…■) Liner broken-line fitted plot for 30–33 weeks of age period; Y = 1.8345–0.0196 (100-X) × I, I = 1 (if X < 100) or I = 0 (if X > 100), p < .001, R2 = 0.60, the break point occurred at 100 ± 1.3.
The summary of ME and nutrients (CP, available Phosphorus, dig Lys, dig SAAs, and dig Thr) requirements for the optimisation of EP, EW, EM, and FCR estimated by linear broken-line fit models are shown in Table . The present data suggest that the Hy-Line W-36 laying hens energy requirement to optimise production performance were 273–282 and 269–273 kcal/bird d−1 during the 26–29 and 30–33 weeks of age, respectively. Corresponding values for crude protein were 16.23–16.74 and 16.00–16.24 g/bird d−1. Also available phosphorus, digestible lysine, digestible sulphur amino acids, and digestible threonine requirement estimated for optimised egg production performance during 26–29 weeks of age were 474–502, 820–846, 686–708, and 581–600 mg/bird d−1, respectively. Corresponding values for 30–33 weeks of age period obtained 480–487, 809–821, 677–687, and 574–582 mg/bird daily, respectively (Table ).
Table 8. Estimated metabolisable energy and nutrients requirements of laying hens during the peak production phase of the first laying cycle by the linear broken-line fit model.
Discussion
Feed intake and absolute intakes of energy and nutrients
The result obtained from the current study approved that Hy-Line W-36 laying hens up to 33 weeks of age, eat to almost full-out gastrointestinal tract capacity. In agreement with this result, reported that current strains of laying hens, like the Hy-Line W-36, have a small capability of gastrointestinal tract to boost their feed intake to make sure adequate energy and nutrients intake when fed by diluted diet (dePersio et al. Citation2015). Since feed express the significant cost of production (Almeida et al. Citation2019), poultry producers often interested in feeding diets with low nutrients level to reduce feed cost (Khatibi et al. Citation2021), while it may not appear to supply sufficient energy and nutrients if birds could not adjust feed intake with diet dilution (dePersio et al. Citation2015). In this situations, it may unable to supply sufficient bird's requirement, as regards layers still continue to increase body weight and egg size (mHy-Line Citation2016), therefore poor nutrition in this period can cause deteriorate egg production performance and loss of bird's health. It is critical to adjust the diet nutrient density to the actual feed intake of the bird to ensure sufficient consumption of nutrients (Leeson and Summers Citation2009). Modern laying strains will presently have a small appetite and cannot accurately alter feed intakes according to dietary nutrients density (Jalal et al. Citation2007; dePersio et al. Citation2015). The genetic potential of highly efficient birds, such as the Hy-Line W-36, may be compromised by a diet designed for a bird that can eat more (mHy-Line Citation2016). Therefore, a higher density diet is required for a more efficient bird to achieve production potential. In the current experiment, throughout the 34–37 weeks old, dietary END had a significant influence on feed intake. As expected, as the energy and nutrient density of the feed declined, the birds ate more feed. With increasing dietary END, hens adjusted daily feed intake from 120.97 to 105.69 g/hen to reach similar energy intakes, 320–328 kcal/hen daily, so the similar quantities of dietary energy 5.9 kcal were used to produce 1 g of eggs. In agreement with this, be a consequence of some investigators (Morris Citation1968; CHERRY et al. Citation1983; Harms et al. Citation2000; Leeson et al. Citation2001; Wu et al. Citation2005; Citation2007; Rama Rao et al. Citation2014) have shown that laying hens would linearly adjust their feed intake in response to nutrients concentration increases or decreases. Harms et al. (Citation2000) reported, Hy-Line W-36 hens responded by eating significantly more of diet that was low in energy and less of diet that was high in energy. Leeson et al. (Citation2001) reported for the Shaver White laying hens fed diluted diet, adjustment to feed intake was doing gradually until 43 weeks of age. Since the capacity of the digestive system increases with age, the feed intake pattern in laying hens would influenced by the age (Choi et al. Citation2004).
Egg production traits and profit
Current study result revealed, during the 26–29 and 30–33 weeks of age as the dietary END increased, EP, EW, EM and FCR linearly improved, but production profits (income minus feed cost) decreased (Table ). The greater comprehension of the affectation of increasing both dietary energy and other nutrients (amino acids, Ca, an d available P) will help egg producers to optimise early egg weight to boost profits, especially whenever a large egg price spread as a result of egg size exists (Wu et al. Citation2007). In agreement with the current experiment, many studies have shown that increasing dietary energy (Sohail et al. Citation2003; Wu et al. Citation2005), and limited essential amino acid such as; total sulphur amino acid (Akbari et al. Citation2016b), Lysine (Akbari et al. Citation2016a) and Threonine (Huyghebaert and Butler Citation1991; Hossaninejad et al. Citation2021) significantly increases egg weight. Small egg size is usually a challenge in young hens during onset peak production. If egg weight may be improved quickly to reduce small and medium-sized eggs, poultry producers will have the ability to enhance profits, dependant on egg size prices (Wu et al. Citation2007). As dietary energy and nutrients density increased, egg mass linearly increased. The increased egg mass was mainly contributed from the increased egg weight. In support of the present findings, Leeson et al. (Citation2001) saw a trend in increased egg mass and feed efficiency when diet nutrients density was increased. Increasing both dietary energy and amino acids may avoid the interfering effect of decreased nutrients (protein or amino acids) intake. Researcher reported, increasing only dietary energy has no significant effect on egg mass (Harms et al. Citation2000; Wu et al. Citation2005). Increasing both dietary energy and nutrients (amino acids, Ca, and available P) may have a significant effect on egg mass because of similar nutrients (protein or amino acids) intakes. The current experiment demonstrate by increasing dietary energy and nutrient density linearly improved FCR. According with current experiment result, reported increasing both dietary energy and other nutrients (amino acids, Ca, and available P) resulted to improve feed conversion ratio (Wu et al. Citation2005; Citation2007).
Our result in this experiment showed, egg production profit (egg income minus feed cost), significant and linearly decreased by increasing diet energy and nutrients levels. These results indicate that, although hens fed higher-energy and nutrients diets had improved feed efficiency and produced more eggs of larger sizes, the income from these didn't offset the more costs of these kind of diets. The genetic potential of highly efficient birds, like the Hy-Line W-36, might be compromised with a diet made for a bird that eats more. An increased in dietary energy and nutrients density is necessary for a more efficient bird to accomplish the egg numbers and egg weights that she is capable of producing. Although an increased in diet energy and nutrients density might cost more to formulate, the expense is justified by lower feed intake and higher egg output (dePersio et al. Citation2015). Because feed ingredient prices and egg price often vary, there may be no fixed ideal nutrients density for optimal profits (Gunawardana et al. Citation2008). Low nutrient density diets may be considered economical in certain regions depending on the relative value of available ingredients. However, there is doubt concerning the ability of modern laying hens’ strains to eat enough feed when offered such diets. Therefore, poultry producers might need to apply some economic feeding and management software to ascertain the diets for optimal profits. During the 34–37 weeks old, increasing dietary END had no effect on EP and EM, but EW and FCR linearly improved. Phase feeding is performed to supply proper nutrients at different egg production stages of the laying hen. The concept of phase feeding is based on the fact that as birds get older, their feed intake ability will increase (Khatibi et al. Citation2021). Overlay, laying hens should be provided sufficient nutrients by adjusting the diet density with feed intake in order to meet their requirements and to allow them to reach their genetic potential (Leeson and Summers Citation2009).
Live body weight
Live body weight of hens increased significantly by having an increase in dietary END (Table ). Although, this increasing confirmed for the birds which fed diet with nutrients density higher of control diet. In agreement with obtained results in this experiment increased energy and nutrients intake is associated with obesity (Leeson et al. Citation2001; Wu et al. Citation2007). In the present study, live body weight was also greatly affected by energy and nutrients density, with hens fed a higher-density diet being heavier (P < .07). In agreement with our result and above investigation reported that increasing Lys intake significantly increased hen weight gain (Novak et al. Citation2004).
Egg components and quality
The results obtained from current experiment indicate that increasing dietary energy and nutrients (amino acids, Ca, and available P) concentration significantly increases yolk and albumen weight (Table ), this causes a significant increase in egg weight (Table ). Similar to the results obtained of this experiment, reported increasing dietary nutrient concentration caused a linear increase in albumen and yolk weight. In the early stages of the laying cycle, young hens usually need higher nutrients concentration due to low feed intake, if hens don’t increase their feed intake in order to consume enough of the nutrients adjust with their requirement, egg production can suffer (Abou-Kassem et al. Citation2019). Additionally, increasing dietary energy improves protein utilisation through metabolic processes (Reginatto et al. Citation2000). Increasing dietary END had no significant effect on Haugh unit, shape index and shell quality traits such as shell thickness and relative shell weight and percentage of shell (Table ). Similarly the percentage of whole and yolk solids, ether extract and crude protein and albumen crude protein percentage (Table ) were not affected. There was a quadratic response of percentage of albumen solids to the increased dietary END. The result obtained from current experiment is in agreement with other reports (Novak et al. Citation2004; Wu et al. Citation2007; Khatibi et al. Citation2021). By increasing dietary nutrients concentration, a greater proportion n of nutrients will be utilised, the elevation of amino acid concentrations in plasma causes an increase in insulin secretion by the pancreas. Two functions of insulin are elevation in amino acid uptake and protein synthesis (Prochaska et al. Citation1996; Akbari et al. Citation2016b, Citation2016a; Khatibi et al. Citation2021). Novak et al. (Citation2004) reported that increasing Lys intake increased the percentage of albumen solids.
Blood metabolites
None of the triglyceride, whole cholesterol, high-density lipoprotein cholesterol, low-density lipoprotein cholesterol, uric acid, creatinine, total protein, or albumin in blood serum was significantly affected by dietary END (Table ). All haematological traits recorded in this study were within the recommended range for normal and healthy chickens (Olorede et al. Citation1996). Similar to the results obtained of this experiment, observed no significant effects on blood metabolites with an increase in dietary protein and lysine (Chi and Speers Citation1976), lysine (Akbari et al. Citation2016a), sulphur amino acid (Akbari et al. Citation2016b) supplementation. These results are in agreement with reported on investigated quantitative feed restriction on broilers blood metabolites (Jahanpour et al. Citation2015). However, contravenes with the report that haematological traits were affected in birds on high energy and low protein diet (Dairo et al. Citation2010). There is a lack of information on the effect of dietary nutrients density on blood metabolites in layer hens.
Estimated energy and nutrients requirement
The current experiment results indicate Hy-Line W-36 laying hens under 33 weeks old have a somewhat limited gastrointestinal tract capacity for increasing its feed intake in accordance with diet dilution. Insufficient amino acid intake is the principal reason behind productivity loss before 29 weeks of age. Therefore, it is essential to rebalance the dietary plan for other critical nutrients, particularly limited amino acids, and phosphorous in line with the birds' productivity demand and the observed feed intake. In agreement with this result, the scientific literature has demonstrated the beneficial effect of diets with a greater energy density and adjustments in the nutrients on production performance in laying hens (Jalal et al. Citation2007; dePersio et al. Citation2015; Khatibi et al. Citation2021). The modern commercial laying hens have been genetically improved for decreased body weight and increasing feed efficiency (dePersio et al. Citation2015). Thus, it is better to meet the nutrients requirement of birds to produce high performance and egg production (Fouad and El-Senousey Citation2014). The current experiment showed, if nutrients density is to be reduced, this should not occur immediately after peak egg numbers. The two reasons for reducing the level of dietary protein and amino acids during the latter stages of egg production are first, to reduce feed costs and second, to reduce egg size. The advantages of the first point are readily apparent if protein costs are high, but the advantages of the second point are not so easily defined and will vary depending upon the egg pricing. When a producer is being paid a premium for extra-large and jumbo eggs, there is no advantage to using a phase feeding program unless eggshell quality is a problem.
Conclusion
Our result in this experiment shown: Egg quality and blood metabolites of Hy-line W-36 laying hens in the peak stage of first production cycle were not affected by different dietary energy and nutrients levels. During the 26–29 weeks of age, the best balance of performance traits and dietary energy and nutrient concentration were found at 102, 104, and 105% of requirements recommended in the strain management guide for EW, EP and EM, and FCR, respectively (mHy-Line Citation2016). These values were estimated to be 3–5% lower for the 33–30 week of age. In the Hy-Line W-36 commercial laying hens up to 33 weeks of age, the gastrointestinal tract capacity is the main factor that affects feed intake. They cannot adjust their feed intakes with diet dilution. Hence, the diet with higher energy and nutrients concentration is required than the later age to achieve the desired egg production performance goals. Low nutrient density diets may be considered economical in certain regions depending on the relative value of available ingredients. However, there is doubt concerning the ability of modern laying hens’ strains to eat enough feed when offered such diets.
Ethical approval
The experiment was conducted with the approval of the Animal Care Committee of the Ferdowsi University of Mashhad, Mashhad, Iran.
Acknowledgement
We greatly appreciate our colleagues from the Poultry Research Station and Animal Nutrition Laboratory for their valuable help, critiques, and suggestions and the Iran branch of Evonik Co. for the feedstuff’s amino acid analysis.
Disclosure statement
No potential conflict of interest was reported by the authors.
Additional information
Funding
References
- Abou-Kassem D, Ashour E, Alagawany M, Mahrose K, Rehman Z, Ding C. 2019. Effect of feed form and dietary protein level on growth performance and carcass characteristics of growing geese. Poult Sci. 98(2):761–770.
- Akbari R, Golian A, Zarghi H. 2016a. Effect of dietary digestible lysine concentration on performance, egg quality, and blood metabolites in laying hens. J Appl Poultry Res. 25(4):506–517.
- Akbari R, Golian A, Zarghi H. 2016b. Effect of digestible methionine + cystine concentration on performance, egg quality and blood metabolites in laying hens. Br Pult Sci. 57(3):403–414.
- Alagawany M, Mahrose KM. 2014. Influence of different levels of certain essential amino acids on the performance, egg quality criteria and economics of Lohmann brown laying hens. Asian J Poultry Sci. 8(4):82–96.
- Almeida T, Silva A, Saccomani A, Mu ∼ noz J, Silva R, Franca N, Faria D, Faria F. 2019. Performance and egg quality of commercial laying hens fed diets formulated using non-linear programming. Braz J Poutl Sci. 21(3):1–10.
- AOAC 2002. Official methods of analysis. 15 ed. Washington, DC, USA: Association of Official Analytical Chemists.
- Bohnsack C, Harms R, Merkel W, Russell G. 2002. Performance of commercial layers when fed diets with four levels of corn oil or poultry fat. J Appl Poultry Res. 11(1):68–76.
- CHERRY JA, JONES DE, CALABOTTA DF, ZELENKA DJ. 1983. Feed intake response of mature White Leghorn chickens to change in feed density. Poult Sci. 62(9):1846–1849.
- Chi M, Speers G. 1976. Effects of dietary protein and lysine levels on plasma amino acids, nitrogen retention and egg production in laying hens. J Nutr. 106(8):1192–1201.
- Choi J, Namkung H, Paik I. 2004. Feed consumption pattern of laying hens in relation to time of oviposition. Asian Australas J Anim Sci. 17(3):371–373.
- Dairo F, Adesehinwa A, Oluwasola T, Oluyemi J. 2010. High and low dietary energy and protein levels for broiler chickens. Afr J Agric Res. 5(15):2030–2038.
- dePersio S, Utterback P, Utterback C, Rochell S, O'Sullivan N, Bregendahl K, Arango J, Parsons C, Koelkebeck K. 2015. Effects of feeding diets varying in energy and nutrient density to Hy-Line W-36 laying hens on production performance and economics. Poult Sci. 94(2):195–206.
- Fouad A, El-Senousey H. 2014. Nutritional factors affecting abdominal fat deposition in poultry: a review. Asian-Australas J Anim Sci. 27(7):1057–1068.
- Gunawardana P, Roland D, Sr, Bryant M. 2008. Effect of energy and protein on performance, egg components, egg solids, egg quality, and profits in molted Hy-Line W-36 hens. J Appl Poultry Res. 17(4):432–439.
- Harms R, Russell G, Sloan D. 2000. Performance of four strains of commercial layers with major changes in dietary energy. J Appl Poultry Res. 9(4):535–541.
- Hossaninejad S, Zarghi H, Golian A. 2021. Effect of digestible threonine on performance, egg quality, blood metabolites, and immune responses in laying hens fed a wheat-based diet in the second cycle. Ital J Anim Sci. 20(1):2134–2146.
- Huyghebaert G, Butler E. 1991. Optimum threonine requirement of laying hens. Br Poult Sci. 32(3):575–582.
- Jahanpour H, Seidavi A, Qotbi A, Van Den Hoven R, Rocha e Silva S, Laudadio V, Tufarelli V. 2015. Effects of the level and duration of feeding restriction on carcass components of broilers. Arch Anim Breed. 58(1):99–105.
- Jalal M, Scheideler S, Pierson E. 2007. Strain response of laying hens to varying dietary energy levels with and without Avizyme supplementation. J Appl Poultry Res. 16(3):289–295.
- Khatibi S, Zarghi H, Golian A. 2021. Effect of diet nutrients density on performance and egg quality of laying hens during the postpeak production phase of the first laying cycle under subtropical climate. Ital J Anim Sci. 20(1):559–570.
- Leeson S, Summers J. 2005. Commercial poultry nutrition. 3rd ed. Nottingham University Press, Guelph, Ontario, Canada.
- Leeson S, Summers J, Caston L. 2001. Response of layers to low nutrient density diets. J Appl Poultry Res. 10(1):46–52.
- mHy-Line 2016. Hy-line variety W-36 commercial management guide 2016. West Des Moines (IA): Hy-Line International.
- Morris T. 1968. The effect of dietary energy level on the voluntary calorie intake of laying birds. Br Pult Sci. 9(3):285–295.
- Novak C, Yakout H, Scheideler S. 2004. The combined effects of dietary lysine and total sulfur amino acid level on egg production parameters and egg components in Dekalb Delta laying hens. Poult Sci. 83(6):977–984.
- Olorede B, Onifade A, Okpara A, Babatunde G. 1996. Growth, nutrient retention, haematology and serum chemistry of broiler chickens fed sheabutter cake or palm kernel cake in the humid tropics. J Appl Anim Res. 10(2):173–180.
- Prochaska J, Carey J, Shafer D. 1996. The effect of L-lysine intake on egg component yield and composition in laying hens. Poult Sci. 75(10):1268–1277.
- Rama Rao S, Ravindran V, Raju M, Srilatha T, Panda A. 2014. Effect of different concentrations of metabolisable energy and protein on performance of white leghorn layers in a tropical climate. Br Poult Sci. 55(4):532–539.
- Reginatto M, Ribeiro A, Penz A Jr, Kessler A, Krabbe E. 2000. Effect of energy, energy: protein ratio and growing phase on the performance and carcass composition of broilers. Rev Bras Cienc Avic. 2(3):229–237.
- Robbins K, Saxton A, Southern L. 2006. Estimation of nutrient requirements using broken-line regression analysis. J Anim Sci. 84:155–165.
- Sakomura N, Gous R, Kyriazakis I, Hauschild L. 2015. Nutritional modelling for pigs and poultry. Nosworthy Way, Wallingford, Oxfordshire, OX10 8DE, UK: CABI.
- Sohail S, Bryant M, Roland SD. 2003. Influence of dietary fat on economic returns of commercial leghorns. J Appl Poultry Res. 12(3):356–361.
- Summers J, Leeson S. 1993. Influence of diets varying in nutrient density on the development and reproductive performance of white leghorn pullets. Poult Sci. 72(8):1500–1509.
- Tukey J. 1991. The philosophy of multiple comparisons. Stat Sci. 6:100–116.
- UFFDA 1992. User-friendly feed formulation done again. Athens, GA, United States: University of Georgia.
- Wu G, Bryant MM, Gunawardana P, Roland DA. 2007. Effect of nutrient density on performance, egg components, egg solids, egg quality, and profits in eight commercial leghorn strains during phase one. Poult Sci. 86(4):691–697.
- Wu G, Bryant MM, Voitle RA, Roland DA. 2005. Effect of dietary energy on performance and egg composition of Bovans White and Dekalb White hens during phase I. Poult Sci. 84(10):1610–1615.