
 ?Mathematical formulae have been encoded as MathML and are displayed in this HTML version using MathJax in order to improve their display. Uncheck the box to turn MathJax off. This feature requires Javascript. Click on a formula to zoom.
Abstract
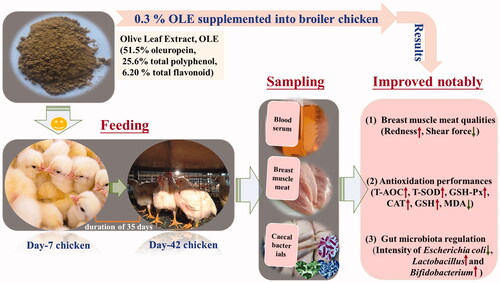
This study aims to evaluate the effect of olive leaf extract (OLE) on growth performance, breast meat quality, antioxidant capacity and caecal microbiota regulation. OLE containing 51.5% oleuropein, 25.6% polyphenols and 6.2% flavonoids, was designed to different supplement levels ranging from 0.1% OLE (OLE0.1) to 0.5% OLE (OLE0.5) into a basal diet, separately. The whole feeding period lasts for 35 days after 7-day hatching from the egg. 720 1-day-age healthy Arbour Acres male broilers were thus divided into five experimental groups and one control group, consist of 20 broilers per group for six parallel experiments in triplicate. The results showed that the levels of average daily feed intake (ADFI) and average daily weight gain (ADG) of the broilers were decreased (p < 0.05) after the addition of 0.3% OLE. Moreover, the breast meat shear force was decreased by 34.4% (p < 0.05). The glutathione (GSH) levels in the meat were increased by 76.64% (p < 0.05); the levels of total superoxide dismutase (T-SOD) and glutathione peroxidase (GSH-Px) were increased by 50.4% and 120%, respectively. And the malondialdehyde (MDA) levels in the meat were reduced by 34.2% (p < 0.05). Additionally, a decreased intensity of Escherichia coli (p < 0.05) and an increased intensity of Lactobacillus and Bifidobacterium (p < 0.05) were observed. Overall, supplementing 0.3% OLE into daily diet enables enhancing breast meat antioxidation, amplifying the abundance of Lactobacillus and Bifidobacterium as well as diminishing the abundance of E. coli in the caecum.
OLE contains 51.5% oleuropein, 25.6% of TP and 6.2% TF levels.
OLE addition at 0.3% lowers shear force and raises the GSH’s level of the meat.
OLE causes a decrease in E. coli and an increase in Lactobacillus and Bifidobacterium.
HIGHLIGHTS
Graphical Abstract
Introduction
In 2021, 135 million tons of chicken meat were produced worldwide, which reached approximately 40.4% of the total production of livestock and poultry meat (Shahbandeh Citation2022). Oxidative stress in the industrialised breeding process is yielded and production performance, health and meat quality in chicken birds are severely affected (Sola-ojo et al. Citation2019). Antioxidants are vital tools to counteract these detrimental impacts. Among them, synthetic antioxidants such as BHT, BHA and propyl gallate applied in animal breeding could work, however, are not confirmed to be safe for animals even human beings due to their increased incidence of malignant tumour (Felter et al. Citation2021). Conversely, natural antioxidants applied in poultry are well recognised to be safe, effective, reliable and wide-sourced. Therefore, seeking natural effective antioxidants from agri-forest residues to lower oxidative stress and improve chicken meat quality, is very pivotal.
Olive leaf (Olea europaea L.), as byproducts of 330,000 tons/year around the world, is one kind of potential animal nutrient used for high-quality meat. The increasingly high demand for green and healthy husbandry using natural polyphenols is available (Achat et al. Citation2012). However, olive leaf is abundant in crude fibre (over 26%), which may not be suitable for directly feeding chickens, owing to the difficulty in digestion and palatability (Altop et al. Citation2018). Oleuropein dominates the olive leaf with a variety of ranging from 8% to 14% (Japon-Lujan and de Castro Citation2006). Flavonoids (luteolin, apigenin and rutin, etc.) and single phenols (vanillin, caffeic acid, tyrosol, hydroxytyrosol, etc.) are also present in olive leaf (Rahmanian et al. Citation2015). Olive leaf extract (OLE) displayed a stronger antioxidation than vitamins C and E due to the synergic performance between oleuropeosides and other bioactive phenols (Benavente-Garcı́a et al. Citation2000). Oleuropein shows plentiful functions, for example, antioxidation and anti-inflammation (Hassen et al. Citation2015). The safety of OLE as a sensory additive in feed for all animal species was confirmed by the European Food Safety Authority (Authority EFS Citation2007). Different studies into feed additives of poultry for meat quality enhancement have concentrated on natural plant (extracts) for the sake of safety and effectiveness (Koné et al. Citation2019; Paiva et al. Citation2021). Previous findings showed that broiler meat quality and growth performance of chicken are associated with caecal microbiota (Zhang et al. Citation2021a, Citation2021b). Dried OLE can be thereby used as an effective additive for improving growth performance and antioxidation in vivo for poultry industry. Additionally, olive byproducts such as olive cake and other phytogenic leaves or extracts (i.e. Moringa oleifera) were also widely applied in poultry owing to the abundant level of phenolic compounds resulting in notably improved growth performance and meat quality as well as health status (Saleh et al. Citation2014, Citation2020; Saleh and Alzawqari Citation2021; Selim et al. Citation2021).
Taken together, olive leaf (extract) is a cheap and abundant source of phenolic compounds and is now widely used in functional foods and husbandry fields, such as ruminant animals (sheep, goat and cow) or rabbits (Molina-Alcaide and Yáñez-Ruiz Citation2008; Ribeiro et al. Citation2012). However, data on the effectiveness of OLE supplemented into the corn-soybean-based diets of broiler chickens for improving meat quality, to the best of our knowledge, are still limited. Therefore, this study aims to evaluate the effect of OLE on growth performance, breast muscle meat quality, antioxidant capacity and caecal microbiota regulation. All the findings indicate OLE can be potentially a feed additive in poultry due to its enhancing breast meat antioxidation and caecal microbial regulation.
Materials and methods
All procedures concerning the broiler chickens were performed in compliance with relevant laws and institutional guidelines (Animal Care and Use Guidelines), and these experiments obtained approval (China, NAU-2018320122000011) from the Animal Care and Use Committee of Nanjing Agricultural University.
Materials
Dried OLE (in an oven at 50 °C for 48 h) was purchased from Tianyuan Olive Development Inc. (Longnan, China). The OLE was extracted by the following protocol. A certain amount (1.0 kg) of olive leaf (Longnan City, Gansu Province), dried to approximately 4.6% moisture under the sun, was mixed with 75% ethanol-water in a solid–liquid ratio of 1:30 (kg/L). The resulting mixture was placed into an extraction kettle (RY-NSG-L, Shanghai RuiYuan Equipment Co. Ltd., China.) for extracting bioactive phenolic compounds from olive leaf under the status of solvent boiling at 90 °C reflux for 5 h. The extracted solution was obtained by vacuum filtration and then evaporated to remove ethanol at 50 °C. The final product of OLE was acquired by vacuum freezing for 50 h. Oleuropein, gallic acid and rutin were purchased from Sigma-Aldrich Inc. (St. Louis, MO, USA). Acetonitrile and formic acid were purchased from Tedia Inc. (Fairfield, OH, USA). All chemicals were at least reagent grade.
Analyses of phenolic compounds in olive leaf extract by high performance liquid chromatography-microelectrospray ionisation time-of-flight mass spectrometry
The characterisation of OLE was implemented by a Shimadzu LC20 liquid chromatography system (Shimadzu Technologies, Tokyo, Japan) with an autosampler, according to a previous report (Quirantes-Piné et al. Citation2013). Briefly, an HPLC column called Waters XBridge (3.5 μm, 150 × 2.1 mm) was applied to separate the phenolic compounds under the conditions of an injection volume of 5 μL, measurement wavelength of 280 nm and flow rate of 0.2 mL/min using a gradient elution program at 25 °C. The mobile phases contained acetonitrile (A) and 0.1% formic acid in water (B). The successive multistep linear gradient was required as follows: 0 min, 85% B; 5 min, 85% B; 25 min, 70% B; 35 min, 5% B; 40 min, 5% B. The primary states were kept for 5 min to adjust the HPLC baseline. Additionally, the HPLC system was equipped with a SCIEX triple microTOF mass spectrometer (Bruker Daltoniks, Bremen, Germany) connected to an ESI interface performing in negative ionisation mode. The other optimal settings of the ESI-QTOF-MS/MS parameters were drying gas temperature of 5000 °C, drying gas flow of 10 L/h, nebulising gas pressure of 2 bars, capillary voltage of 700 V and pulser frequency of 18.1 kHz. Detection was implemented in a mass range from 50 to 1100 m/z. The MS/MS analyses were acquired by automatic fragmentation in which the three most intense mass peaks were fragmented.
Total polyphenol and total flavonoid content
Total polyphenol and total flavonoid content in OLE were measured by Folin–Ciocalteu’s method under 760 nm and AlNO3 colourant under 420 nm based on our prior protocol (Xie et al. Citation2015).
Care and use of broiler chicken
Feeding treatments
Seven hundred and twenty 1-day-old healthy Arbour Acres broiler male chickens with no significant weight differences were obtained from Shengnong Hatchery (Huaian, Jiangsu Province, China) and randomly designated to six treatments. 20 chicks were executed in six parallel triplicates for each treatment. The chicks with six treatments were classified as one control group fed basal diets (ingredients and nutrient content seen in Table ), and five test groups including 0.1% OLE (OLE0.1, 1.0 g/kg diet), 0.2% OLE (OLE0.2, 2.0 g/kg diet), 0.3% OLE (OLE0.3, 3.0 g/kg diet), 0.4% OLE (OLE0.4, 4.0 g/kg diet) and 0.5% OLE (OLE0.5, 5.0 g/kg diet) mingled with the basal diets. Commercial feed based on corn-soybean came from Kangxin Hatchery (Nanjing, China). The resulting feed form of broiler chickens was mash feed.
Table 1. Composition and nutrient level of the corn-soybean basal diets.
Husbandry
Before implementing experiments, the birdhouse and related appliances were completely washed with running water, disinfected with a spraying caustic soda, and then fumigated by a mixture (30:1, mL/mg) of formalin and potassium permanganate for 12 h, ultimately continuously sanitising for 1 week. 720 1-day-old healthy Arbour Acres broilers were randomly divided into 6 treatment groups (5 experimental groups and 1 control group), consisting of 20 broilers per group in six parallel experiments. The chicks were caged in wire with a three-level battery and inhabited a room controlled at 32 ∼ 34 °C from 1 to 14 days. Then, the temperature was lowered by 2 °C every week until reaching 26 °C and remained constant until the experimental termination. In this study, each cage was locked and measured 320 cm in length, 120 cm in width and 50 cm in height, and it was equipped with one tube feeder. The tube feeder with a diameter of 33 cm had 7.5-cm-wide feeder slots. They were separated equally into 2 sides, and birds on the same sides were capable of making visual contact by the wire fences. These chicks were kept in a 12 h photoperiod and 12 h darkness (12 L:12 D) based on previous findings that showed benefits in achieving the maximised feed conversion efficiency, reducing protein denaturation and improving lipid stability (Lewis et al. Citation2009; Tuell et al. Citation2020). And The chicks were vaccinated against the infectious bursal disease and Newcastle disease. Chickens could be free access to feed and water ad libitum throughout the feeding period of 35 days. The average daily gain (ADG, g), the average daily feed intake (ADFI) and the feed conversion ratio (FCR) of these chickens was measured.
Sampling and treatment of broiler chicken
After 35 days of consuming the experimental diets, 72 randomly selected broilers (2 chickens per replicate) were euthanised by cervical dislocation after blood collection, and then necropsy was executed based on the operating procedure of poultry welfare slaughtering from China (GB/T 19478-2018) and European Directive 2010/63/EU. It required a 12 h starving period before the slaughtering. The venous blood sampling was shortly implemented at the neck. The blood was placed at 4 °C until the resulting serum was completely precipitated. The sampling serum was obtained by centrifugation at 3500 x g at 4 °C for 10 min. The same 6 parts of the breast muscle meat samples were generated when the carcases were pruned by eliminating feathers, bones and connective tissues. After pruning, breast muscle meat samples were cut into different slice segments. One segment was vacuum-packed and stored at −20 °C until the next analysis of cooking loss, shear force and flesh colour. The other segments of the breast muscle meats were used for preparing 10% tissue homogenate (tissue: physiological saline = 1:9, w/w) and stored at −20 °C for further antioxidation assessment.
Storage procedure of broiler chicken samples
To evaluate the effects of different levels of OLE in the basal diets on breast muscle meat quality, antioxidant capacity and enzymes and serum biochemical indexes in chickens during refrigeration storage, the sampled breast muscle meat was enveloped in sealed plastic bags and placed at −20 °C until next use.
Cooking loss of the breast muscle meat
Samples of muscle meat without connective tissue were packed in plastic bags at 0 ∼ 4 °C for 24 h. After that, the meat was weighed and recorded as W4. The meat was placed in a water bath controlled at 75 ∼ 80 °C until the temperature in the central district of the meat reached 70 °C. The cooked meat was immediately cooled with running water, dried with filter paper and weighed (W5). Therefore, the cooking loss of the meat was estimated by the following equation:
The shear force of the breast muscle meat
Breast muscle meat sealed in the plastic bag was cooked until the meat centre achieved 74 °C in the water bath controlled at 80 °C. Each piece of cooked meat was trimmed along the muscle fibre to a size of 1 cm 1 cm
3 cm, which was measured by a Salter Shear Force Instrument (G2R Elec. Mfg. Co.) in triplicate.
Meat colour measurement
The sampled breast meat stored at 4 °C in the sealed plastic bag was removed from the refrigerator after 24 h, and a fresh cross-section was cut to measure the lightness (L*), redness (a*) and yellowness (b*) in the room with normal light (not exposed to direct sunlight or darkness) by a colorimeter (WSC-S, Shanghai Minyi Electronics Co., Ltd., China) with CIELAB system.
The biochemical index in the serum
Some biochemical indexes, for example, total protein, albumin, urea nitrogen, total cholesterol, triglyceride (TG), low-density lipoprotein cholesterol, high-density lipoprotein cholesterol, creatinine, alkaline phosphatase, total bilirubin, alanine transaminase (ALT) and aspartate aminotransferase (AST) were determined in the chicken serum by a kit (Nanjing Institute of Jiancheng Bioengineering, China) and all the measuring procedures were carried out in strict accordance with the protocols instructed in the kit instructions.
Antioxidant capacity of the breast muscle meat and serum in chickens
Some antioxidant biochemical indexes, for example, total antioxidant capacity (T-AOC), total superoxide dismutase (T-SOD), glutathione peroxidase (GSH-Px), glutathione (GSH) and malondialdehyde (MDA) were measured in the breast muscle meat and serum of the chickens by a kit (Nanjing Institute of Jiancheng Bioengineering, China). All measuring procedures were carried out in strict accordance with the methods in the kit instructions (http://www.njjcbio.com/).
PCR analysis of intestinal bacteria in the caeca
DNA in broiler caeca content was extracted according to a commercial Genomic DNA Extraction Kit with a centrifugal column type (Tiangen BioChem Technology Corporation, Beijing, China), using an ultra-micro spectrophotometer NanoDrop ND-2000 (Wilmington, DE, USA) to detect the purity and concentration of the DNA. The integrity of DNA was checked by 2% agarose gel electrophoresis. The obtained DNA was stored at −20 °C for next use.
The primers for Lactobacillus, Escherichia coli, Bifidobacterium group and total bacteria in caeca were designed by some previous reports (Rinttilä et al. Citation2004; Jensen et al. Citation2011). All primers were synthesised by Invitrogen Company (Shanghai, China). The details of the primer sequences, their annealing temperatures and product size (bp) are shown in Table . Quantification of bacterial groups of caeca was implemented by SYBR Green PCR Master Mix (Dalian Bao Bioengineering Co., Ltd.). Calibration of a series of PCR products with known copy numbers per ng DNA was executed to calculate copy numbers/g sample. An ABI real-time PCR instrument StepOnePlus™ (Applied Biosystems, USA) was used to quantitatively detect the target gene transcripts. According to the Ct value obtained, the standard curve was established and the regression equation in the corresponding linear range was obtained (see Table ).
Table 2. Major compounds identified by HPLC-MS/MS in olive leaf extract.
Statistical analysis
All data in this study concerning statistical analysis were obtained using SPSS v.18.0 software program (SPSS Inc., Chicago, IL, USA) and expressed as the means ± standard deviation. Statistically significant differences between two parameters were determined by one-way analysis of variance (ANOVA). Difference (p < 0.05) among the various treatments was implemented by Duncan’s multiple range test. The definition of tendencies indicates the value becomes significantly increased or decreased with the addition of OLE ranging from 0.1% to 0.5% as a whole.
Results
Characterisation of olive leaf extract by high performance liquid chromatography-microelectrospray ionisation time-of-flight mass spectrometry
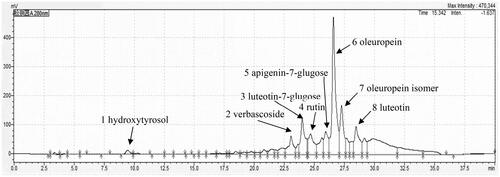
As Figure and Table indicated, 25.6% of the total polyphenol content and 6.2% of the total flavonoid content in OLE were observed. The major phenolic compounds including hydroxytyrosol (7.68 mg/g), verbascoside (17.14 mg/g), luteotin-7-glucose (65.2 mg/g), rutin (1.23 mg/g), apigenin-7-glucose (41.94 mg/g), oleuropein (515.0 mg/g), oleuropein isomer (80.21 mg/g) and luteolin (61.7 mg/g), were revealed by high performance liquid chromatography-microelectrospray ionisation time-of-flight mass spectrometry (HPLC-ESI-QTOF-MS/MS). Among them, oleuropein was concentrated at 51.5% in OLE of dry matter, followed by 6.52% luteotin, 6.17% luteotin-7-glucose and 4.194% apigenin-7-glucose.
Figure 1. HPLC profile of olive leaf extract with a concentration of 4.74 mg/mL dissolved in methanol; HPLC column of waters XBridge (3.5 μm, 150 × 2.1 mm), was applied to separate the phenolic compounds under the conditions of injection volume 5 μL, measurement wavelengths 280 nm and flow rate 0.2 mL/min using a gradient elution program at 25 °C. The mobile phases consist of acetonitrile (A) and 0.1% formic acid in water (B). The successive multistep linear gradient was required as follows: 0 min, 85% B; 5 min, 85% B; 25 min, 70% B; 35 min, 5% B; 40 min, 5% B.
The effect of various olive leaf extract levels on the broilers’ growth performance
As shown in Table , compared with the control group, no significant change in ADG and ADFI of the broiler were observed until the supplementing level of OLE was more than 0.3% in the basal diet group, which was decreased from 28.18 to 23.43 g/day (p0.001) as well as from 42.58 to 37.05 g/day (p
0.00037) in OLE0.4 group in the early period, respectively. Also, no significant changes in the FCR by all the OLE supplementation groups were observed (p
) for the whole feeding period. However, a significant variation of FCR was indicated at the statistic mode of linear in the early and later period, respectively. In addition, compared with the control group without adding any OLE, the rate of mortality and culling for broilers tended to be decreased when the addition of OLE increased in the range from 0.1% to 0.3%. The lowest rate (1.11%) of mortality and culling emerged in the OLE0.3 group. However, the rate (12%) of mortality and culling for broilers obviously increased in the OLE0.5 group when the addition of OLE continued to increase.
Table 3. Effect of different supplementation levels of olive leaf extract on the growth performance in broilers.
The effect of various olive leaf extract levels on the meat quality and antioxidation of breast muscle meat in the broilers
As shown in Table , compared with the control group, the cooking losses in the OLE0.4 and OLE0.5 groups were increased from 13.00% to 20.41% as well as from 13.00% to 21.78% (p = 0.03), respectively. The brightness, yellowness and redness levels of the breast muscle were not significant for all the OLE groups. Table also indicated that the shear forces ranging from OLE0.1 to OLE0.3 groups were decreased from 28.30 N to 18.87 N (p0.03). As seen in Figure , the MDA level of the breast muscle meat dramatically decreased from 1.75 nmol/mgprot to 1.04 nmol/mgprot in the OLE0.3 group (p = 0.016). The T-SOD activity was increased by 50.4%, and the GSH level was increased by 76.64% in the OLE0.3 group (p = 0.0036). The GSH-Px activity was strikingly increased by 120% in the OLE0.3. Also, The T-AOC activity gave rise to a marked increase from the OLE0.3 group (p = 0.0062).
Figure 2. Antioxidation of the breast-muscle meat of the broiler chickens; malondialdehyde (MDA, nmol/mgprot), total antioxidant capacity (T-AOC, U/mg prot), total superoxide dismutase (T-SOD, U/mg prot), L-glutathione (GSH, μg/mgprot) and glutathione peroxidase (GSH-Px, U/mgprot) were detected in the tissue. Values with asterisk in the figure show a significant difference at p < 0.05 by one-way measures analysis of variance (ANOVA), compared with the control. For each description, every test was executed in triplicate (n = 3).
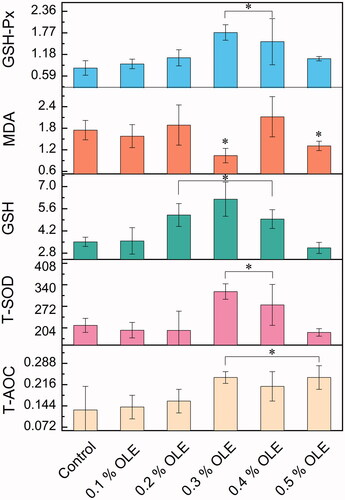
Table 4. Effect of different additions of the olive leaf extract on the meat quality of breast-muscle in chicken broilers.
The effect of various olive leaf extract levels on the biochemical index and antioxidation of broiler serum
As indicated in Table , compared with the control group, the urea nitrogen concentrations of the OLE0.1, OLE0.4 and OLE0.5 groups were increased by 158.53% (p = 0.0008), 141.46% (p = 0.0013) and 151.22% (p = 0.0008), respectively. OLE presented no significant effect on the serum of concentrations of total cholesterol, low-density lipoprotein (LDL), high-density lipoprotein (HDL) and HDL/LDL in the broilers (p = 0.22), as seen in Figure . For antioxidant performances from Figure , in the case of OLE0.3, the OLE resulted in an increased level of T-SOD activity (p = 0.00013) and decreased levels of MDA in the broiler serum (p = 0.0029); the T-AOC and catalase (CAT) activities were considerably increased by 40.40% (p = 0.021) and 22.28% (p = 0.04), respectively. The total bilirubin concentrations of the OLE0.2 group were increased by 96.66% (p = 0.0009).
Figure 3. High-density lipoprotein (HDL) and low-density lipoprotein (LDL) performances of the broiler chickens fed by olive leaf extract. Histograms with asterisk in the figure show significant difference at p < 0.05 by ANOVA, compared with the control. For each description, every test was executed in triplicate (n = 3).
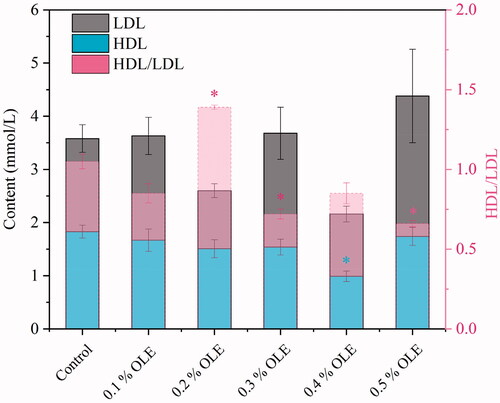
Figure 4. Antioxidation of the blood serum of the broiler chickens; MDA (nmol/mg prot), T-SOD (U/mg prot)), T-AOC (U/mg prot) and catalase (CAT, U/mg prot) were detected. Values with asterisk in the figure indicate a significant difference at p < 0.05 by ANOVA, compared with the control. For each description, every test was executed in triplicate (n = 3).
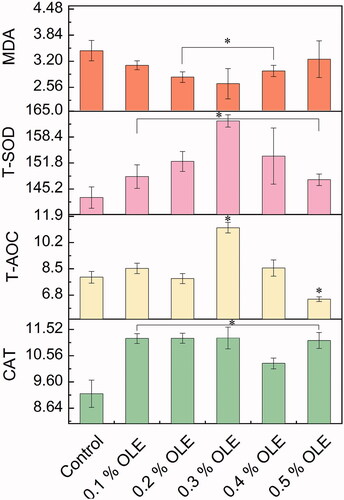
Table 5. Effect of different additions of the olive leaf extract on the serum biochemical indexes in chicken broilers.
The effect of various olive leaf extract levels on the caeca microbiota in the broilers
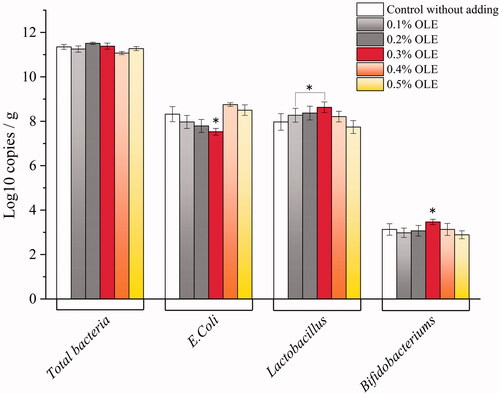
As indicated in Figure , the caecal microbiota of the broilers presented different cases depending on the levels of the supplemented OLE concerning the intensity of total bacteria, E. coli, Lactobacillus and Bifidobacterium. The OLE0.3 group exhibited a decreased intensity of E. coli (p 0.004) and a noticeably increased intensity of Lactobacillus (p = 0.016) and Bifidobacterium (p = 0.038). Specifically, compared with the group, about 12% intensity of E. coli was decreased, and about 11% intensity of Lactobacillus and 13% intensity of Bifidobacterium were increased when the broilers were supplemented by 0.3% OLE. No significant variation in total quantities of bacteria was observed throughout the OLE groups.
Figure 5. Effects of different levels of olive leaf extract on the intensity of caeca-chyme microbiota in the broilers (log10 copies/g).
Discussion
OLE, a well-recognised natural antioxidant, is widely applied in functional foods due to the abundance of oleuropein, flavonoids, phenolic acids and other phenols (Moudache et al. Citation2016). However, knowledge concerning OLE used as a broiler-chicken additive is still insufficient. Throughout the feeding period of 35 days, the addition of OLE such as 0.4% or 0.5% dramatically reduced the ADFI of broilers because the high dosage of OLE would seriously affect the palatability of the diet (Cecchi et al. Citation2013). Because of the bitter taste from oleuropein in the OLE supplemented into the basal diet, the feed intake might decrease and thereby give a lower body weight gain. Likewise, a similar situation happened in feed intakes as well. Moreover, no significant difference in the feed conversion ratio induced by OLE was observed. Especially, 0.3% OLE supplemented into the broilers’ basal diets could significantly decrease the death rate, as Table indicated. This was possible ascribed to the appropriately higher oleuropein level (1.545 g/kg diet) and the other polyphenol level for synergism efficacy. However, excessive intake doses of OLE such as 0.4% OLE or 0.5% OLE obviously increased the death rate. Generally, ∼6% of mortality and culling for broilers could be produced by plant extract. In this study, the olive-leaf-extract itself has a bitter taste, especially for the high dose of supplementation such as 0.5% OLE, the intake of the dietary became greatly reduced, giving rise to a significant resistance to diseases and even death. Furthermore, the mortality rates in chickens could happen even under standard reared condition reaching ∼5% (Pakdel et al. Citation2002) and in whom ascites was induced reaching 23%. Because ascites syndrome, is a common and major problem in broiler poultry, especially in the case of poor-managed flocks, considerably deteriorates broiler performance (Luger et al. Citation2001).
Flesh colour is one of the most intuitive indexes to evaluate meat quality. In this work, the CIELAB evaluation system was used to comprehensively examine the changes in muscle colour. OLE obviously decreased the breast muscle brightness of broiler chickens when the supplemented OLE was over 0.2%. The haem content in the breast muscle is positively related to the redness level and is negatively related to the brightness (Sirri et al. Citation2009). After feeding OLE, the brightness of the broiler breast muscle notably decreased. These changes were responsible for the haem level in the muscle. Breast muscle maturation often occurs after broiler chickens are slaughtered along with autoxidation of partial haem pigments (Rhee and Ziprin Citation1987). OLE has an excellent free-radical-scavenging capacity and acts as a strong antioxidant. The antioxidation of OLE inhibited haem autoxidation, thereby reducing the brightness value of the breast muscle and improving the redness of the breast muscle. Shear force, another important parameter of muscle tenderness, has received much attention due to its popular chewing taste. The higher the shear force for the broiler muscle, the lower the tenderness (Dean et al. Citation1972). OLE ranging from 0.1% to 0.3% greatly decreased the shear force of the broiler breast muscle, suggesting that an appropriate level of OLE could enhance the taste of chicken breast muscle and make the muscle more delicate. This is because the oxidative stress of the broilers before slaughter, transportation, or feeding conditions gave a high level of reactive oxygen radicals that induced a low quality of the breast muscle (Lund et al. Citation2011). OLE extensively improves oxidative stress as a strong radical scavenger due to a very high level of oleuropein and polyphenol.
GSH, a tripeptide nonprotein sulfhydryl compound composed of glutamate, cysteine and glycine, is a pivotal small-molecule antioxidant in cells. GSH is capable of eliminating peroxidation products and various heterogenics of broiler chickens in vivo to regulate the cell cycle and maintain the reducing power of intracellular sulfhydryl groups (Oetari et al. Citation1996). In addition, SOD is reckoned as the first antioxidant defence against free radical attacks that can result in a catalytic endogenous superoxide anion through a disproportionate reaction into hydrogen peroxide. GSH is catalysed by GSH-Px with H2O2 to transfer lipid peroxide into water and fatty alcohols only to remove or lower the oxidative toxicity induced by oxygen-free radicals. In this study, 0.3% supplement of olive leaf extract supplementation significantly increased GSH levels, GSH-Px and T-SOD activity in breast muscle. On one hand, MDA, one of the metabolic products of lipid peroxides and closely related to GSH-Px, was drastically reduced in broiler serum. The decreased MDA level and the remarkably increased GSH-Px activity of the breast meat showed that OLE enables the inhibition of oxidation and prolongs its shelf life. This is because OLE possesses great antioxidant potency in diminishing reactive oxygen species and lipid peroxidation. These findings were in good line with the previous observation demonstrated in another work (Senturk and Yildiz Citation2018), reflecting a noteworthy improvement in the health and oxidative situation of broiler chickens. This finding was consistent with the results that suggested that the appropriate addition level of OLE was beneficial for breast muscle quality. On the other hand, the CAT activity acting as H2O2 resistance was markedly increased and enhanced the antioxidant performance (Osman et al. Citation2020). Therefore, the increased antioxidant activity of OLE on the breast muscle of the broilers possibly resulted from these joint efforts, such as the synergistic effectiveness of bioactive polyphenols.
Total bilirubin is the sum of direct bilirubin and indirect bilirubin. The results showed that a 0.2% addition of OLE into the broiler chicken radically increased the level of total bilirubin in the serum, whereas addition of 0.3% or 0.4% of OLEs showed a mild increasing trend. The increased level of total bilirubin is possibly related to other causes. For instance, the relatively low concentrations of bilirubin in plasma can effectively prevent the oxidation of fatty acids from being bound to albumin as well as eliminate free radicals induced in vivo (Wu et al. Citation1996). Additionally, decreased LDL and increased HDL levels were observed (Bahşi̇ et al. Citation2016). Prior studies demonstrated that oleuropein can protect low-density lipoprotein against oxidation, thereby lowering LDL (bad cholesterol) levels. OLE presents extremely high antioxidative attributes because of this reason, at least in part. This behaviour is available to the human biosystem whereas it did not produce protection of LDL in broilers in this study, possibly owing to a significant discrepancy in the digestion system and metabolism pathway between them (Polzonetti et al. Citation2004). The alanine aminotransferase and alkaline phosphatase activities in the serum were obviously increased in addition to hepatic fibrosis when OLE concentrations were supplemented over 0.5% compared with the control (Arantes-Rodrigues et al. Citation2011).
For microbial regulation of OLE in the broiler caeca, the high dose of oleuropein and polyphenol enrichment in OLE gave a significant quantitative decrease in terms of E. coli and a notable increase in terms of Lactobacillus and Bifidobacterium quantity. All of these factors can largely improve the broiler’s gut health, which is thereby very helpful in promoting meat quality (Chen et al. Citation2019; Dev et al. Citation2020). Specifically, E. coli is distributed among poultry of all ages and is a natural inhabitant of the gut in poultry. Escherichia coli is commonly referred to as colibacillosis. It could lead to woody breast meat. The woody breast myopathy of broilers was affected by broiler strain and diet (Zhang et al. Citation2018). Reducing the abundance of Escherichia and Shigella in the broiler caeca (Eeckhaut et al. Citation2016) has potential in improving broilers’ gut health and reducing woody breast development (Zhang et al. Citation2021a). Also, some cell surface proteins from Lactobacillus could immobilise E. coli and prohibit its propagation (Tsou et al. Citation2017). Secoiridoids, flavonoids and simple phenols in OLE that inhibit E. coli resulted from alterations in cytoplasmic membranes and the cell wall (Rodríguez et al. Citation2009), and the E. coli abundance was dramatically decreased by the plant extracts. However, the additive/synergic effects of the different products that are present in this extract can also play a key role, making it difficult to discriminate and correlate each activity to specific compounds (Vezza et al. Citation2019). For instance, previous observations demonstrated that OLE had an antioxidant activity significantly higher than vitamin C and E, due to the synergy between flavonoids, oleuropeosides and substituted phenols (Benavente-Garcı́a et al. Citation2000). Also, a combination of quercetin and caffeic acid for each individual compound at 5 μm in a 1:1 mixture indicated an additive effect of antioxidation (Meyer et al. Citation1998). A combination of rutin and α-tocopherol for each individual compound at 0.1 ∼ 1.0 mM in 1:1 ratio indicated a synergism effect of antioxidation in vitro (Kancheva et al. Citation2007; Kancheva Citation2009). The gut microbiota functions in gut health and nutrition in poultry industry. Probiotics and prebiotics are generally utilised for modulating gut microbiota. In this scenario, oleuropein and hydroxytyrosol enable adjusting the composition of gut microbiota and improving gut integrity (Sarica and Urkmez Citation2016). One possible reason for inhibiting the growth of E. coli is that polyphenols can bind to bacterial cell membranes to disturb membrane function, for example, altering the permeability and proton motive force through the loss of H+-ATPase and membrane-related functions (Lin et al. Citation2005; Cardona et al. Citation2013). A possible description for the resulting effect of phenols on bacterial growth such as Lactobacillus and Bifidobacterium is that they enable using these phenols as substrates. Lactobacilli can metabolise the polyphenols in the growing process and polyphenols provide energy for cells in turn. Besides, these polyphenols can intensify nutrient consumption such as carbohydrates (García-Ruiz et al. Citation2008). In a word, polyphenol supplementation in poultry can modulate caecal microbiota species and levels, as exemplified in our study.
Conclusions
In this study, we observed that the OLE containing a high amount of oleuropein, polyphenols and flavonoids, can be effectively applied as an alternative additive of synthetic antioxidant for improving meat quality, increasing antioxidation and caecal health. Also, 0.3% OLE supplemented into the basal diet of broiler chickens gave rise to superior multiple performances. Specifically, the meat quality and antioxidation of broilers were greatly improved: including a considerate reduction in shear force of the meat, a notable enhancement in the levels of the antioxidant enzymes (T-AOC, T-SOD, GSH-Px and CAT) and GSH, as well as a decrease in the MDA level. Moreover, OLE plays a key role in diminishing the intensity of E. coli and enlarging the intensity of Lactobacillus and Bifidobacterium in terms of caecal microbiota. Overall, a proportional addition of OLE into the basal diet is potentially used as an effective natural antioxidant and a caecum-health promoter for enhancing meat quality in broilers.
Ethical approval
The experiment was approved by the Animal Care and Use Committee of Nanjing Agricultural University (Nanjing, China, NAU-2018320122000011).
Supplemental Material
Download MS Word (24.4 KB)Acknowledgements
The authors thank Prof. Wang Tian for providing great support towards broiler management and Dr. Zhang Hao for caecal microbiota analysis from the College of Animal Science and Technology at Nanjing Agricultural University.
Disclosure statement
No potential conflict of interest was reported by the author(s).
Additional information
Funding
References
- Achat S, Tomao V, Madani K, Chibane M, Elmaataoui M, Dangles O, Chemat F. 2012. Direct enrichment of olive oil in oleuropein by ultrasound-assisted maceration at laboratory and pilot plant scale. Ultrason Sonochem. 19(4):777–786.
- Altop A, Coskun I, Filik G, Kucukgul A, Bekiroglu YG, Cayan H, Gungor E, Sahin A, Erener G. 2018. Amino acid, mineral, condensed tannin, and other chemical contents of olive leaves (Olea europaea L.) processed via solid-state fermentation using selected Aspergillus niger strains. Cienc E Invest Agr. 45(3):220–230.
- Arantes-Rodrigues R, Henriques A, Pires MJ, Colaço B, Calado AM, Rema P, Colaço A, Fernandes T, De la Cruz PLF, Lopes C, et al. 2011. High doses of olive leaf extract induce liver changes in mice. Food Chem Toxicol. 49(9):1989–1997.
- Authority EFS. 2007. Opinion of the scientific panel on additives and products or substances used in animal feed (FEEDAP) on safety and efficacy of Panaferd-AX (red carotenoid-rich bacterium Paracoccus carotinifaciens) as feed additive for salmon and trout. EFSA J. 5(10):546.
- Bahşi̇ M, Çi̇ftçi̇ M, Şi̇mşek ÜG, Azman MA, Özdemi̇r G, Yılmaz Ö, Dalkılıç B. 2016. Effects of olive leaf extract (oleuropein) on performance, fatty acid levels of breast muscle and some blood parameters in Japanese quail (Coturnix coturnix Japonica) reared in different stocking dens. Vet Fak Derg. 63(1):61–68.
- Benavente-Garcı́a O, Castillo J, Lorente J, Ortuño A, Del Rio JA. 2000. Antioxidant activity of phenolics extracted from Olea europaea L. leaves. Food Chem. 68(4):457–462.
- Cardona F, Andrés-Lacueva C, Tulipani S, Tinahones FJ, Queipo-Ortuño MI. 2013. Benefits of polyphenols on gut microbiota and implications in human health. J Nutr Biochem. 24(8):1415–1422.
- Cecchi L, Migliorini M, Cherubini C, Giusti M, Zanoni B, Innocenti M, Mulinacci N. 2013. Phenolic profiles, oil amount and sugar content during olive ripening of three typical Tuscan cultivars to detect the best harvesting time for oil production. Food Res Int. 54(2):1876–1884.
- Chen X, Zhu W, Liu X, Li T, Geng Z, Wan X. 2019. The growth performance, meat quality, and gut bacteria of broilers raised with or without antibiotics and green tea powder. J Appl Poult Res. 28(3):712–721.
- Dean P, Sutton H, Proudfoot FG. 1972. The effect of environmental flock treatments on broiler carcass quality. Poult Sci. 51(4):1476–1477.
- Dev K, Mir NA, Biswas A, Kannoujia J, Begum J, Kant R, Mandal A. 2020. Dietary synbiotic supplementation improves the growth performance, body antioxidant pool, serum biochemistry, meat quality, and lipid oxidative stability in broiler chickens. Anim Nutr. 6(3):325–332.
- Eeckhaut V, Wang J, Van Parys A, Haesebrouck F, Joossens M, Falony G, Raes J, Ducatelle R, Van Immerseel F. 2016. The probiotic Butyricicoccus pullicaecorum reduces feed conversion and protects from potentially harmful intestinal microorganisms and necrotic enteritis in broilers. Front Microbiol. 7:1416.
- Felter SP, Zhang X, Thompson C. 2021. Butylated hydroxyanisole: carcinogenic food additive to be avoided or harmless antioxidant important to protect food supply? Regul Toxicol Pharmacol. 121(1):104887.
- García-Ruiz A, Bartolomé B, Martínez-Rodríguez AJ, Pueyo E, Martín-Álvarez PJ, Moreno-Arribas MV. 2008. Potential of phenolic compounds for controlling lactic acid bacteria growth in wine. Food Control. 19(9):835–841.
- Hassen I, Casabianca H, Hosni K. 2015. Biological activities of the natural antioxidant oleuropein: exceeding the expectation – a mini-review. J Funct Foods. 18:926–940.
- Japon-Lujan R, de Castro L. 2006. Superheated liquid extraction of oleuropein and related biophenols from olive leaves. J Chromat A. 1136(2):185–191.
- Jensen SR, Fink LN, Struve C, Sternberg C, Andersen JB, Brynskov J, Nielsen OH, Brix S. 2011. Quantification of specific E. coli in gut mucosa from Crohn’s disease patients. J Microbiol Methods. 86(1):111–114.
- Kancheva VD. 2009. Phenolic antioxidants - radical scavenging and chain-breaking antioxidant activity. Comparative study. Eur J Lipid Sci Technol. 111(11):1072–1089.
- Kancheva VD, Taskova R, Totseva I, Handjieva N. 2007. Antioxidant activity of extracts, fractions and flavonoid constituents from Carthamus lanatus L. Riv Ital Sostanze Gr. 84:77–86.
- Koné AP, Desjardins Y, Gosselin A, Cinq-Mars D, Guay F, Saucier L. 2019. Plant extracts and essential oil product as feed additives to control rabbit meat microbial quality. Meat Sci. 150:111–121.
- Lewis PD, Danisman R, Gous RM. 2009. Photoperiodic responses of broilers. I. Growth, feeding behaviour, breast meat yield, and testicular growth. Brit Poult Sci. 50(6):657–666.
- Lin YT, Vattem DA, Labbe RG, Shetty K. 2005. Enhancement of antioxidant activity and inhibition of Helicobacter pylori by phenolic phytochemical enriched alcoholic beverages. Process Biochem. 40(6):2059–2065.
- Luger D, Shinder D, Rzepakovsky V, Rusal M, Yahav S. 2001. Association between weight gain, blood parameters, and thyroid hormones and the development of ascites syndrome in broiler chickens. Poult Sci. 80(7):965–971.
- Lund MN, Heinonen M, Baron CP, Estévez M. 2011. Protein oxidation in muscle foods: a review. Mol Nutr Food Res. 55(1):83–95.
- Meyer AS, Heinonen M, Frankel EN. 1998. Antioxidant interactions of catechin, cyanidin, caffeic acid, quercetin, and ellagic acid on human LDL oxidation. Food Chem. 61(1-2):71–75.
- Molina-Alcaide E, Yáñez-Ruiz DR. 2008. Potential use of olive by-products in ruminant feeding: a review. Anim Feed Sci Technol. 147(1-3):247–264.
- Moudache M, Colon M, Nerin C, Zaidi F. 2016. Phenolic content and antioxidant activity of olive by-products and antioxidant film containing olive leaf extract. Food Chem. 212:521–527.
- Oetari S, Sudibyo M, Commandeur JNM, Samhoedi R, Vermeulen NPE. 1996. Effects of curcumin on cytochrome P450 and glutathione S-transferase activities in rat liver. Biochem Pharmacol. 51(1):39–45.
- Osman A, Bin-Jumah M, Abd El-Hack ME, Elaraby G, Swelum AA, Taha AE, Sitohy M, Allam AA, Ashour EA. 2020. Dietary supplementation of soybean glycinin can alter the growth, carcass traits, blood biochemical indices, and meat quality of broilers. Poult Sci. 99(2):820–828.
- Paiva G, Trindade MA, Romero JT, Silva-Barretto A. 2021. Antioxidant effect of acerola fruit powder, rosemary and licorice extract in caiman meat nuggets containing mechanically separated caiman meat. Meat Sci. 173(2):108406.
- Pakdel A, Van Arendonk JA, Vereijken AL, Bovenhuis H. 2002. Direct and maternal genetic effects for ascites-related traits in broilers. Poult Sci. 81(9):1273–1279.
- Polzonetti V, Egidi D, Vita A, Vincenzetti S, Natalini P. 2004. Involvement of oleuropein in (some) digestive metabolic pathways. Food Chem. 88(1):11–15.
- Quirantes-Piné R, Lozano-Sánchez J, Herrero M, Ibáñez E, Segura-Carretero A, Fernández-Gutiérrez A. 2013. HPLC–ESI–QTOF–MS as a powerful analytical tool for characterising phenolic compounds in olive-leaf extracts. Phytochem Anal. 24(3):213–223.
- Rahmanian N, Jafari SM, Wani TA. 2015. Bioactive profile, dehydration, extraction and application of the bioactive components of olive leaves. Trends Food Sci Technol. 42(2):150–172.
- Rhee KS, Ziprin YA. 1987. Lipid oxidation in retail beef, pork and chicken muscles as affected by concentrations of heme pigments and nonheme iron and microsomal enzymic lipid peroxidation activity. J Food Biochemistry. 11(1):1–15.
- Ribeiro L, Pinheiro V, Outor-Monteiro D, Mourão J, Bezerra RMF, Dias AA, Bennett RN, Marques G, Rodrigues MAM. 2012. Effects of the dietary incorporation of untreated and white-rot fungi (Ganoderma resinaceum Boud) pre-treated olive leaves on growing rabbits. Anim Feed Sci Technol. 173(3-4):244–251.
- Rinttilä T, Kassinen A, Maline E, Krogius L, Palva A. 2004. Development of an extensive set of 16S rDNA-targeted primers for quantification of pathogenic and indigenous bacteria in faecal samples by real-time PCR. J Appl Microbiol. 97(6):1166–1177.
- Rodríguez H, Curiel JA, Landete JM, de las Rivas B, de Felipe FL, Gómez-Cordovés C, Mancheño JM, Muñoz R. 2009. Food phenolics and lactic acid bacteria. Int J Food Microb. 132(2-3):79–90.
- Saleh A, Alzawqari M. 2021. Effects of replacing yellow corn with olive cake meal on growth performance, plasma lipid profile, and muscle fatty acid content in broilers. Animals. 11(8):2240.
- Saleh AA, Ijiri D, Ohtsuka A. 2014. Effects of summer shield supplementation on the growth performance, nutrient utilization, and plasma lipid profiles in broiler chickens. J Vet Med. 59:536–542.
- Saleh AA, Paray BA, Dawood MAO. 2020. Olive cake meal and Bacillus licheniformis impacted the growth performance, muscle fatty acid content, and health status of broiler chickens. Animals. 2020:10. 695.
- Sarica S, Urkmez D. 2016. The use of grape seed-, olive leaf- and pomegranate peel-extracts as alternative natural antimicrobial feed additives in broiler diets. Eur Poult Sci. 80:1–13.
- Selim S, Seleiman MF, Hassan MM, Saleh AA, Mousa MA. 2021. Impact of dietary supplementation with Moringa oleifera leaves on performance, meat characteristics, oxidative stability, and fatty acid profile in growing rabbits. Animals. 11(2):248.
- Senturk H, Yildiz F. 2018. Protective effects of Olea Europaea L. (olive) leaf extract against oxidative stress injury generated with renal ischemia reperfusion. J Ani Plant Sci. 28(4):1027–1033.
- Shahbandeh M. 2022. Production of meat worldwide from 2016 to 2021, by type. New York (NY): Statista. https://www.statista.com/statistics/237632/production-of-meat-worldwide-since-1990/#statisticContainer. Accessed date: June 2022.
- Sirri F, Bianchi M, Petracci M, Meluzzi A. 2009. Influence of partial and complete caponization on chicken meat quality. Poult Sci. 88(7):1466–1473.
- Sola-ojo FE, Adeyemi KD, Alli OI, Ibiwoye DI, Taiwo O, Onyebuchi KU, Akilapa MA. 2019. Effects of acute heat stress on performance and blood parameters of four broiler chicken strains reared in north central Nigeria. J Agr Food Envir. 6:1–15.
- Tsou LK, Yount JS, Hang HC. 2017. Epigallocatechin-3-gallate inhibits bacterial virulence and invasion of host cells. Bioorg Med Chem. 25(11):2883–2887.
- Tuell JR, Park JY, Wang WC, Cheng HW, Kim YHB. 2020. Functional/physicochemical properties and oxidative stability of ground meat from broilers reared under different photoperiods. Poult Sci. 99(7):3761–3768.
- Vezza T, Rodríguez-Nogales A, Algieri F, Garrido-Mesa J, Romero M, Sánchez M, Toral M, Martín-García B, Gómez-Caravaca AM, Arráez-Román D, et al. 2019. The metabolic and vascular protective effects of olive (Olea europaea L.) leaf extract in diet-induced obesity in mice are related to the amelioration of gut microbiota dysbiosis and to its immunomodulatory properties. Pharmacol Res. 150:104487.
- Wu TW, Fung KP, Wu J, Yang CC, Weisel RD. 1996. Antioxidation of human low density lipoprotein by unconjugated and conjugated bilirubins. Biochem Pharmacol. 51(6):859–862.
- Xie PJ, Huang LX, Zhang CH, Zhang YL. 2015. Phenolic compositions, and antioxidant performance of olive leaf and fruit (Olea europaea L.) extracts and their structure–activity relationships. J Funct Foods. 16:460–471.
- Zhang X, Hendrix JD, Byron MD, Mukherjee S, Campbell YL, Zhai W, Schilling MW. 2018. Broiler genetic strain and diet on the incidence of woody breast meat. Meat Muscle Biol. 2(2):124–124.
- Zhang X, Zhang L, Li X, White S, Campbell YL, Ruiz AA, To KV, Zhai W, Schilling MW. 2021a. Cecal microbiota contribute to the development of woody breast myopathy. Poult Sci. 100(6):101124.
- Zhang X, Hu Y, Ansari AR, Akhtar M, Chen Y, Cheng R, Cui L, Nafady AA, Elokil AA, Abdel-Kafy E-SM, et al. 2021b. Caecal microbiota could effectively increase chicken growth performance by regulating fat metabolism. Microb Biotechnol. 15(3):844–861.