
Abstract
High-energy diets improve growth rates and shorten the growth period while resulting in excessive fat deposition in the liver of birds. The effect of different energy diets on lipid content and liver transcriptome in finisher Huxu chickens was examined here. A total of 200 90-d-old Huxu chickens with an average BW of 1.08 kg were randomly divided into two dietary treatments. The birds were fed diets either containing 12.06 MJ ME/kg (low metabolic energy, LME) or 13.31 MJ ME/kg (high metabolic energy, HME) for 45 days. Chickens fed the HME diet had significantly higher total triglyceride and total cholesterol concentrations in both plasma and liver than did those fed the LME diet. Transcriptomic profiling showed 480 known differentially expressed genes (DEG), with 180 down-regulated and 300 up-regulated chickens from the HME diet compared with the LME diet. Notably, these genes were mostly enriched in lipid metabolism including the PPAR signalling pathway, fatty acid elongation, and glycerophospholipid metabolism. The relative mRNA expression level of 14 lipid metabolism-related genes, included 13 up-regulated (MBOAT2, PLA2G2E, AGPAT2, AGPAT3, PCYT2, PEMT, ELOVL2, HADHA, ACOT1L, FABP3, FABP1, PLIN1, RXRG) and one down-regulated (LCAT) gene. In conclusion, the present findings indicate that a high-energy diet likely regulates gene expression of the 14 lipid metabolism-related genes through the PPAR signalling pathway, fatty acid elongation, and glycerophospholipid metabolism resulting in excessive fat accumulation in the liver of Huxu chickens. These results provide a better understanding of the biological mechanisms by which the increased dietary energy induces fat accumulation in the liver.
A high-energy diet without change in protein level induced excessive fat accumulation in the Huxu chickens.
Chickens fed the high-energy diet had induced higher total triglyceride and total cholesterol concentrations in both plasma and liver.
This study showed a comprehensive profile of hepatic gene expression in chickens with fatty liver induced by high energy.
Highlights
Introduction
Chickens provide one of the most popular meat sources around the world. With many advantages as human food, such as low caloric value, low portion of saturated fat and ease of digestion, the demand for chicken meat is increasing. Chicken diets with high energy content are commonly used to improve growth rates and shorten the growth period of chickens (Tan et al. Citation2021). However, high-energy diets disturb lipid homeostasis, resulting in excessive fat accretion (Rozenboim et al. Citation2016; Cisa-Wieczorek and Hernández-Alvarez Citation2020). Because much of this fat is “waste” and is removed during carcase processing, the feed conversion ratio is decreased, while feed cost representing over 60% of input expenses in chicken production is increased (Desert et al. Citation2018).
The liver plays a significant role in the regulation of lipid metabolism in chickens (Liu et al. Citation2016). Hepatic lipid homeostasis reflects all aspects of lipid metabolism including lipogenesis, lipolysis and lipid transportation (Wang et al. Citation2012). Disorders of these metabolic pathways may result in hepatic lipid over-accumulation, thereby causing fatty liver and more severe liver failure in chickens (Gruben et al. Citation2014; Zhang et al. Citation2018). Many nutritional factors have been reported to induce fatty liver. High energy and low protein diets promote fat accumulation in the liver by increasing fatty acid biosynthesis (Rozenboim et al. Citation2016). The deficiency of choline, vitamin B and vitamin E may result in excessive lipid accumulation by inhibiting the export of lipid from the liver (Whitehead and Randall Citation1982; Zhang et al. Citation2018).
Globally, China is the second-largest producer of chicken meat, almost half of which is from Chinese yellow-feathered breeds (around 4 billion birds annually). Yellow chickens, therefore, play a critical role in the meat industry because they are popular with consumers in China due to their distinct flavour (Cui et al. Citation2019; Gou et al. Citation2020). Worldwide, there is an expanding market and increased consumer demand recently for slow-growing meat-type chickens which provide better tasting meat; however, little effort has gone into optimising their feeding standards and dietary nutrient requirements (Abouelezz et al. Citation2019). The excessive fat deposition was observed in Huxu chickens even though they were fed typical diets based on nutrient requirements for Chinese yellow chickens (Cui et al. Citation2022). Accordingly, the Huxu chicken might be a promising experiment model for the study of fatty liver, for which the precise molecular mechanism has not been fully elucidated. It is hypothesised that feeding different energy concentrations can help in clarifying the metabolic pathways regulating fatty liver in Huxu chickens; this could give a better knowledge of the molecular mechanisms behind this fat accumulation. In the present study, corncob was used as the fibre source to replace part of the corn in the diet to reduce the density of readily-digestible energy. The hepatic transcriptome of Huxu chickens fed high and low-energy diets were analysed. The present work has investigated whether a high-energy diet can cause fatty liver in the Huxu chickens. In addition, this study likely provides a theoretical basis for practical production of Huxu chickens based on reducing the occurrence of Huxu's fatty liver through dietary energy regulation which has great economic value in China market.
Materials and methods
Animals and diets design
The hatchlings were obtained from national Huiyang Huxu chicken conservation stock (Boluo County, Huizhou City, Guangdong Province, China), and all chicks had the same genetic background. 1-d-old Huxu female chicks were fed a common conventional diet from 1 to 90 d of age. On d 90, two hundred birds with an average BW of 1.08 kg were randomly assigned to 2 dietary treatments (10 replicates per treatment with 10 birds per replicate, 2 chickens per cage). Experimental diets were formulated based on the Chinese Nutrient Requirements of Yellow Chickens (2020). The birds were either fed a diet containing 12.06 MJ ME/kg (low metabolic energy, LME) or a diet containing 13.31 MJ ME/kg (high metabolic energy, HME). The composition of the diets is shown in Table . From 90 to 135 d of age, i.e. the finishing phase for this breed, chickens were fed in three-story step cages (40 cm × 45 cm × 45 cm), the ambient temperature ranged from 18° to 26 °C, and the relative humidity was maintained at 60%. They received an average of 12 h of natural light per day. Fresh drinking water and feed were available ad libitum throughout the study. Birds were weighed again at the end of the study on day 135. Overall performance was calculated based on weight gain and feed intake. No birds died during the overall experiment.
Table 1. Composition and nutrient levels of experimental diets (% as fed-basis)*.
Sample collection
On day 135 (typical market age), birds were sampled. One bird (with the BW close to the average of the replicate) from each replicate was chosen and bled from the brachial vein. The plasma was collected by centrifugation and then kept at −20 °C. After bleeding, chickens were exsanguinated by experienced technicians, the livers were excised, weighed, and the middle part of the right lobe of the liver was sampled and frozen in liquid N2 immediately, and stored at −80 °C for RNA extraction and determination of lipid indices.
Biochemical analysis
Liver samples were pre-treated as previously described (Cui et al. Citation2019); the samples were homogenised in a mixed solution of methanol and chloroform. After centrifuging, the supernatant was taken for analyses of lipid indices. All measurements were made in triplicate, at appropriate dilutions. The hepatic total triglyceride (TG) and total cholesterol (TCH) contents were determined spectrophotometrically using commercial kits (Jiancheng Bioengineering Institute, Nanjing, PRC). The plasma concentrations of TG, TCH, high-density lipoprotein cholesterol (HDL-C) and low-density lipoprotein cholesterol (LDL-C) were determined, similarly to Gou et al. (Citation2020), using commercially available kits.
RNA extraction and transcriptomic profiling
The RNA extraction was performed as previously described (Cui et al. Citation2018). The method of RNA extraction is given in Supplementary Material S1. Based on the Illumina NovaSeq 6000 platform (Illumina, San Diego, CA), RNA-seq was performed by Shanghai Personal Biotechnology Co., Ltd. (Shanghai, PRC) using total RNA from liver samples from three representative chickens of the LME and HME treatments. The cDNA libraries for RNA-seq were generated using TruSeq RNA Sample Preparation Kit (Illumina) according to Illumina’s instructions. Raw data were output in FASTQ format file, clean data were obtained by removing adaptors and low-quality reads from raw data, and quality control was performed using FastQC. Sequencing reads were mapped to the chicken reference genome [Ensembl GRCg6a (GCA_000002315.5)] using the HISAT2 (v2.1.0) program. Read count of each gene derived from the mapping results was analysed by the HTSeq Python package (v0.11.1) and then normalised to FPKM (Fragments Per Kilo bases per Million fragments). DESeq (v1.36.0) was used to analyse differences in gene expression (Love et al. Citation2014), and |log2 fold change| > 1 and P < 0.05 were selected as the thresholds for differentially expressed genes (DEG).
The volcano map of DEG was charted utilising the ggplots2 software package of R language and used to visualise the overall distribution of DEG. Cluster analysis of DEG was performed using the R language heatmap software package. Gene Ontology (GO) enrichment analysis was performed for features corresponding to DEG using the topGO software package. According to the Kyoto encyclopaedia of genes and genomes (KEGG) database resources, pathway enrichment analysis was used to further seek out the notably enriched metabolic pathways or signalling pathways. Taking the whole genome as the background, significant enrichment terms and pathways for DEG were calculated using a hypergeometric test from the R packages. The significance level for GO terms and the KEGG pathway was set with the P-value < 0.05.
Quantitative PCR (q-PCR) validation
In this study, a total of 14 genes were selected (MBOAT2, PLA2G2E, AGPAT2, AGPAT3, PCYT2, PEMT, ELOVL2, HADHA, ACOT1L, FABP3, FABP1, PLIN1, RXRG and LCAT), all of which are involved in lipid metabolism pathways. Precise DEG profiles from q-PCR were used to validate differences exposed by the RNA-Seq analyses. The specific primers were designed by Primer Premier 6.0 software based on the target region and are shown in Supplementary Table S1. All RNA samples were reverse transcribed to cDNA using M-MLV reverse transcriptase (Promega, Madison, WI), and the cDNA synthesis was then amplification by q-PCR using Green Supermix (Takara Biotechnology, Dalian, PRC). The PCR cycling was similar to Gou et al. (Citation2020). PCR efficiency for these genes and β-actin was consistent. The 2−ΔΔCT method was used to calculate the relative abundance of transcripts (Livak and Schmittgen Citation2001).
Statistical analysis
The growth performance traits, biochemical indices and q-PCR data were performed by independent-samples t-tests using SPSS 19.0 software (SPSS Inc., Chicago, IL). Values are presented as mean ± SEM. P < 0.05 was considered to be significant. Associations between relative abundances from q-PCR and RNA-seq data were examined by Pearson’s pairwise correlations.
Results
Growth performance
As shown in Table , the chickens fed HME diet showed greater (P < 0.05) final BW and average daily gain (ADG) and lower (P < 0.05) feed/gain ratio than those fed LME diet.
Table 2. Effects of low metabolic energy (LME) diet and high metabolic energy (HME) diet on growth performance in Yellow-feathered chickens from 90 to 135 days of age.
Differences in plasma and hepatic lipids between chickens fed LME and HME diets
As shown in Table , the chickens fed HME had significantly higher TG and TCH concentrations in both plasma and liver than did those fed LME. No significant change was observed in plasma HDL-C and LDL-C levels in chickens in the LME and HME treatments. Chickens fed the HME diet significantly increased the relative weight of the liver than those fed the LME diet.
Table 3. Effects of low metabolic energy (LME) diet and high metabolic energy (HME) diet on lipid metabolism indices and the relative weight of liver in Yellow-feathered chickens.
Identification and analysis of DEGs between chickens fed LME and HME diets
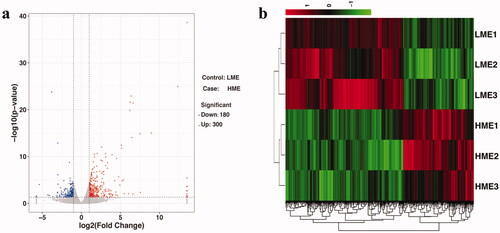
All samples were sequenced on the Illumina system and each sample contains on average ∼50 million reads. We found that a high proportion of the RNA-seq reads aligned back to our de novo assembled transcriptome with a 95% mapping rate. Transcriptome analysis was performed and the DEG in livers of birds fed the LME and HME diets were examined. A total of 480 known DEGs were screened: 180 were down-regulated and 300 were up-regulated in chickens fed the HME diet when compared with those fed the LME diet (Figure and Supplementary Table S2). Based on these 480 DEGs, hierarchical clustering analysis was performed to evaluate the consistency and variance of the samples, and the results showed that samples from within each dietary treatment were clustered together (Figure ), verifying acceptable repeatability.
Figure 1. (a) Volcano map. The red dots represent upregulated (P < 0.05) differentially expressed genes (DEG), the blue dots represent downregulated (P < 0.05) DEG, and the gray dots represent insignificant genes in the liver between chickens fed low metabolic energy (LME) and high metabolic energy (HME) diets. (b) Hierarchical clustering. Cluster analyses were performed based on 480 known DEG in the liver between chickens fed LME and HME diets, the LME diet and HME diet were clustered, respectively. Up-regulated DEG are in red and down-regulated DEG are in green.
Gene ontology enrichment analysis of DEG related to hepatic lipids metabolism
To understand the functions of known DEG involved in the development of fatty liver, they were analysed with respect to enrichment in GO terms. GO analysis showed that based on the criteria of P value < 0.05, DEG contains 535 GO terms (Supplementary Table S3). Among them, there are 122 GO terms related to lipid metabolism (Supplementary Table S3), several top lipid-related terms including: protein-lipid complex remodelling, plasma lipoprotein particle remodelling, plasma lipoprotein particle organisation, low-density lipoprotein particle remodelling, protein-lipid complex subunit organisation, plasma lipoprotein particle, lipoprotein particle, protein-lipid complex, phosphatidylcholine metabolic process, reverse cholesterol transport, phospholipid homeostasis, cholesterol homeostasis, sterol homeostasis, and regulation of plasma lipoprotein particle levels (Table ). Moreover, GO enrichment analysis indicated that 62 DEG were associated with lipid metabolism, including 52 up-regulated and 10 down-regulated genes (Supplementary Table S3).
Table 4. Lipid metabolism-related biological processes and cellular component identified by Gene Ontology (GO) analysis of differentially expressed genes between chickens fed low metabolic energy (LME) and high metabolic energy (HME) diets.
KEGG pathway enrichment analysis of DEG involved in hepatic lipid metabolism
KEGG analysis was performed and an enriched bubble chart provided a graphic display of the top 20 most enriched pathways for DEG (Figure ). Among the top 20, cytokine-cytokine receptor interaction was the most enriched pathway. Importantly, several lipid metabolism-related pathways were enriched (P < 0.05), including the PPAR signalling pathway, fatty acid elongation, and glycerophospholipid metabolism (Supplementary Table S4). As shown in Table , there was 14 DEG associated with the lipid metabolism signalling pathway, among which 13 genes (MBOAT2, PLA2G2E, AGPAT2, AGPAT3, PCYT2, PEMT, ELOVL2, HADHA, ACOT1L, FABP3, FABP1, PLIN1, RXRG) were up-regulated and 1 gene (LCAT) was down-regulated in chickens fed the HME diet when compared with those fed the LME diet. There is 15 DEG in cytokine-cytokine receptor interaction, of which 3 were up-regulated and 12 were down-regulated. These results indicated that the HME diet may promote hepatic lipid deposition while suppressing the expression of cell junction-related genes. In addition, several amino acid metabolism-related pathways were also enriched (P < 0.05), including Tyrosine metabolism, Tryptophan metabolism and Histidine metabolism.
Figure 2. KEGG pathway analyses of differentially expressed genes (DEG) in the liver between chickens fed LME and HME diets. The x-axis represents the rich factor, the y-axis represents the enriched pathway. The size of the bubble indicates the number of DEG enriched in the pathway, and the different colours represent enrichment significance, the red colour means the enrichment result is significant.
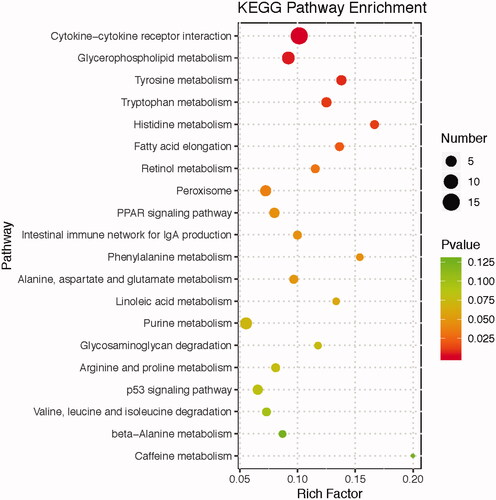
Table 5. The differentially expressed genes involved in five key KEGG pathways between chickens fed low metabolic energy (LME) and high metabolic energy (HME) diets.
Validation of the DEG by q-PCR
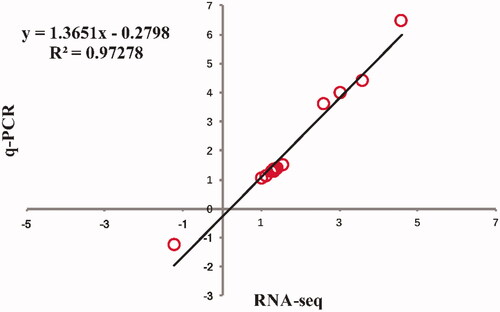
The relative mRNA expression level of 14 lipid metabolism-related genes, consisting of 13 up-regulated (MBOAT2, PLA2G2E, AGPAT2, AGPAT3, PCYT2, PEMT, ELOVL2, HADHA, ACOT1L, FABP3, FABP1, PLIN1, RXRG) and one down-regulated (LCAT) genes, were chosen for q-PCR analysis to examine the accuracy of the RNA-seq data. As shown in Figure , the expression levels of 14 DEG analysed by q-PCR were the same as RNA-seq data. As shown in Figure , the fold changes of expression of these genes by RNA-seq and q-PCR were highly correlated (r = 0.986, P < 0.01), confirming the reliability of the RNA-seq results.
Figure 3. Validation of RNA-seq data by q-PCR analyses. ** indicate significance at P < 0.01. MBOAT2: membrane bound O-acyltransferase domain containing 2; PLA2G2E: phospholipase A2 group IIE; AGPAT2: 1-acylglycerol-3-phosphate O-acyltransferase 2; AGPAT3: 1-acylglycerol-3-phosphate O-acyltransferase 3; PCYT2: phosphate cytidylyltransferase 2; PEMT: phosphatidylethanolamine N-methyltransferase; ELOVL2: fatty acid elongase 2; HADHA: hydroxyacyl-CoA dehydrogenase trifunctional multienzyme complex subunit alpha; ACOT1L: acyl-CoA thioesterase 1-like; FABP3: fatty acid binding protein 3; FABP1: fatty acid binding protein 1; PLIN1: perilipin 1; RXRG: retinoid X receptor gamma; LCAT: lecithin-cholesterol acyltransferase.
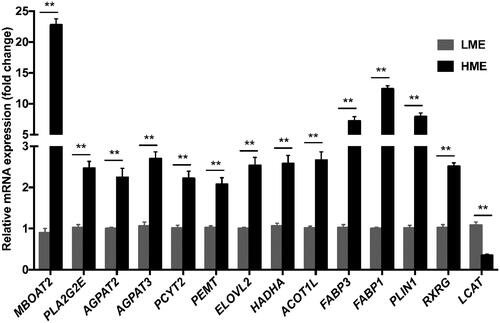
Figure 4. Correlation analysis of the relative expression levels for Log2 Fold Change (FC) of 14 DEG between the RNA-seq and q-PCR.
Discussion
In the current study, the chickens fed the HME diet significantly showed higher final BW and ADG and lower feed/gain ratio than those fed the LME diet. Similar to a previous study (Abouelezz et al. Citation2019; El-Senousey et al. Citation2019) and other studies (Wang et al. Citation2016; Maliwan et al. Citation2018), the BW, ADG, and feed efficiency increased significantly after increasing the dietary energy concentration.
Fatty liver diseases, which are common metabolic diseases in birds, can reduce production efficiency and even cause mortality. To decrease the incidence rate of fatty liver and reduce its adverse effects, several chicken models of fatty liver disease are used. Diets with low protein and high energy are considered to be a natural cause of fatty liver in laying hens (Rozenboim et al. Citation2016). Additionally, dietary deficiency of choline, phospholipids or vitamins can result in fatty liver (Whitehead and Randall Citation1982; Zhang et al. Citation2018). In the present study, a high-energy diet with decreased content of fibre was used to feed the Huxu chickens from 90 d to 135 d of age. This diet resulted in over-accumulation of lipid in the liver and increased TG and TCH contents in plasma, the relative weight of the liver also increased, and this is consistent with previous reports (Liu et al. Citation2016; Desert et al. Citation2018; Zhang et al. Citation2018). TG concentration in blood is usually considered to be an important index for understanding liver health (Lu et al. Citation2013) and TG levels in the plasma and liver status/health are significantly correlated in poultry (Abdulkarimi et al. Citation2016). Therefore, the present results indicate the successful development of a model of the fatty liver using Huxu chickens.
A high-energy diet is a predisposing factor for the occurrence of metabolic disorders in chickens. Laying hens fed high energy were at high risk for developing fatty liver (Feng et al. Citation2021). Rozenboim et al. (Citation2016) reported that diets with high energy or low protein alone had no significant effects on liver fat content or haemorrhagic score, whereas the combination of low protein and higher energy diets can induce fatty liver. Although these authors suggested that high metabolic energy was the natural pathological cause of inducing fatty liver, they claimed that the high metabolic energy was attributed to lower protein content. In the present study, it was clear that the high-energy diet with decreased content of fibre and unchanged protein level induced fatty liver.
Fatty liver is associated with numerous changes in the lipid metabolism of the liver (Adams et al. Citation2005). Based on previous reports, the pool of lipids stored in the liver mainly includes dietary lipids, lipolysis of adipose tissue and de novo lipogenesis (Roden Citation2006). The liver, the main organ of avian metabolism, is sensitive to nutritional modification (Zaefarian et al. Citation2019). Whole-genome RNA-seq strategy was used here to provide a comprehensive transcriptomic profile of the liver of chickens with fatty liver. The results of cluster analysis and q-PCR supported the accuracy of the RNA-seq. GO and KEGG analyses based on 480 known DEG were performed, and 62 DEG related to lipid metabolism were further screened, including ELOVL2, RXRG and FABP3 (Cui et al. Citation2018; Gou et al. Citation2020). Among the enriched pathways, classical pathways related to lipid metabolism (PPAR, fatty acid elongation and glycerophospholipid metabolism) were screened, and four representative DEG related to lipid metabolism (FABP3, FABP1, PLIN1, and RXRG) were enriched and identified in the PPAR pathway. Considering the importance of the PPAR pathway and the genes related to lipid metabolism (Grimaldi et al. Citation2010; Desert et al. Citation2018; Zhang et al. Citation2018; Tan et al. Citation2021), it was shown that the HME diet accelerated fat deposition in the liver which might be associated with the changed expression of related genes through the PPAR pathway in the liver of chicken. The change of FABP1 gene expression was also observed in a previous study that induced fatty liver using a high-fat diet (Zhang et al. Citation2018). This consistent change suggested that PPAR signalling pathway may be common to different models of fatty liver. Fatty acid elongation and Glycerophospholipid metabolism may also play an important role in the development of fatty liver in chickens although genes in this pathway were changed in different models (Tan et al. Citation2021). In the present study, these findings support the assertion that the Cytokine-cytokine receptor interaction pathway is also involved in fatty liver regulation with high energy diet; this was similar to findings of a previous study in the intramuscular preadipocytes (Guo et al. Citation2018) and abdominal fat (Cui et al. Citation2018). In addition, several amino acid metabolism-related pathways were also enriched in the liver; this may be closely related to the feed intake of chickens. Mohammed and Maged (Citation2021) reported that heat stress-induced reduction in feed intake is associated with amino acid metabolism in chickens. Yin et al. (Citation2017) reported that lysine restriction affects feed intake and amino acid metabolism in the gut of piglets. The DEGs identified in the present experiment were mostly different from those in other models of fatty liver (Zhang et al. Citation2018; Tan et al. Citation2020; Citation2021), indicating that biomarkers of fatty liver disease might vary among chickens with different genetic background and nutritional conditions.
Conclusions
In conclusion, this study has established a chicken model of fatty liver by use of a high-energy diet without changing protein levels. It also provided a comprehensive profile of hepatic gene expression in chickens with induced fatty liver and highlighted significant changes in amino acid metabolism, and lipid metabolism, in terms of glycerophospholipid metabolism, fatty acid elongation, and PPAR signalling pathway.
Ethical approval
This study was approved by the Animal Care and Use Committee of Guangdong Academy of Agriculture Science, with the approval number (GAASIAS-2018-024).
Supplemental Material
Download MS Excel (21.7 KB)Supplemental Material
Download MS Excel (60.2 KB)Supplemental Material
Download MS Excel (146.7 KB)Supplemental Material
Download MS Word (20.8 KB)Supplemental Material
Download MS Word (17.6 KB)Acknowledgments
The authors sincerely thank W. Bruce Currie (Emeritus Professor, Cornell University, Ithaca, NY) for his help in presentation of this manuscript.
Disclosure statement
The authors disclose that there is no conflict of interest.
Correction Statement
This article has been republished with minor changes. These changes do not impact the academic content of the article.
Additional information
Funding
Related Research Data
References
- Abdulkarimi R, Daneshyar M, Aghazadeh A. 2016. Thyme (Thymus vulgaris) extract consumption darkens liver, lowers blood cholesterol, proportional liver and abdominal fat weights in broiler chickens. Ital J Anim Sci. 10(2):101–105.
- Abouelezz K, Wang Y, Wang W, Lin X, Li L, Gou Z, Fan Q, Jiang S. 2019. Impacts of graded levels of metabolizable energy on growth performance and carcass characteristics of slow-growing yellow-feathered male chickens. Animals. 9(7):461.
- Adams LA, Lymp JF, Sauver JS, Sanderson SO, Lindor KD, Feldstein A, Angulo P. 2005. The natural history of nonalcoholic fatty liver disease: a population-based cohort study. Gastroenterology. 129(1):113–121.
- Cisa-Wieczorek S, Hernández-Alvarez M. 2020. Deregulation of lipid homeostasis: a fa(c)t in the development of metabolic diseases metabolic diseases. Cells. 9(12):2605.
- Cui X, Gou Z, Jiang Z, Li L, Lin X, Fan Q, Wang Y, Jiang S. 2022. Dietary fiber modulates abdominal fat deposition associated with cecal microbiota and metabolites in yellow chickens. Poult Sci. 101(4):101721.
- Cui X, Cui H, Liu L, Zhao G, Liu R, Li Q, Zheng M, Wen J. 2018. Decreased testosterone levels after caponization leads to abdominal fat deposition in chickens. BMC Genom. 19(1):344.
- Cui X, Gou Z, Fan Q, Li L, Lin X, Wang Y, Jiang S, Jiang Z. 2019. Effects of dietary perilla seed oil supplementation on lipid metabolism, meat quality, and fatty acid profiles in yellow-feathered chickens. Poult Sci. 98(11):5714–5723.
- Desert C, Baéza E, Aite M, Boutin M, Cam AL, Montfort J, Houee-Bigot M, Blum Y, Roux PF, Hennequet-Antier C. 2018. Multi-tissue transcriptomic study reveals the main role of liver in the chicken adaptive response to a switch in dietary energy source through the transcriptional regulation of lipogenesis. BMC Genom. 19(1):187.
- El-Senousey H, Wang W, Wang Y, Fan Q, Fouad A, Lin X, Gou Z, Li L, Jiang S. 2019. Dietary metabolizable energy responses in yellow-feathered broiler chickens from 29 to 56 D. J Appl Poult Res. 28(4):974–981.
- Feng Y, Li YL, Jiang DW, Hu Y, Jia YM, Zhao RQ. 2021. GR-mediated transcriptional regulation of m6A metabolic genes contributes to diet-induced fatty liver in hens. J Anim Sci Biotechno. 12(1):117.
- Gou Z, Cui X, Li L, Fan Q, Lin X, Wang Y, Jiang Z, Jiang S. 2020. Effects of dietary incorporation of linseed oil with soybean isoflavone on fatty acid profiles and lipid metabolism-related gene expression in breast muscle of chickens. Animal. 14(11):2414–2422.
- Grimaldi B, Bellet MM, Katada S, Astarita G, Hirayama J, Amin RH, Granneman JG, Piomelli D, Leff T, Sassone-Corsi P. 2010. PER2 controls lipid metabolism by direct regulation of PPARgamma. Cell Metab. 12(5):509–520.
- Gruben N, Shiri-Sverdlov R, Koonen D, Hofker MH. 2014. Nonalcoholic fatty liver disease: a main driver of insulin resistance or a dangerous liaison? Biochim Biophys Acta. 1842(11):2329–2343.
- Guo L, Cui H, Zhao G, Liu R, Li Q, Zheng M, Guo Y, Wen J. 2018. Intramuscular preadipocytes impede differentiation and promote lipid deposition of muscle satellite cells in chickens. BMC Genom. 19(1):838.
- Maliwan P, Khempaka S, Molee W, Schonewille J. 2018. Effect of energy density of diet on growth performance of Thai indigenous (50% crossbred) Korat chickens from hatch to 42 days of age. Trop Anim Health Prod. 50(8):1835–1841.
- Mohammed MQ, Maged AA. 2021. Protein and amino acid metabolism in poultry during and after heat stress: a review. Animals. 11(1):1167.
- Liu Z, Li Q, Liu R, Zhao G, Zhang Y, Zheng M, Cui H, Li P, Cui X, Liu J, et al. 2016. Expression and methylation of microsomal triglyceride transfer protein and acetyl-CoA carboxylase are associated with fatty liver syndrome in chicken. Poult Sci. 95(6):1387–1395.
- Livak KJ, Schmittgen TD. 2001. Analysis of relative gene expression data using real-time quantitative PCR and the 2(-Delta Delta C(T)) method. Methods. 25(4):402–408.
- Love MI, Huber W, Anders S. 2014. Moderated estimation of fold change and dispersion for RNA-seq data with DESeq2. Genome Biol. 15(12):550.
- Lu KL, Xu WN, Li JY, Li XF, Huang GQ, Liu WB. 2013. Alterations of liver histology and blood biochemistry in blunt snout bream Megalobrama amblycephala fed high-fat diets. Fish Sci. 79(4):661–671.
- Roden M. 2006. Mechanisms of disease: hepatic steatosis in type 2 diabetes-pathogenesis and clinical relevance. Nat Clin Pract Endocrinol Metab. 2(6):335–348.
- Rozenboim I, Mahato J, Cohen NA, Tirosh O. 2016. Low protein and high-energy diet: a possible natural cause of fatty liver hemorrhagic syndrome in caged White Leghorn laying hens. Poult Sci. 95(3):612–621.
- Tan X, Liu R, Xing S, Zhang Y, Li Q, Zheng M, Zhao G, Wen J. 2020. Genome-wide detection of key genes and epigenetic markers for chicken fatty liver. IJMS. 21(5):1800.
- Tan X, Liu R, Zhang Y, Wang X, Wen J. 2021. Integrated analysis of the methylome and transcriptome of chickens with fatty liver hemorrhagic syndrome. BMC Genom. 22(1):8.
- Wang JP, Zhang ZF, Yan L, Kim IH. 2016. Effects of dietary supplementation of emulsifier and carbohydrase on the growth performance, serum cholesterol and breast meat fatty acids profile of broiler chickens. Anim Sci J. 87(2):250–256.
- Wang S, Chen Z, Lam V, Han J, Hassler J, Finck B, Davidson N, Kaufman R. 2012. IRE1α-XBP1s induces PDI expression to increase MTP activity for hepatic VLDL assembly and lipid homeostasis. Cell Metab. 16(4):473–486.
- Whitehead CC, Randall CJ. 1982. Interrelationships between biotin, choline and other B-vitamins and the occurrence of fatty liver and kidney syndrome and sudden death syndrome in broiler chickens. Br J Nutr. 48(1):177–184.
- Yin J, Han H, Li YY, Liu ZJ, Zhao YR, Fang RJ, Huang XG, Zheng J, Ren WK, Wu F, et al. 2017. Lysine restriction affects feed intake and amino acid metabolism via gut microbiome in piglets. Cell Physiol Biochem. 44(5):1749–1761.
- Zaefarian F, Abdollahi MR, Cowieson A, Ravindran V. 2019. Avian liver: the forgotten organ. Animals. 9(2):63.
- Zhang YH, Liu Z, Liu J, Wang J, Zheng MQ, Li QH, Cui HX, Zhao GP, Wen J. 2018. Alteration of hepatic gene expression along with the inherited phenotype of acquired fatty liver in chicken. Genes. 9(4):199.