
 ?Mathematical formulae have been encoded as MathML and are displayed in this HTML version using MathJax in order to improve their display. Uncheck the box to turn MathJax off. This feature requires Javascript. Click on a formula to zoom.
Abstract
The Anglo-Arabian horse breed (AA) is the result of crossing between Thoroughbred and Arabian horses renowned for versatility in show-jumping and racing. Southwest France and Sardinia in Italy are considered the historical nucleus of European AA breeding. Since little is known on genetic variability in the AA breed, especially those bred in the Sardinia region, this study investigates: i) inbreeding levels via pedigree and SNP genotyping; ii) runs of homozygosity (ROH) and selection signatures; iii) effective population size; and iv) distinctiveness of AA compared to Arabian and Thoroughbred horses. The ROH revealed an excessive amount of homozygosity, with a high kurtosis value observed in several chromosomes and an average inbreeding based on ROH of 21.1%. This latter value is higher compared to what was found based on pedigree data, highlighting the importance of complete pedigree records when estimating inbreeding based on genealogical data. The genomic inbreeding in AA horses was higher compared to other Italian horse breeds but lower than what was found in pure Thoroughbred and Arabian horses. This result suggests that the selection process for AA horses, may have prioritised racing ability over breed preservation which is the main goal in most local Italian breeds. The reduction in effective population size found in the latest 20 generations corroborates the potential presence of genetic diversity reduction due to selection in the AA breed. Remarkably, a large ROH island was identified on ECA17, which overlapped with two QTLs associated with racing performance.
HIGHLIGHTS
Genetic analysis reveals moderate inbreeding (FROH = 21.1%) in Anglo-Arabian horses, impacting their genetic diversity compared to other Italian breeds.
Identification of ROH islands linked to selection for height and racing performance highlights breeding priorities in the Anglo-Arabian breed.
Effective population size decline (Ne = 59) over generations signifies a genetic bottleneck in Anglo-Arabian horses.
1. Introduction
The Anglo-Arabian horse breed, AA, is the result of crossing between Thoroughbred and Arabian horses with different percentages of the two breeds. The modern AA is common in many European countries as a versatile horse both for showjumping and racing, with the two main nuclei reared in France and Italy, with about 28,000 and 9,000 horses officially recorded in the respective stud-books (DAD-IS Citation2023; Vetinfo Citation2023). Some particular areas could be considered the cradles of European AA, as South West of France and Sardinia, an insular region of Italy (DAD-IS Citation2023). In Sardinia the long tradition of horse breeding was deeply influenced since the age of Spanish domination, i.e. the XV century, firstly by the importation of stallions of Arabian origins, and later Thoroughbred, to improve size and performance of the local mares’ population and create the strain also known as Sardinian Anglo-Arabian horse (Cardinali et al. Citation2016; Giontella et al. Citation2020a). Horse breeding in Sardinia is even now a successful sector of Italian livestock production and a total of 18,000 horses are nowadays reared in the region (Vetinfo Citation2023).
Study carried on Italian horse breeds through mitochondrial DNA (mtDNA; Morelli et al. Citation2014; Cardinali et al. Citation2016), evidenced that signs of genetic differentiation were shared among the AA and two other semi-feral populations of Sardinia, namely the Giara and Sarcidano, which separate from the other Italian breeds based on mtDNA haplogroup profiles. The authors suggested that a plausible cause of the latter finding might be the geographic isolation. The genetic variability of the AA was recently investigated by means of pedigree data (Giontella et al. Citation2020b) however, it is known that pedigree-based estimates are likely to underestimate actual inbreeding coefficients (Ablondi et al. Citation2022). Therefore, thanks to the availability of recent genotyping techniques we are now able to deepen the study of genetic variability based on the exploration of single-nucleotide polymorphisms (SNPs) (Ramesh et al. Citation2020).
To the best of the author knowledge, there is still a lack of studies using medium density SNPs genotyping to evaluate the genetic variability of AA and compare with other horse breeds. Hence, the aim of this study was to explore in the AA horses: i) the inbreeding level based on pedigree and medium density SNPs genotype analysis; ii) the runs of homozygosity (ROH) detection and signatures of selection; iii) the effective population size; and iv) the distinctiveness from Arabian and Thoroughbred horses. The above-mentioned analyses will ensure a comprehensive characterisation of the AA breed specifically bred for racing performance in Sardinia to evaluate the level of genetic diversity and the presence of signatures of selection in the Italian AA reservoir.
2. Materials and methods
2.1. Animals, samples, pedigree information and genotyping
The procedures reported in the present study were approved by the Ethical Animal Care and Experimental Use Committee (Organismo Preposto al Benessere e alla Sperimentazione Animale, OPBSA) at the University of Sassari (protocol number 0122891, approved on 28 September 2021). The sampled population was made up of 180 racehorses, 72 males and 108 females, from 119 different studs located in the regional territory of Sardinia, Italy. All the horses were recorded in the official studbook of the Anglo-Arabian breed. Individual blood samples were collected from the jugular vein using vacuum tubes containing K3EDTA (Vacutest Kima, Azergrande, PD, Italy) by private and official veterinarians for clinical purposes not linked to the present trial. The DNA was extracted using a commercial kit (Gentra Puregene Blood Kit, QUIAGEN, Venlo, The Netherlands) in accordance with the manufacturer’s instructions.
The 180 sampled horses were representative of: i) different breeding lines (e.g. percentage of Arabian blood ranging from 25% to 75%), ii) different generations (presence of horses born between 1987 to 2013) and iii) different competition levels in terms of distance and ranking position. The horses’ pedigree was achieved at the freely accessible databank hold by the Italian horse breeders’ association (online at http://www.unire.gov.it/index.php/ita/Operatori/Bancadati, last accession on January 10th 2017). A total of 970 ancestors (615 mares and 355 stallions) were recorded, in addition to birth date and sex identification.
The pedigree data was used to calculate the pedigree-based inbreeding coefficient (FPED) which was defined as the probability of an individual presenting two identical alleles by descent (Wright Citation1978) in the Endog 4.0 software (Gutierrez and Goyache Citation2005). To ensure a sufficient pedigree depth, the complete generation equivalent (CGE) was calculated and animals with a CGE lower or equal than two were discarded when calculating the correlation with runs of homozygosity (FROH) inbreeding coefficients. The comparisons between the two different inbreeding coefficients were made through the estimation of Pearson’s correlation. All samples were genotyped with the EQUINE80Select BeadChip (Illumina, San Diego, CA, USA), containing 81,974 SNPs. Only SNPs located on the 31 Equus caballus autosomes (ECA) chromosomes were retrieved and used in this study. The quality control (QC) was performed in PLINK v1.9 (Purcell et al. Citation2007) by removing SNPs with a call rate lower than 0.90, a Hardy–Weinberg equilibrium (HWE) deviation with p < 10 − 6 and minor allele frequencies (MAF) <0.01. Horses with a call rate lower than 0.90 were excluded.
2.2. Runs of homozygosity
The runs of homozygosity (ROH) segments were detected using the DetectRUNS (Biscarini et al. Citation2019) package in R (R Development Core Team Citation2011), and defined as follows: (i) at least 15 SNPs in a run, (ii) a minimum length of a run equal to 500 kb, (iii) a maximum distance between consecutive SNPs in a window 1000 kb, (iv) a lower density limit of 1 SNP per 100 kb and (v) allowing for a maximum of one missing and one heterozygous SNP in a run (Ablondi et al. Citation2020). The ROH segments were divided into the following six length classes: 0.5–1 Mbp, 1–2 Mbp, 2–4 Mbp, 4–8 Mbp, 8–16 Mbp and over 16 Mbp. The total number of ROHs (NROH), average length of ROHs (LROH) and the average ROH number per horse (SROH) were summarised according to each ROH length category. The genomic inbreeding coefficients (FROH) were calculated as follow:
with LROH being the sum of the length of ROHs in each individual and LAUTO being the length of the autosomal genome covered by SNPs, which was set to 2,365 Mb. Based on the hypothesis that the length of ROH reflects the chronological time points when inbreeding happened, the genomic inbreeding was expressed separately for the six above mentioned classes. The inbreeding was also calculated per chromosome, and the type of distribution was evaluated based on skewness and kurtosis. Differences in inbreeding were also calculated per birth year classes (, sex, percentage of Arabian blood and success rate as defined in Pira et al. (Citation2021).
2.3. Signatures of selection
Putative ROH islands were determined based on overlapping homozygous regions within more than 70% of the horses. The EquCab3 genomic coordinates of these regions were used to evaluate the presence of overlapping quantitative trait loci (QTL) regions previously identified and reported in the Horse QTL database (Hu et al. Citation2022).
2.4. Effective population size
Past and present effective population sizes (Ne) were estimated using the SNeP v.1.1 software (Barbato et al. Citation2015) based on genotype data. The SNeP v.1.1 software estimates the trends of the historical Ne from SNP data based on linkage disequilibrium (LD). The recombination rate was calculated using the Sved and Feldman’s mutation rate modifier (Sved and Feldman Citation1973), and sample size correction was made for unphased genotypes. The cM unit in this study was set to 1.24 Mbp based on a recent study where the recombination rate was evaluated in horses (Beeson et al. Citation2019). The minimum and maximum distance between pairs of SNPs was set to 0.5 Mbp and 26 Mbp, respectively to allow for the estimation of Ne in the latest generations.
2.5. Comparison with Arabian and Thoroughbred horses
To evaluate the potential distinctiveness of AA horses, publicly available data from Arabian (ARR) and Thoroughbred (TB) horses were retrieved from a previous study (Petersen et al. Citation2013a). The Principal Component Analysis (PCA) and Discriminant Analysis of Principal Components (DAPC) were used to evaluate differences among those three breeds. The PCA workflow involved the following steps: (i) Pairwise genomic distances between the horses were calculated using PLINK (v1.9) (Purcell et al. Citation2007); (ii) The genomic kinship coefficients were used in the PCA analysis in R; (iii) The proportion of variance explained by each PC was determined, and the two PC explaining the highest proportion of variance were plotted in R.
To further evaluate the distance among AA, ARR and TB, we performed a DAPC using the adegenet package in R (Jombart Citation2008). The number of principal components (PCs) to retain in the discriminant step of the DAPC was optimised through cross-validation. The dataset was divided into a training set (90% of the data) and a validation set (10% of the data) using stratified random sampling. The optimal number of PCs was selected based on the mean successful assignment of the predefined groups (AA, ARR and TB) and the lowest root mean squared errors.
3. Results and discussion
3.1. Inbreeding calculation
A total of 169 horses passed the QC with 68,887 informative SNPs and a genotyping call rate of 99.0%. The CGE was on average equal to 2.07 highlighting a moderate pedigree depth compared to other Italian horse breeds (Ablondi et al. Citation2018; Giontella et al. Citation2019; Mancin et al. Citation2020). As a result, also the average inbreeding based on pedigree was considerably low and equal to 0.7% which might be due to the low number of known generations and not reflect the actual genetic variability in the breed.
The average inbreeding coefficient was compared among the different generations available in the study, however, no differences were observed (data not shown). When considering only animals with FPED above 0, the average value increased to 3.0% (SD = 0.02) which is still lower than what found in most of Italian local breeds based on pedigree data (Ablondi et al. Citation2018; Giontella et al. Citation2019; Mancin et al. Citation2020).
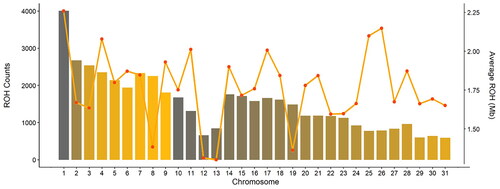
Based on genotyped data, a total of 47,131 ROHs were found among the 169 AA horses that passed the QC. The number of ROHs and length of ROH segments varied across chromosomes, as shown in Figure . The highest number of ROHs was identified on ECA1 (4005), while the lowest was identified on ECA31, with 594 ROHs detected. Nevertheless, when normalising for the chromosome length, the highest portion was found on ECA28. The highest chromosome length covered by ROH was detected on ECA1, with on average 2.25 Mbp covered by ROHs, followed by ECA26 (2.15 Mbp) and ECA25 (2.09 Mbp).
Figure 1. Number of runs of homozygosity (ROH) and average length in Mb across the 31 horse autosomes.
To differentiate ancient and recent inbreeding, we calculated FROH based upon six ROH length classes, as presented in Table .
Table 1. Inbreeding divided based on runs of homozygosity (ROH) length classes to differentiate ancient and recent inbreeding.
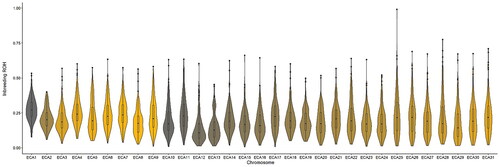
The inbreeding calculated per chromosome showed large variation among chromosomes both in terms of average values and the distribution of inbreeding level per individual (Figure ). The highest average inbreeding was found in ECA1 (mean = 0.28 ± 0.08 SD) and the lowest on ECA13 (0.15 ± 0.09 SD). For ECA3, ECA8, ECA10, ECA13, ECA14, ECA15, ECA16, ECA18, and ECA28, a highly skewed distribution towards higher values was found (i.e. a distribution skewness above one). A kurtosis value above three was used to investigate the presence of outlier individuals per each chromosome. In total, 21 out of the 31 chromosomes showed a kurtosis higher than three, highlighting the presence of some horses exhibiting an excess of homozygosity.
Figure 2. Violin plots showing inbreeding based on runs of homozygosity (ROH) across the 31 horse autosomes.
The FROH calculated in the AA was much higher compared to what calculated on pedigree data and it averaged to 21.1% (SD = 0.03). The average FROH in the AA is higher compared to what found in several Italian local breeds such as the Bardigiano breed (17.0%) (Ablondi et al. Citation2020), the Italian Heavy Draught breed (15.4%) (Mancin et al. Citation2020) and the Purosangue Orientale Siciliano, Sanfratellano and Siciliano, which represent the Sicilian equine genetic resource (13.0%, 9.0% and 7.0%) (Criscione et al. Citation2022). This result highlights that selection for racing ability might have caused a deeper reduction in genetic variability in the AA compared to Italian local breeds where there is more emphasis on preservation rather than selection. However, it is important to mention that different breeding strategies as well as evolutionary forces can lead to similar outcomes. Beyond selection pressure, factors such as limited population size itself can facilitate genetic drift, especially in sub-populations. Nevertheless, since we found ROH islands in regions where known QTLs for conformation and racing performance are located, we believe that selection pressure might have played a role in the reduction of variability in the breed. When comparing the average FROH in the AA to a more international context, those values are slightly lower than what found in the Thoroughbred (Hill et al. Citation2023) and in the range of what found in the Arabian horses (Druml et al. Citation2018; Criscione et al. Citation2022). It is important to realise that the AA horses sampled in the current study represent the AA type for racing, and possibly the outcome would have been different for AA bred for showjumping, whose are obtained following different cross mating.
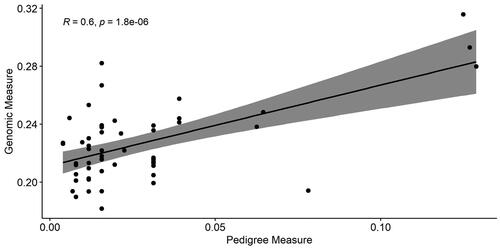
Although the magnitude of inbreeding based on FPED and FROH was considerably different, the Pearson correlation between the two methods was moderate and positive (0.60, P-val < 0.001), which is in line with previous studies both in horses (Sadeghi et al. Citation2019; Velie et al. Citation2019) and other livestock species (Schiavo et al. Citation2020; Ablondi et al. Citation2021) (Figure ). Further analysis involved categorising animals based on low (<0.03) and high (≥0.03) levels of genealogical relatedness, revealing a strong positive correlation (0.76, P-val < 0.001) among animals exhibiting high genealogical relatedness (Supplementary figure 1). In previous studies based on mtDNA genotyping, it was clearly evidenced that horse breeds from Sardinia are separated from other Italian ones (Cardinali et al. Citation2016) and, in particular, AA could be affected by a bottleneck effect and genetic drift (Giontella et al. Citation2020b).
Figure 3. Correlation between inbreeding based on genotype and pedigree data.
No statistically significant differences were found in FROH considering the following factors: birth year classes (1987-2000 and 2001-2012), sex (female and male), Arabian blood in four percentile and success rate in two classes defined as in a previous study (Pira et al. Citation2021).
3.2. Signatures of selection
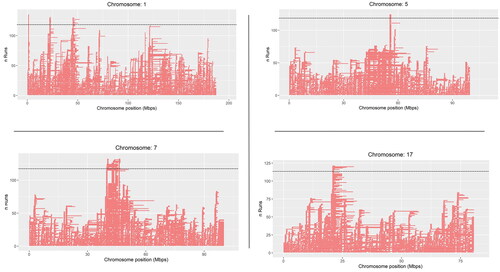
A total of four chromosomes (ECA1, ECA5, ECA7, and ECA17) contained ROH islands that were shared by more than 70% of the horses. Three ROH islands were detected on ECA1, one on ECA5, six on ECA7, and one on ECA17 as shown in Figure .
Figure 4. Runs of homozygosity (ROH) islands on ECA1, ECA5, ECA7 and ECA17 in the Anglo Arabian (AA) horse breed. The x-axis represents the chromosome position in Mb and the y-axis represents the number of horses showing an ROH in each chromosome position. A dotted line shows significance level which was set as over 70% of the horses showing a ROH in a specific position.
Overall, a total of eight known QTLs were located within the ROH islands in the AA as shown in Table . Two out of the three ROH islands located on ECA1 overlapped with known QTLs for height at withers (Skujina et al. Citation2018) highlighting that selection for higher horses might have taken place in the AA breed. This hypothesis is supported by the study of Giontella et al. (Citation2020a), who analysed body measures of AA horses from the ’60 to present and found that the introduction of Thoroughbred stallions led to larger horses’ size.
Table 2. Runs of homozygosity (ROH) islands shared in over 70% of the Anglo Arabian (AA) horses, with genomic coordinates and a list of known QTLs located within each ROH island.
As regard the ROH island found on ECA7, some authors have reported a QTL hypothetically involved in promoting pathological changes of the equine navicular bone, given that some breeds and populations are more susceptible (Frątczak et al. Citation2017).
Interestingly, a ROH island of 0.69 Mbp was found on ECA17 where two QTLs for racing performance are located (Velie et al. Citation2018). In a previous study, based on Genome Wide Association study (GWAS), a SNP was found to be associated with best time in Norwegian-Swedish Coldblooded Trotter. This SNP was located within the ATP7B gene on ECA17 (Velie et al. Citation2018), where the AA showed a signature of selection. The ATP7B gene encodes a protein whose main task is to take out copper out of cells. It is known that elevated levels of copper in the body can cause muscle stiffness and this condition prior to a race might negatively affect individual performance. Moreover, chronic muscle stiffness might harmfully impact the horse’s conditioning, trainability, and overall capacity for speed (Concilli et al. Citation2016). We, therefore, cannot rule out the hypothesis that this region might be under selection pressure in AA for the favourable allele that cause a proper removal of copper out of the cells. In addition, two other SNPs located within the ROH island in the AA, were found to be suggestively associated with best time in Norwegian-Swedish Coldblooded Trotter which overlapped with the KCNRG gene (Velie et al. Citation2018). The KCNRG gene encodes a protein which regulates the activity of voltage-gated potassium channels which seems to play a role in learning (Lovell et al. Citation2013). Finally, while there have been no prior studies directly linking KCNRG to racing success in racehorses, a significant conserved haplotype overlapped this region has been suggested to hold particular significance in Thoroughbreds and closely related horse breeds (Gu et al. Citation2009; Petersen et al. Citation2013b).
3.3. Effective population size
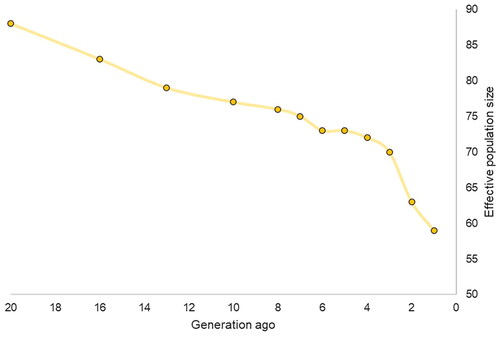
The Ne declined over time and was estimated to be roughly 59 horses one generation ago (Figure ). Instead, the estimated Ne 20 generations ago was around 88 horses, therefore a reduction of 33% was found in the breed. Although a reduction was observed in the AA, it was not as substantial as what found in the seven major Italian breeds based on consistency as shown in a recent study (Capomaccio et al. Citation2023) where the reduction was in most breeds over 50% in the last 20 years.
Figure 5. Effective population size (Ne) based on linkage disequilibrium (LD) in a 20 generations time-period in the Anglo Arabian (AA) breed.
3.4. Comparison with Arabian horses and Thoroughbred from UK and US
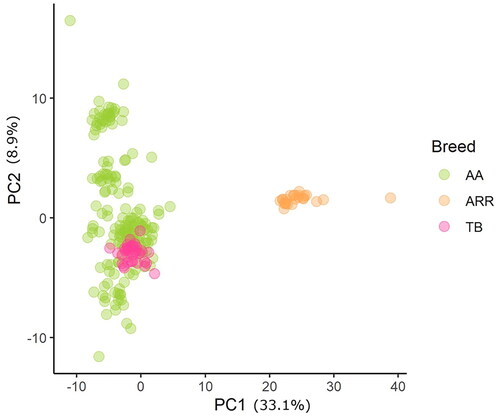
The pooled datasets contained 33,173 SNPs and counted 230 horses which were used (169 AA, 23 ARR and 35 TB) to evaluate differences among those three breeds. The first two PCs explained over 40% of the total variations and were able to fully discriminate AA from ARR. In contrast, the TB, although all clustered together they overlapped with AA horses which were spread along the second PC as shown in Figure .
Figure 6. Principal Component analysis and breeds differentiation. AA means Anglo Arabian horses, ARR Arabian and TB thoroughbred.
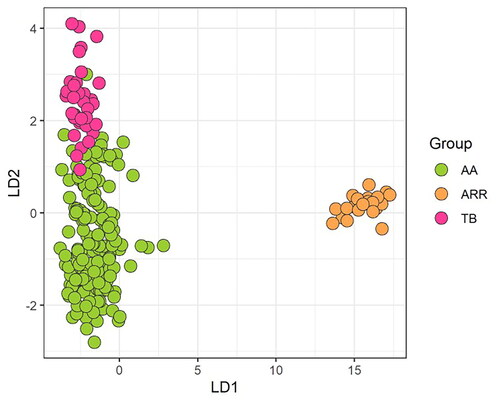
The divergence between AA and ARR was further supported by the DAPC plot (Figure ) whereas the ASS and TB seems to be closely related. The cross-validation test for the number of PCs to retain, showed the highest proportion of the successful assignment to the given breed and lowest root mean squared errors for 10 PCs. The results obtained from the DAPC supported those obtained from PCA, with most (97.4%) of the horses correctly assigned to their predefined breeds although similarities were present between AA and TB even if they did not fully overlap as previously shown based on PCA. The dissimilarity between AA and ARR might be due to the available Arabian sample that was taken from the United States and may not reflect the Arabian lineages that were influential in the AA breed.
Figure 7. Discriminant Analysis of Principal Components plot of linear discriminant function 1 (LD1) and linear discriminant function 2 (LD2). AA means Anglo Arabian horses, ARR Arabian and TB thoroughbred.
4. Conclusion
In the present study, using an 80K SNPs genotyping beadchip, we have deepened the knowledge about genetic structure of the Anglo-Arabian horses reared in Italy. The analysis of runs of homozygosity showed an excess of homozygosity, with a high value of kurtosis in many chromosomes. A large ROH island was found on ECA17, just close to a segment where two QTLs related to racing performance have been reported in the literature. The genomic inbreeding coefficients calculated on genotyping data evidenced that the average inbreeding was much higher compared to what calculated based on pedigree, highlighting the importance of pedigree completeness. Despite the limitation of pedigree data quality, it is important to establish a base point for genetic analysis. Additionally, when carefully interpreted these data can serve as useful and easy-to-implement tools for controlling genetic parameters offering a starting point for further genetic investigations and management strategies. Genomic inbreeding was higher if compared to other Italian horse breeds, but lower than in pure Thoroughbred Arabian horses. We hypothesised that this result might be attributable to the selection aimed to racing ability rather than on breed preservation. Finally, we confirm the importance and potential of using modern genotyping assays to fully investigate the genetic diversity of animals, and in particular the Anglo-Arabian horse, a breed with peculiar characteristics.
Supplemental Material
Download MS Word (61.2 KB)Acknowledgments
This work has the contribution of a researcher (MA) which is employed with a research contract co-founded by the European Union - PON Ricerca e Innovazione 2014-2020 ai sensi dell’art. 24, comma 3, lett. a), della Legge 30 dicembre 2010, n. 240 e s.m.i. e del D.M. 10 agosto 2021 n. 1062. This research was granted by University of Parma through the action Bando di Ateneo 2022 per la ricerca co-funded by MUR-Italian Ministry of Universities and Research - D.M. 737/2022 – PNR – PNRR – NextGenerationEU.
Disclosure statement
The authors declare that the research was conducted in the absence of any commercial or financial relationships that could be construed as a potential conflict of interest. The authors thank breeders and owners for joining the study, and veterinarians for sample collection.
Data availability statement
The data that support the findings of this study are available from the corresponding author, [author initials], upon reasonable request.
References
- Ablondi M, Dadousis C, Vasini M, Eriksson S, Mikko S, Sabbioni A. 2020. Genetic diversity and signatures of selection in a native Italian horse breed based on SNP data. Animals (Basel). 10(6):1005. doi:10.3390/ani10061005.
- Ablondi M, Sabbioni A, Stocco G, Cipolat-Gotet C, Dadousis C, van Kaam JT, Finocchiaro R, Summer A. 2022. Genetic diversity in the Italian Holstein dairy cattle based on pedigree and SNP data prior and after genomic selection. Front Vet Sci. 8:773985. doi:10.3389/fvets.2021.773985.
- Ablondi M, Vasini M, Beretti V, Superchi P, Sabbioni A. 2018. Exploring genetic diversity in an Italian horse native breed to develop strategies for preservation and management. J Anim Breed Genet. 135(6):450–459. doi:10.1111/jbg.12357.
- Barbato M, Orozco-terWengel P, Tapio M, Bruford MW. 2015. SNeP: a tool to estimate trends in recent effective population size trajectories using genome-wide SNP data. Front Genet. 6:109. http://www.frontiersin.org/Livestock_Genomics/10.3389/fgene.2015.00109/abstract. doi:10.3389/fgene.2015.00109.
- Beeson SK, Mickelson JR, McCue ME. 2019. Exploration of fine-scale recombination rate variation in the domestic horse. Genome Res. 29(10):1744–1752. doi:10.1101/gr.243311.118.
- Biscarini F, Cozzi P, Gaspa G, Marras G. 2019. detectRUNS: an R package to detect runs of homozygosity and heterozygosity in diploid genomes. https://cran.r-project.org/web/packages/detectRUNS/vignettes/detectRUNS.vignette.html#references
- Capomaccio S, Ablondi M, Colombi D, Sartori C, Giontella A, Cappelli K, Mancin E, Asti V, Mantovani R, Sabbioni A, et al. 2023. Exploring the Italian equine gene pool via high-throughput genotyping. Front Genet. 14:1099896. doi:10.3389/fgene.2023.1099896.
- Cardinali I, Lancioni H, Giontella A, Capodiferro MR, Capomaccio S, Buttazzoni L, Biggio GP, Cherchi R, Albertini E, Olivieri A, et al. 2016. An overview of ten Italian horse breeds through mitochondrial DNA. PLoS One. 11(4):e0153004. doi:10.1371/journal.pone.0153004.
- Concilli M, Iacobacci S, Chesi G, Carissimo A, Polishchuk R. 2016. A systems biology approach reveals new endoplasmic reticulum-associated targets for the correction of the ATP7B mutant causing Wilson disease. Metallomics. 8(9):920–930. doi:10.1039/C6MT00148C.
- Criscione A, Mastrangelo S, D'Alessandro E, Tumino S, Di Gerlando R, Zumbo A, Marletta D, Bordonaro S. 2022. Genome‐wide survey on three local horse populations with a focus on runs of homozygosity pattern. J Anim Breed Genet. 139(5):540–555. doi:10.1111/jbg.12680.
- DAD-IS. 2023. Domestic animal diversity information system. FAO, Food and Agriculture Organization of the United Nations; Statistical Database of the Food and Agriculture Organization of the United Nations [accessed 2023 June 8]. http://www.fao.org/dad-is/browse-by-country-and-species/en/.
- Druml T, Neuditschko M, Grilz-Seger G, Horna M, Ricard A, Mesaric M, Cotman M, Pausch H, Brem G. 2018. Population networks associated with runs of homozygosity reveal new insights into the breeding history of the haflinger horse. J Hered. 109(4):384–392. doi:10.1093/jhered/esx114.
- Frątczak M, Włodarek J, Frąckowiak H, Komosa M. 2017. Insight into the pathomorphology of the distal border of the equine navicular bone. Acta Vet Brno. 86(2):123–131. doi:10.2754/avb201786020123.
- Giontella A, Pieramati C, Silvestrelli M, Sarti FM. 2019. Analysis of founders and performance test effects on an autochthonous horse population through pedigree analysis: structure, genetic variability and inbreeding. Animal. 13(1):15–24. doi:10.1017/S1751731118001180.
- Giontella A, Sarti FM, Biggio GP, Giovannini S, Cherchi R, Pieramati C, Silvestrelli M. 2020a. Genetic parameters and inbreeding effect of morphological traits in Sardinian Anglo Arab horse. Animals. 10(5):791. doi:10.3390/ani10050791.
- Giontella A, Sarti FM, Cardinali I, Giovannini S, Cherchi R, Lancioni H, Silvestrelli M, Pieramati C. 2020b. Genetic variability and population structure in the Sardinian Anglo-Arab horse. Animals. 10(6):1018. doi:10.3390/ani10061018.
- Gu J, Orr N, Park SD, Katz LM, Sulimova G, MacHugh DE, Hill EW. 2009. A genome scan for positive selection in thoroughbred horses. PLoS One. 4(6):e5767. doi:10.1371/journal.pone.0005767.
- Gutiérrez JP, Goyache F. 2005. A note on ENDOG: a computer program for analysing pedigree information. J Anim Breed Genet. 122(3):172–176. doi:10.1111/j.1439-0388.2005.00512.x.
- Hill EW, McGivney BA, MacHugh DE. 2023. Inbreeding depression and durability in the North American Thoroughbred horse. Anim Genet. 54(3):408–411. doi:10.1111/age.13309.
- Hu Z-L, Park CA, Reecy JM. 2022. Bringing the Animal QTLdb and CorrDB into the future: meeting new challenges and providing updated services. Nucleic Acids Res. 50(D1):D956–D961. https://academic.oup.com/nar/article/50/D1/D956/6437998. doi:10.1093/nar/gkab1116.
- Jombart T. 2008. adegenet: a R package for the multivariate analysis of genetic markers. Bioinformatics. 24(11):1403–1405. doi:10.1093/bioinformatics/btn129.
- Lovell PV, Carleton JB, Mello CV. 2013. Genomics analysis of potassium channel genes in songbirds reveals molecular specializations of brain circuits for the maintenance and production of learned vocalizations. BMC Genomics. 14(1):470. doi:10.1186/1471-2164-14-470.
- Mancin E, Ablondi M, Mantovani R, Pigozzi G, Sabbioni A, Sartori C. 2020. Genetic variability in the Italian heavy draught horse from pedigree data and genomic information. Animals (Basel). 10(8):1310. doi:10.3390/ani10081310.
- Morelli L, Useli A, Sanna D, Barbato M, Contu D, Pala M, Cancedda M, Francalacci P. 2014. Mitochondrial DNA lineages of Italian Giara and Sarcidano horses. Genet Mol Res. 13(4):8241–8257. doi:10.4238/2014.October.20.1.
- Petersen JL, Mickelson JR, Cothran EG, Andersson LS, Axelsson J, Bailey E, Bannasch D, Binns MM, Borges AS, Brama P, et al. 2013a. Genetic diversity in the modern horse illustrated from genome-wide SNP data. H. Ellegren, editor. PLoS One. 8(1):e54997. doi:10.1371/journal.pone.0054997.
- Petersen JL, Mickelson JR, Rendahl AK, Valberg SJ, Andersson LS, Axelsson J, Bailey E, Bannasch D, Binns MM, Borges AS, et al. 2013b. Genome-wide analysis reveals selection for important traits in domestic horse breeds. PLoS Genet. 9(1):e1003211. doi:10.1371/journal.pgen.1003211.
- Pira E, Vacca GM, Dettori ML, Piras G, Moro M, Paschino P, Pazzola M. 2021. Polymorphisms at myostatin gene (MSTN) and the associations with sport performances in Anglo-Arabian racehorses. Animals (Basel). 11(4):964. doi:10.3390/ani11040964.
- Purcell S, Neale B, Todd-Brown K, Thomas L, Ferreira MARR, Bender D, Maller J, Sklar P, de Bakker PIWW, Daly MJ, et al. 2007. PLINK: a tool set for whole-genome association and population-based linkage analyses. Am J Hum Genet. 81(3):559–575. doi:10.1086/519795.
- R Development Core Team. 2011. R: a language and environment for statistical computing.
- Ramesh P, Mallikarjuna G, Sameena S, Kumar A, Gurulakshmi K, Reddy B, Reddy PCO, Sekhar AC. 2020. Advancements in molecular marker technologies and their applications in diversity studies. J Biosci. 45(1):123. doi:10.1007/s12038-020-00089-4.
- Sadeghi R, Moradi-Shahrbabak M, Ashtiani SRM, Schlamp F, Cosgrove EJ, Antczak DF. 2019. Genetic diversity of Persian Arabian horses and their relationship to other native Iranian horse breeds. J Hered. 110(2):173–182. doi:10.1093/jhered/esy061.
- Schiavo G, Bovo S, Bertolini F, Tinarelli S, Dall’Olio S, Nanni Costa L, Gallo M, Fontanesi L. 2020. Comparative evaluation of genomic inbreeding parameters in seven commercial and autochthonous pig breeds. Animal. 14(5):910–920. doi:10.1017/S175173111900332X.
- Skujina I, Winton CL, Hegarty MJ, McMahon R, Nash DM, Davies Morel MCG, McEwan NR. 2018. Detecting genetic regions associated with height in the native ponies of the British Isles by using high density SNP genotyping. A. Canovas, editor. Genome. 61(10):767–770. doi:10.1139/gen-2018-0006.
- Sved JA, Feldman MW. 1973. Correlation and probability methods for one and two loci. Theor Popul Biol. 4(1):129–132. doi:10.1016/0040-5809(73)90008-7.
- Velie BD, Fegraeus KJ, Solé M, Rosengren MK, Røed KH, Ihler C-F, Strand E, Lindgren G. 2018. A genome-wide association study for harness racing success in the Norwegian-Swedish coldblooded trotter reveals genes for learning and energy metabolism. BMC Genet. 19(1):80. doi:10.1186/s12863-018-0670-3.
- Velie BD, Solé M, Fegraeus KJ, Rosengren MK, Røed KH, Ihler CF, Strand E, Lindgren G. 2019. Genomic measures of inbreeding in the Norwegian-Swedish Coldblooded Trotter and their associations with known QTL for reproduction and health traits. Genet Sel Evol. 51(1):22. doi:10.1186/s12711-019-0465-7.
- Vetinfo. 2023. Italian national data bank for the animal husbandry register, founded by the Ministry of Health. IZS Abruzzo and Molise Publisher, Teramo, Italy (Istituto Zooprofilattico Sperimentale dell’Abruzzo e del Molise “G. Caporale”) Available at https://www.vetinfo.it [accessed 2023 June 8].
- Wright S. 1978. Evolution and the genetics of populations. Volume 4: variability within and among natural populations. Chicago (IL): University of Chicago Press.