
Abstract
The study aimed to explore the connection between horses’ total tract apparent dry matter digestibility (ttaDMD) of various roughages and faecal particle size (FPS), to develop a tool to rank roughage digestibility. Six horses, varying in size and breed, were fed six distinct roughages (four cuts of fescue, perennial ryegrass/clover mix, and straw). Each feeding period lasted 16 days, with a 14-day adaptation phase. Faecal samples underwent wet sieving analysis. Roughage chemical composition was evaluated using NIRs. Faecal and roughage acid insoluble ash content were used to estimate ttaDMD and FPS was determined by wet sieving using a set of 6 sieves of different mesh sizes (S1 to S6; 6.50, 4.50, 2.36, 1.18, 0.6 and 0.15 mm respectively). The effects of roughage ttaDMD on FPS across sieves were analysed using GLM. Linear regressions and correlations were performed between faecal residues on each sieve and mesh sizes of the sieves to create a mathematical tool to rank ttaDMD based on FPS distribution. Increased ttaDMD was associated with larger FPS, with perennial ryegrass/clover mix (ttaDMD 74.44%) and straw (ttaDMD 44.57%) resulting in smaller and larger faecal particles respectively. Correlations were observed between ttaDMD, S1 and S2 (r = 0.639 and 0.668; p ≤ 0.001). The angular coefficient of the linear function between faecal residues on each sieve support the idea to estimate roughages digestibility from FPS (R2 = 0.4153). Consequently, determining faecal residues across sieves of varying mesh sizes could serve as an indirect method for ranking roughages digestibility.
HIGHLIGHTS
Faecal particle size is related to roughage digestibility.
Roughage digestibility can be ranked by faecal sieving.
Introduction
Forage quality and digestibility plays a key role in the diets maintaining optimal nutrient absorption and gastrointestinal health in equids (Zicarelli et al. Citation2023), and their determination allow for a better estimation of the diet nutritional value (Martínez Marín et al. Citation2022). Forage particle comminution is influenced, along with chewing, by particles breakdown due to microbial degradation and enzymatic digestion, and erosion due to particles friction, leading to specific faecal granulometry, according to the animal’s species considered (Van Soest Citation2015).
Several studies have explored the relationship between diet digestibility and faecal particle size in ruminants (Jalali et al. Citation2012; Righi et al. Citation2013; Righi et al. Citation2019), whereas information concerning horses are limited (Müller Citation2012; Zwirglmaier et al. Citation2013).
Horses are non-ruminant, hindgut fermenters with a small stomach and larger caecum and colon, where they primarily digest the fibrous components of forage and roughages. Furthermore, when compared to ruminants, horses seem to be more adapted to the consumption of low-quality forages and roughages, since they are capable of increasing feed intake to maintain rates of energy and nutrient absorption (Edouard et al. Citation2008).
Whether profoundly different, as in other species, changes in dry matter intake, can affect the rate of passage of ingesta. Additionally, the varying maturity and lignification of forage, which influence its chewability and digestibility, can impact the particles breakdown and degradation rate in the gastrointestinal tract (Agazzi et al. Citation2011; Zicarelli et al. Citation2023).
The aim of this study was to evaluate the effect of the administration of several roughages, characterised by different total tract apparent dry matter digestibility (ttaDMD), on faecal particle size (FPS) in horses. A further objective was to develop a mathematical tool for ranking and comparing forages and roughages based on their digestibility by means of faecal sieving.
Materials and methods
Six healthy horses of different sizes (body weight ranging from 110 to 840 kg; body condition score ranging between 5 and 6; Henneke et al. Citation1983), breeds (Trait Comtois, Haflinger, Romanian Italian Trotter, and two ponies – one Arab half bred and one Shetland-like), age (from 6 to 16 years old) and sex (four mares, two stallions), were recruited for the study, which was performed at Re Artù stables (Novi di Modena, MO, Italy). Dental condition regularity was carefully checked in all horses before the beginning of the trial. The horses were housed in individual boxes with rubber matt and had access to a rammed earth paddock 3 h per day, except for the 24 h prior to faecal sampling to avoid sand consumption which could bias the AIA determination in faeces. They were fed ad libitum a sequence of six different roughages: four different cuts of fescue (Festuca arundinacea), perennial ryegrass (Lolium perenne)/clover mix (Trifolium pratense) and wheat straw (Triticum aestivum). The roughages were harvested and provided fresh to the horses, except for straw. Animals were not given any concentrates, because variations in amylase activity in horses and starch can affect fibre fermentation in the hindgut, altering forage digestibility (Zwirglmaier et al. Citation2013). Water was available ad libitum. The trial took place in autumn and was comprised of a total of 6 observation periods, corresponding to the 6 roughages supplied to the animals. Each period lasted 16 days, with 14 days of adaptation to the new forage and 2 days of sampling. All horses were fed the same roughage simultaneously, in individual external feeders to avoid any contamination. In the morning, a 150 g faecal sample, representative of the previous 24-hour excretion, was collected from the rubber mat floor in different spots of fresh faeces. Faecal samples were stored at −20 °C. Fresh forage samples were collected after harvesting 24 h before faecal sampling, chilled and transported to the University of Parma (43122, PR, Italy), feed analysis laboratory. Samples were dried at 65 °C for 18 h and ground in a Retch SK mill (Bauknecht, Stuttgart, Germany) to pass a 1-mm screen.
Roughages chemical composition (ash, protein, fat, NDF, ADF, ADL) was determined by NIRS technology (NIRFlex N-500, Buchi, Switzerland) and expressed as % of dry matter (DM). The acid insoluble ash (AIA) content was determined on 5 g of faecal or forage sample, ashed and subsequently boiled on a hot plate with 2 N HCl for 15 min, filtered (Whatman No. 41), recovered in a porcelain crucible and re-ashed at 550 °C (Van Keulen and Young Citation1977). The chemical composition and AIA content of the roughage fed to the horses are shown in Table .
Table 1. Comparison among sieve mesh sizes (mm) used in studies for faecal particle evaluation in horses (similar mesh sizes are grouped together in the same column).
Faecal samples underwent wet sieving on a set of six sieves (Retsch GmbH, Haan, Germany; mesh size: S1 = 6.50; S2 = 4.60; S3 = 2.36; S4 = 1.18; S5 = 0.6; S6 = 0.15 mm) for the FPS distribution analysis. Samples were mixed with lukewarm water (approximately 37 °C) poured on the top of the sieve set and washed until no particles were passing through the meshes. The residue retained on each sieve was carefully transferred on weighed paper sheets, oven dried at 65 °C for 8 h and weighed using a digital scale to calculate the proportion of residues on each sieve. The ttaDMD was estimated using AIA as internal marker according to Bergero et al. (Citation2009) and Sales et al. (Citation2012).
Statistical analysis was performed using the SPSS (version 28.0; SPSS Inc., Chicago, IL, USA). A GLM univariate procedure was applied with roughage and sieve as fixed factors, horse as a random effect, and sieve residue percentages (RP) as the dependent variable. Differences between means were evaluated using the LSD post-hoc test. The RP were plotted over the different sieves (S1 to S6) for each roughage, and the regressions and correlations between the RP on each sieve and total tract digestible dry matter (ttaDMD) were determined. Moreover, the slope of the individual regressions was plotted over ttaDMD to establish a relationship between this parameter and the slope itself. The statistical significance was set at p ≤ 0.05.
Results and discussion
Sieves mesh size
Although FPS analysis is widespread in nutritional sciences, a standardised protocol for particle size description in horses is still missing (Fritz et al. Citation2012).
In various studies about FPS, differences were observed regarding the sieves’ number, ranging from a set of three (Cichorska et al. Citation2014) up to a set of twelve sieves (Carmalt and Allen. 2008). Moreover, a wide variability in the sieve mesh sizes used in the studies about FPS distribution in horses is described (Zwirglmaier et al. Citation2013; Gunnarsdottir et al. Citation2014; Whitehouse et al. Citation2023), varying from 16 mm (Fritz et al. Citation2012; Zwirglmaier et al. Citation2013; Clauss et al. Citation2014) to 0.032 mm (Rouquette et al. Citation2005). In studies concerning cow faeces, smaller sieve mesh sizes are typically used, ranging from 1.6 mm to 20 µm (Pond et al. Citation1984; Salah et al. Citation2023) reflecting the smaller average FPS in ruminants, such as 0.2 mm in sheep and 0.4 mm in cattle (Grenet et al. Citation1984). For horses, different studies report sieve mesh size ranges from 1.15 to 2.15 mm (Carmalt and Allen Citation2008; Di Filippo et al. Citation2018). In the present study, a set of six sieves was used according with the literature and commercial availability. Specifically, the mesh sizes of S3, S4 and S5 (2.36, 1.18 and 0.60 mm, respectively) were consistent with those reported by Gunnarsdottir et al. (Citation2014) and Miyaji et al. (Citation2011), while S3 and S6 (2.36 and 0.15 mm, respectively) were similar to those used by Carmalt and Allen (Citation2008) (Table ).
Forage digestibility and faecal particle size distribution
The average ttaDMD of roughages, along with their chemical composition, are shown in Table .
Table 2. Roughages chemical composition analysed by NIR spectroscopy, ttaDMD and AIA values, as percentage of dry matter.
The effects of the different roughages type on FPS distribution are presented in Table .
Table 3. Effect of different forage type, ordered by increasing total tract apparent dry matter digestibility (ttaDMD), on faecal particle size distribution (values are reported as least squared means, % of total weight).
Straw was characterised by the lowest ttaDMD (44.58 ± 3.95% DM; p ≤ 0.001), and showed a progressive increase of FPS percentage from S1 to S5, with S6 similar to S4 and S5. Simultaneously, when considering FPS between roughages, straw demonstrated the highest RP on S5 (38.27%; p ≤ 0.001). Conversely, the perennial ryegrass/clover mix, which had the highest ttaDMD (74.44 ± 6.46% DM; p ≤ 0.001) showed a progressive increase in the percentage of RP from S1 to S4, with S6 lower than S4 and S5. On the S1, the proportion of RP numerically increased with ttaDMD of the roughages, except for fescue 3. Despite the clear trend, values did not show, however, statistically significant differences, and should be considered only as a general indication for future studies. On S6, perennial ryegrass/clover mix, having the highest ttaDMD, showed the lowest percentage of residues (18.75%; p ≤ 0.001). This is likely because rigid plant cell walls, typical of low digestible mature plants, require prolonged chewing and are comparatively more brittle than fresh plant tissues like, in our case, those of the perennial ryegrass/clover mix (Miyaji et al. Citation2011). These results are consistent with Grenet et al. (Citation1984), who observed that forages with low digestibility had an increased proportion of faecal particles on the 0.16 mm sieve in horses and sheep. Regarding S3 (2.36 mm), S4 (1.18 mm) and S5 (0.60 mm), our findings are comparable with those reported by Miyaji et al. (Citation2011), which found a similar numerical trend, being a higher proportion of smaller faecal particles associated with lower digestibility of hay. Again, our results are partially in accordance with Müller (Citation2012), using a different set of sieves, feeding three cuts of haylage: June, July, and the less digestible August. The authors found a larger proportion of faecal particles between 0.2 and 0.1 mm when the August forage was administered, in analogy to our results on S6 (0.15 mm mesh size). However, extending the study with the inclusion of molasses from beet pulp, Müller found a reversed situation, showing a higher proportion of faecal particles on the sieve with the smallest mesh size (<0.1 mm) when the most digestible June haylage was administered. The inclusion of molasses beet pulp in the diet could potentially have contributed to the differences observed in these results by modifying forage digestion dynamics.
The relationship between roughage ttaDMD and FPS was studied by sieves through correlation and regression analyses, as shown in Table . The highest Pearson correlation coefficients and the most robust regressions were found for S1 (r = 0.639, p ≤ 0.001; R2 = 0.408) and S2 (r = 0.668, p ≤ 0.001; R2=0.447). Moreover, a moderate correlation was found for S3. Notably, the correlations and the regressions’ angular coefficients were positive for S1, S2 and S3, whereas trends for negative relationships were observed between ttaDMD for S4, S5 and S6 RP proportions.
Table 4. Mean values, regressions and correlations coefficients between dry matter digestibility (ttaDMD) and faecal residues on each sieve.
Faecal sieving and field evaluation of roughages digestibility
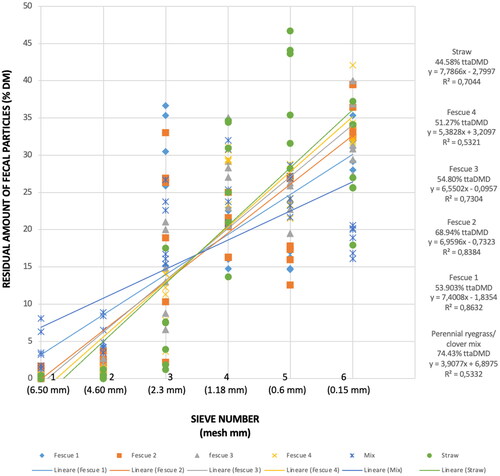
Figure depicts the overall distribution of the RP across the different sieves for each forage. The relationship between ttaDMD and FPS can be described through linear regressions, showing different slope coefficients. The steepest slopes were found for poorly digestible forages (e.g. straw, equals to 7.79) and the less steep were found for highly digestible forages (e.g. perennial ryegrass/clover mix, equals to 3.91).
Figure 1. Relationship between roughage total tract apparent digestibility (ttaDMD) and faecal particle size distribution, without distinction among horses. Regressions equations and roughage ttaDMD are reported on the right.
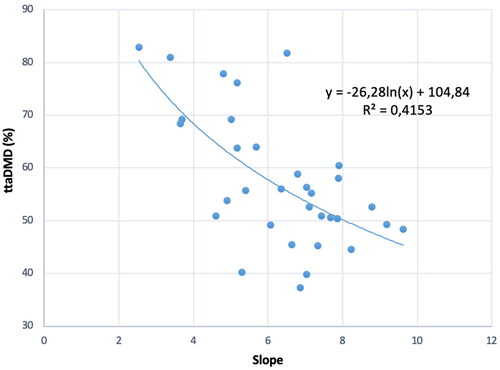
The relation between the slopes of the equations describing the overall granulometric distribution – expressed as RP – plotted over sieves (from 1 to 6) and the ttaDMD of the different roughages, theoretically allows for the estimation of the digestibility of a roughage starting from the residues on the individual faecal sieves (Figure ). Practically, the digestibility could be estimated after faecal sieving and RP plotting over sieves. Based on the data of the present study, the slope coefficients of the linear functions describing faecal particle distribution on the sieves would allow for ttaDMD estimation with a reliability of about 40% (R2 = 0.4153) using a log function. As previously observed, the range of digestibility covered by the equation is between about 40 and 75% with slopes ranging between approximatively 2.5 and 9.5. Considering the possible variability in roughage digestibility (Hansen and Lawrence Citation2017), further measurements should be performed on roughages with lower and intermediate ttaDMD, which would increase both the robustness of the function and the slope of the linear functions in the plotting to over 15.
Figure 2. Relation between the slope coefficients of the linear functions describing the residues (%) on each sieve of the faeces of each horse fed different roughage plotted over the sieves levels and the apparent dry matter digestibility (ttaDMD) of the tested roughage by each horse.
Conclusions
In this study, the distribution of faecal particle size varied depending on the ttaDMD of the roughages considered. Faecal particle size is affected by roughage digestibility, with high-fibre forages having lower digestibility, resulting in smaller faecal particles compared to forages with higher digestibility.
The results support the idea that linear regressions could be used to describe the data plot of RP over sieves for each horse and roughage, and the slope coefficient of the obtained functions could be used to estimate the digestibility itself. Using the obtained data, only digestibility ranking seems feasible at the moment.
Further research should include more individuals and could address the effect of the administration of concentrates on roughage ttaDMD and FPS distribution in the sieves set.
Ethics statement
The present work was carried out in accordance with the Italian law on animal experimentation and ethics (DL 04/03/2014 n 26).
Disclosure statement
No potential conflict of interest was reported by the author(s).
Data availability statement
Data will be made available from corresponding authors upon reasonable request.
Additional information
Funding
References
- Agazzi A, Ferroni M, Fanelli A, Maroccolo S, Invernizzi G, Dell’Orto V, Savoini G. 2011. Evaluation of the effects of live yeast supplementation on apparent digestibility of high-fiber diet in mature horses using the acid insoluble ash marker modified method. J Equine Veterinary Sci. 31(1):13–18. doi:10.1016/j.jevs.2010.11.012.
- Bergero D, Préfontaine C, Miraglia N, Peiretti PG. 2009. A comparison between the 2N and 4N HCl acid-insoluble ash methods for digestibility trials in horses. Animal. 3(12):1728–1732. doi:10.1017/S1751731109990656.
- Carmalt JL, Allen A. 2008. The relationship between cheek tooth occlusal morphology, apparent digestibility, and ingesta particle size reduction in horses. J Am Vet Med Assoc. 233(3):452–455. doi:10.2460/javma.233.3.452.
- Cichorska B, Komosa M, Nogowsk L, MaćKowiak P, Józefia D. 2014. Significance of nutrient digestibility in horse nutrition – a review. Ann Animal Sci. 14(4):779–797. doi:10.2478/aoas-2014-0059.
- Clauss M, Schiele K, Ortmann S, Fritz J, Codron D, Hummel J, Kienzle E. 2014. The effect of very low food intake on digestive physiology and forage digestibility in horses. J Anim Physiol Anim Nutr. 98(1):107–118. doi:10.1111/jpn.12053.
- Di Filippo PA, Vieira V, Rondon DA, Quirino CR. 2018. Effect of dental correction on fecal fiber length in horses. J Equine Vet Sci. 64:77–80. doi:10.1016/j.jevs.2018.02.016.
- Edouard N, Fleurance G, Martin-Rosset W, Duncan P, Dulphy JP, Grange S, Baumont R, Dubroeucq H, Pérez-Barbería FJ, Gordon IJ. 2008. Voluntary intake and digestibility in horses: effect of forage quality with emphasis on individual variability. Animal. 2(10):1526–1533. doi:10.1017/S1751731108002760.
- Fritz J, Streich WJ, Schwarm A, Clauss M. 2012. Condensing results of wet sieving analyses into a single data: a comparison of methods for particle size description. J Anim Physiol Anim Nutr. 96(5):783–797. doi:10.1111/j.1439-0396.2011.01183.x.
- Grenet E, Martin-Rosset W, Chenost M. 1984. Compared size and structure of plant particles in the horse and the sheep feces. Can J Anim Sci. 64(5):345–346. doi:10.4141/cjas84-292.
- Gunnarsdottir H, Van der Stede Y, De Vlamynck C, Muurling F, De Clercq D, van Loon G, Vlaminck L. 2014. Hospital-based study of dental pathology and faecal particle size distribution in horses with large colon impaction. Vet J. 202(1):153–156. doi:10.1016/j.tvjl.2014.07.013.
- Hansen TL, Lawrence LM. 2017. Composition factors predicting forage digestibility by horses. J Equine Vet Sci. 58:97–102. doi:10.1016/j.jevs.2017.08.015.
- Henneke DR, Potter GD, Kreider JL, Yeates BF. 1983. Relationship between condition score, physical measurements and body fat percentage in mares. Equine Vet J. 15(4):371–372. doi:10.1111/j.2042-3306.1983.tb01826.x.
- Hummel J, Fritz J, Kienzle E, Medici EP, Lang S, Zimmermann W, Streich WJ, Clauss M. 2008. Differences in fecal particle size between free-ranging and captive individuals of two browser species. Zoo Biol. 27(1):70–77. doi:10.1002/zoo.20161.
- Jalali AR, Nørgaard P, Weisbjerg MR, Nielsen MO. 2012. Effect of forage quality on intake, chewing activity, faecal particle size distribution, and digestibility of neutral detergent fibre in sheep, goats, and llamas. Small Ruminant Res. 103(2-3):143–151. doi:10.1016/j.smallrumres.2011.09.004.
- Martínez Marín AL, Valle E, Bergero D, Requena F, Forte C, Schiavone A. 2022. Evaluation of two equations for prediction of digestible energy in mixed feeds and diets for horses. Animals. 12(13):1628. doi:10.3390/ani12131628.
- Miyaji M, Ueda K, Hata H, Kondo S. 2011. Effects of quality and physical form of hay on mean retention time of digesta and total tract digestibility in horses. Anim Feed Sci Technol. 165(1-2):61–67. doi:10.1016/j.anifeedsci.2011.02.003.
- Müller CE. 2009. Long-stemmed vs. cut haylage in bales – effects on fermentation, aerobic storage stability, equine eating behaviour and characteristics of equine faeces. Anim Feed Sci Technol. 152(3-4):307–321. doi:10.1016/j.anifeedsci.2009.04.016.
- Müller CE. 2012. Equine digestion of diets based on haylage harvested at different plant maturities. Anim Feed Sci Technol. 177(1-2):65–74. doi:10.1016/j.anifeedsci.2012.06.002.
- Pond KR, Ellis WC, Akin DE. 1984. Ingestive mastication and fragmentation of forages. J Anim Sci. 58(6):1567–1574. doi:10.2527/jas1984.5861567x.
- Richards N, Choct M, Hinch GN, Rowe JB. 2003. Equine α-amylase: does it limit starch digestion in the small intestine of the horse? Recent Adv Animal Nutrit Australia. 14:191–196.
- Righi F, Gonzáles Torres YO, Martuzzi F, Renzi M, Quarantelli A. 2013. Effect of the extent of digestion of dry matter and fiber on fecal particle distribution in cows feces. Book of Abstracts of the 20th National Congress of the Animal Science and Production Association (ASPA), Bologna, June 11–13. Ital J Anim Sci. 12:suo1, 42. doi:10.4081/ijas.2013.s1
- Righi F, Simoni M, Rosita R, Ablondi M, Sabbioni A, Quarantelli A. 2019. Study of a five sieves fecal particles separator to evaluate fiber and dry matter digestibility in dairy cattle. Book of abstracts of the 23rd National Congress of Animal Science and production Association (ASPA), Sorrento, June 11-14. Ital J Anim Sci. 18:sup1:154–154. doi:10.1080/1828051X.2019.1622269
- Rouquette F, Grigsby K, Hansen D, Potter G, Ellis W. 2005. Effect of supplementation on performance and faecal particle size distribution for yearling horses and weaned calves grazing coastal bermudagrass. International Grassland Congress Proceedings of the XX International Grassland Congress. p. 158.
- Salah N, Legendre H, Faivre L, Briche M, Gourdon R, Nenov V, Salah N, Legendre H, Faivre L, Briche M, et al. 2023. Evaluating fecal sieving tool as an indicator of feed valorization and the impact of feeding strategy on dairy cow performance under farm conditions. Agri Sci. 14(10):1420–1435. doi:10.4236/as.2023.1410093.
- Sales J, Jančík F, Homolka P. 2012. Quantifying differences in total tract nutrient digestibilities between goats and sheep. J Anim Physiol Anim Nutr. 96(4):660–670. doi:10.1111/j.1439-0396.2011.01194.x.
- Van Keulen JYBA, Young BA. 1977. Evaluation of acid-insoluble ash as a natural marker in ruminant digestibility studies. Journal of Animal Science 44(2):282–287.
- Van Soest PJ. 2015. The detergent system for analysis of foods and feeds. Ithaca (NY): Cornell University.
- Whitehouse C, Hayes SH, Lawrence LM. 2023. 73 Comparison of fecal particle size of thoroughbred broodmares and their yearlings. J Equine Vet Sci. 124:104375. doi:10.1016/j.jevs.2023.104375.
- Wickström E. 2010. Effect of plant maturity at harvest of haylage on digestibility and faecal particle size in horses fed forage-dominated diets [dissertation]. Uppsala (SW): Swedish University of Agricultural Science, Department of Animal Nutrition and Management.
- Zicarelli F, Tudisco R, Lotito D, Musco N, Iommelli P, Ferrara M, Calabrò S, Infascelli F, Lombard P. 2023. Forage: concentrate ratio effects on in vivo digestibility and in vitro degradability of horse’s diet. Animals. 13(16):2589. doi:10.3390/ani13162589.
- Zwirglmaier S, Remler HP, Senckenberg E, Fritz J, Stelzer P, Kienzle E. 2013. Effect of dental correction on voluntary hay intake, apparent digestibility of feed and faecal particle size in horse. J Anim Physiol Anim Nutr. 97(1):72–79. doi:10.1111/j.1439-0396.2011.01244.x.