
Abstract
The Borg centiMax scale is a psychophysically constructed general intensity scale with verbal anchors placed in congruence with the numerical scale (0–100); thus, ratio data are obtained. With ratio data, quantitative relationships among perceptions and feelings can be determined in a statistically more solid way. The purpose of this pilot study was to explore the utility of using the Borg CR Scale® (centiMax®, CR100) for measuring depressive symptoms in a pilot study of 50 students, who completed the centiMax along with the Beck Depression Inventory (BDI). Convergent validity and reliability were examined by correlation analyses (Pearson, Spearman, and Split-half with Spearman–Brown correction), and group and individual symptom profiles were constructed to illustrate the possible advantage of level anchored ratio data. The strong correlation 0.75 (p < .001) between the instruments supports an acceptable convergent validity of the centiMax and indicates a common underlying construct. Additionally, the reliability was high (cM = 0.96; BDI = 0.90). With symptom profiles, it was demonstrated that level anchored ratio data can show both how intense (level) and how many times more intense (relation) the feelings of separate symptoms are. In conclusion, the centiMax appears to be a valid and reliable instrument; however, further studies in larger samples including clinically depressed participants are needed for evaluating its diagnostic importance.
Introduction
Depressive disorders are highly prevalent and have increased since the second half of the 20th century (Andrade et al., Citation2003; Bland, Citation2015). Because depression can be very disabling for affected patients, it appears important with an early and correct diagnosis including identification of (1) which symptoms that characterize depression; (2) how much of the symptoms that are needed for someone to become depressed, that is, the intensity and frequency of symptoms. Scales based on the principles of psychophysical scaling for assessing emotional intensity, previously developed for improving the diagnostic process of, for example, pain and perceived exertion (the Borg CR scales, Borg, Citation1962, Citation1998; Borg & Borg, Citation2001), could be an approach to enhance the diagnostic process also in the area of depression. The present pilot study of a normal population of students is based on the suggestion that perception of emotional intensity is similar to the perception of sensory intensity, and is a first attempt to explore the utility of a psychophysical intensity scale, the Borg CR Scale® (centiMax®, CR100), for assessing depressive symptoms.
According to the Diagnostic and Statistical Manual-5 (DSM-5; American Psychological Association, APA, Citation2013), typical features of depressive disorders are the presence of sad, empty, or irritable mood, accompanied by somatic and cognitive changes that significantly affect the individual’s capacity to function in social, occupational, or other important areas. A common condition among these groups of disorders, major depressive disorder (MDD), is, for example, characterized by a persistent depressed mood, reduced interest and ability to experience pleasure, disruptions in appetite and sleep, self-degrading thoughts and feelings of worthlessness, impaired attention, and thoughts of death and suicidal ideation (DSM-5, APA, Citation2013). Used as parallel diagnostic tools with the DSM, instruments designed to measure subjective feelings, self-awareness and intensity of depressive symptoms have reached a prominent role in clinical and research context. According to the meta-analysis of Aros and Yoshida (Citation2009), the most widely used scales for assessing depressive symptoms are (1) the Hamilton Rating Scale for Depression (HAM-D; Hamilton, Citation1960), (2) the Hospital Anxiety and Depression Scale (HAD; Zigmond & Snaith, Citation1983), and (3) the Beck Depression Inventory (BDI; Beck, Ward, Mendelson, Mock, & Erbaugh, Citation1961; Beck, Steer, & Brown, Citation1996). However, due to its satisfactory psychometric properties, the BDI has become one of the most commonly used instruments both in clinical and nonclinical contexts (Beck et al., Citation1996; Beck, Steer, & Garbin, Citation1988; Paranhos, Argimon, & Werlang, Citation2010).
The BDI has some weaknesses which may be inherent in health measurements in general (Adroher, Prodinger, Fellinghauer, & Tennant, Citation2018; Cano & Hobart, Citation2011). According to Stevens (Citation1975), numerical measurement data can mainly be categorized as being ordinal, interval, or ratio, where only the ratio scale permits all kinds of mathematical operations. As emphasized by Svensson (Citation1998), many multi-item questionnaires with response scales constructed as numerically coded response categories do often only give ordinal data. The values of the scale are only rank ordered, and even if each category has more of the attribute being measured than the previous category, the differences between the categories are unknown. Thus, the obtained values do not have the mathematical properties needed for arithmetic calculations. It is, however, of interest not merely to rate an individual as being “more” or “less,” for example, depressed, but also to assess how depressed the person is based on the intensity of symptoms.
The definition of meaningful rules for the measurement of constructs like depressive symptoms depends on the application field, the measurement theory, and statistical knowledge, which may be well achieved by psychophysical scaling. Psychophysics has been described as the science that studies the “quantitative relations between psychological events and physical events or, more specifically, between sensations and the stimuli that produce them” (Britannica Academic, Citation2016). Two prominent direct scaling methods for scaling perceptions are category scaling (CS) and magnitude estimation (ME). On CS, all categories should be the same perceptual size, so the intervals between them are perceptually equal ensuring interval data. However, as mentioned above, this is not always the case. In ME, individuals freely use numbers to label the perceptions of stimuli in relation to how intense they perceive the stimuli to be, thus rendering ratio data (Luce & Krumhansl, Citation1988; Luce, Citation1990; Narens, Citation1996). With ME, it has been found that the perceived intensities of most modalities form nonlinear relationships with stimulus. This can be mathematically described by power functions (Steven’s Law) with positively accelerating functions for modalities such as perceived exertion and pain and negatively accelerating functions for example for loudness, brightness, and smell (e.g., Marks, Citation1974; Stevens, Citation1975). According to Stevens (Citation1975), the development of the direct scaling methods is not only suited for sensory perception but also enables quantification of other interesting matters where human assessments form a key part (e.g., in social and opinion judgments). However, applying ME to assess depressive symptoms is impractical and would also lack some of the important aspects of the category scales. For example, without verbal anchors no level estimates are obtained (of what is perceived as “weak” or “strong”). Another weakness with both the category and ratio scaling methods is the problem of inter-subjectivity and how to make interindividual comparisons.
To meet the need of a level anchored ratio scale for interindividual comparisons, Gunnar Borg (Citation1962, Citation1998) started a process of combining a labeled category scale with a ratio scale to obtain the advantages of the verbal anchors for level determinations with the quantitative advantages of ratio data. Several studies with “quantitative semantics” were conducted to find the best possible words, both with regard to their meaning (“interpretation”) and their numerical interrelations (“preciseness”). The result was a Category (C)–Ratio (R) scale where verbal anchors are placed in accordance with their perceptual intensity along the numerical scale so that ratio data in agreement with what is found with ME is obtained (Borg, Citation1962, Citation1982, Citation1998; Marks, Citation1974; Marks & Gescheider, Citation2002). Therefore, on a Borg CR Scale®, the verbal anchor “Strong” has the approximate position of 50% of “Maximum,” and “Moderate” is approximately half of “Strong,” etc.
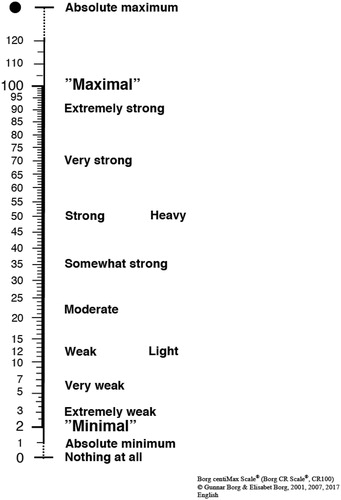
The Borg centiMax Scale® (CR100) () is a general intensity scale developed for all kinds of perceptions and feelings (Borg & Borg, Citation2001, Borg, Citation2007). The scale starts with a “Minimum” level (2), which approximates the absolute threshold. “Maximum” is anchored in the value 100, and related to the most intense perception ever experienced of a certain sensory modality (of, for example, perceived exertion). This is a very important level and functions as a “unit” for interindividual comparisons according to Borg’s Range Model, another important basis for the Borg CR Scales (Borg, Citation1962, Citation2001; Sagal & Borg, Citation1993). Because the “Absolute maximum” can be at a level above what is previously experienced, it is marked with a dot and placed outside the numerical range (120, or even somewhat more). Similarly, “Nothing at all” (0) at the bottom of the scale is a level very rarely perceived (Borg & Borg, Citation2001, Borg, Citation2007). Because the scale goes from 0 to 100 and measures the intensity of perception as parts (centigrades) of a previously experienced “maximum,” the perceptual unit of the scale is called “centiMax” (cM). Currently, the Borg CR Scales are globally used in clinical settings for assessing pain, perceived exertion, shortness of breath, muscle fatigue, etc. (Borg, Citation1990, Citation1998; Borg, Citation2010; Dedering, Németh, & Harms-Ringdahl, Citation1999; Kendrick, Baxi, & Smith, Citation2000, Loe, Rognmo, Saltin, & Wisl⊘ff, Citation2013). Furthermore, the properties of the Borg CR Scales have been validated by physiological variables and performance measures of perceived exertion, and compared to what is obtained with classical ME (Borg, Citation1998, Citation2007, Borg & Borg, Citation2001). The Borg CR Scales have, however, never before been used to measure symptoms of depression. As depression is assessed based on subjective symptoms, it is important to be able to measure these symptoms as accurately as possible. The more finely graded Borg centiMax Scale () could then be an interesting alternative to traditional Likert scales when measuring depressive symptoms.
Figure 1 The Borg CR scale® (centiMax®, CR100) (© Borg & Borg, Citation1994, Citation2001, Citation2017; Borg, Citation2007, Borg et al., Citation2010; the scale and instructions can be obtained from www.borgperception.se. Printed by permission).
The purpose of this pilot study was to explore the utility of using the Borg CR Scale® (centiMax®, CR100) for measuring depressive symptoms. In all, 50 students completed the well-established BDI together with an instrument with symptoms scaled with the centiMax. Despite different scaling methods, comparisons between the instruments are admissible as they are based on a common assumption, that is, that depressive symptoms vary in intensity. Specifically, we examined the convergent validity and reliability, and explored symptom profiles of the instruments to illustrate possible advantages of using level anchored ratio data.
Methods
Participants
In all, 34 women and 16 men (n = 50) with a mean age of 25.8 years (SD = 6.7) took part in this pilot study. All were students at the Department of Psychology, Stockholm University, Sweden.
Measures
The BDI (Beck et al., Citation1988) is a 21-item self-report questionnaire intended to assess depressive symptoms on a Likert scale ranging from 0 to 3 with anchors to each scale value. For example, item 1: {0 = I do not feel sad, 1 = I feel sad, 2 = I am sad all the time and I can't snap out of it, 3 = I am so sad and unhappy that I can't stand it}; and item 2: {0 = I am not particularly discouraged about the future; 1 = I feel discouraged about the future, 2 = I feel I have nothing to look forward to, 3 = I feel the future is hopeless and that things cannot improve}. The sum of the BDI scores identifies the level of depression. The recommended cutoff scores are 0–9 = no or minimal depression; 10–18 = mild to moderate depression; 19–29 = moderate to severe depression; and 30–63 = severe depression (Beck et al., Citation1988).
A new instrument was developed, using the Borg centiMax (cM) scale () to measure the perceived intensity of 32 depressive symptoms. In all, 21 items were in common with the BDI and 11 items were chosen in accordance with the diagnostic criteria of the DSM-5 (APA, Citation2013) to ensure good content validity. The instruction for the Borg CR scale® was used and complemented with an instruction to apply the scale for feelings. For each item, the question was “How strong is your feeling of…” for example, “sadness?” An individual mean value identified the average individual symptom intensity.
Procedure
Using a computer software, an online survey was created. After a message in which the study was explained and informed consent was given, the following three sections were completed: (1) demographic data (age and gender); (2) depressive symptoms using the centiMax scale; and (3) the BDI.
Data analysis
The Statistical Package for the Social Sciences (SPSS, version 23) was used for statistical analysis. To establish a necessary condition for parametric statistics, that is, normality, a test of skewness was conducted. For convergent validity, Pearson and Spearman correlations between individual BDI total scores and centiMax mean scores were computed. For reliability, split-half correlations with Spearman–Brown correction were used. To illustrate the possible added value of ratio data, symptom profiles were constructed. A significance level of alpha = 0.05 was used.
Results and discussion
The exploration of data showed that frequency distributions for both scales were close to normal and only a little positively skewed, with 0.56 for centiMax and 0.35 for BDI. Because this is a nonclinical sample and it is likely that most individuals only have rather weak to moderately strong feelings of the different depressive symptoms, slightly positively skewed distributions would be expected.
The mean of the 32 items scaled with the centiMax scale was 26 cM (SD = 15) and 25 cM (SD = 14) for the 21 items shared with BDI, which corresponds to “moderately strong” symptoms, and for the BDI the mean total score was 14 (SD = 9), “mild to moderate depression.” This is interesting since symptoms are measured in such different ways, that is, psychophysically versus psychometrically, but permit comparisons as they are based on the common assumption that symptoms vary in intensity.
Convergent validity
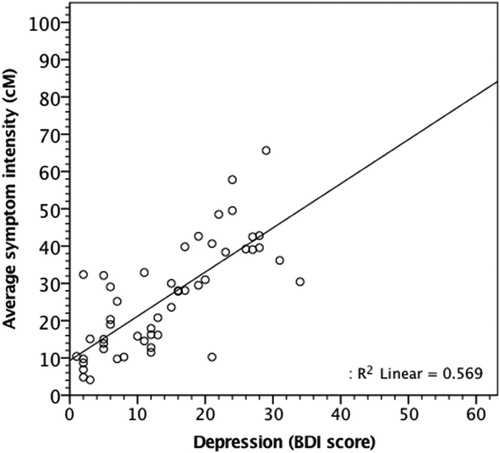
The Spearman correlation between the total scores of depressive symptoms measured with BDI and in centiMax was rs=0.76 (p < .001) and because distributions were rather close to normal, the Pearson correlation was very similar, r = 0.75 (p < .001). These are strong correlations, with close to 60% of the variance in cM explained by BDI scores (see also ), indicating convergent validity of the centiMax, and that the instruments measure a common underlying construct. Thus, the centiMax assessed depressive symptoms at least as well as the well-established BDI. It is worth to note that the ideal convergent validity not necessarily should be 1.0 as that would imply that the new test measures the construct in exactly the same way as the old test without adding anything new. As a comparison, convergent validity for BDI has previously been found with correlations between 0.6 and 0.8 for comparisons with similar instruments (Beck et al., Citation1988).
Figure 2 Scatterplot with regression line for the 50 participants and the overall amount of variance explained (R2).
Split-half reliability
To assess test reliability, split-half correlations were computed. Strong and significant correlations were obtained for both instruments, with r = 0.82 (p < .001) for BDI scores and r = 0.92 (p < .001) for cM (same value for the 21 shared items). Because a split-half correlation reduces the number of items by half, a Spearman–Brown coefficient correction was made. Corrected correlations were r = 0.90 for BDI and r = 0.96 for cM, which for the BDI can be compared with values between 0.87 and 0.93 previously found (Beck et al., Citation1988). The high correlation supports the high reliability of the centiMax.
Group symptom profiles for centiMax and BDI
shows the means and standard deviations of the participants’ perceived intensity of each of the 32 items rated with the centiMax together with the 21 BDI items. As can be seen from the table (and ), participants rated most of the items on the centiMax between a moderate and somewhat strong intensity (see ). The symptom that was on average given the lowest rating was “Suicidal thoughts or wishes” (m = 6 cM), just above “Very weak” and the highest rating was obtained for “Tiredness or fatigue” (m = 44 cM), half way between “Somewhat strong” and “Strong.” For this nonclinical group, only four symptoms were scaled above “Somewhat strong” (35 cM). The results in also show the ratio relations among perceived symptom intensities, possible to study only with ratio data (i.e., “how many times stronger is A than B?”). Thus, for example, the feeling of “Tiredness or fatigue” (m = 44 cM) was in this group of students on average judged as twice as strong as the feeling of “Guilt” (m = 22 cM) and almost four times as strong as “Punishment Feelings” (m = 12 cM). This kind of information on symptom intensity is not possible to obtain from BDI scores, as the anchors of the BDI Likert scale are not equivalent, and thus do not communicate neither if nor how much one symptom is stronger than the other. To note, however, is that a higher intensity of one symptom compared to another with the centiMax does not necessarily imply that it is more important for making a diagnosis of depression.
Table 1 The outcome of the Borg centiMax and the BDI (n = 50). Means and standard deviations of each item measured in cM and arranged in ascending order according to cM values.
Individual symptom profiles
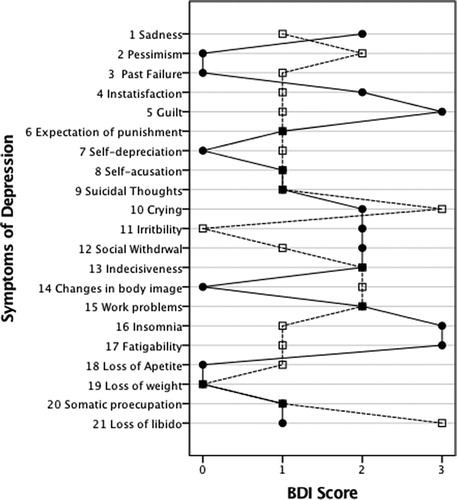
shows two examples of how individual profiles of centiMax data may look for two different participants with the same and a rather high BDI score (“Moderate depression”) and a similar average score on the centiMax Scale. The value of 50 cM, a “Strong” feeling of the symptom was arbitrarily chosen and added to the graph as a point of reference (). From an explorative perspective, shows how the finely graded centiMax scale allows the individuals to express their feelings of symptom intensity in a rather detailed manner. As can be seen from the graph, symptom intensity can vary rather much and two participants with the same BDI scores can have very different symptom profiles. shows the same graph generated for the BDI scores. As can be seen from a comparison with , the rank ordered data of the BDI Likert scale convey less information. It should also be remembered that even if each numerical category (0 – 3) expresses “more” of the symptom, categories are not necessarily perceptually equivalent for different symptoms and even the “zeros” on the Likert scale can vary in symptom strength when you compare the verbal phrases.
Figure 3 A symptom profile for centiMax ratings of the intensity of depressive symptoms for two persons with the same BDI scores (28 points, moderate depression) and similar mean on the Borg centiMax Scale (Subj 1, full line, m = 43 cM, Subj 2, dashed line, m = 40 cM). The vertical line at 50 cM denotes a “Strong” feeling of the symptom (see ).
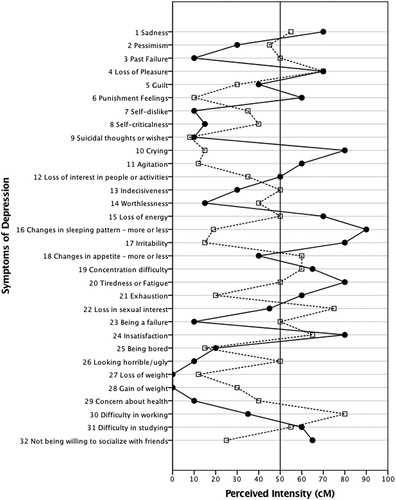
Figure 4 A symptom profile for depression measured with BDI (same two persons as in Figure 3). Note that the categories on the BDI Likert scale (0–3) are not necessarily perceptually equivalent for different symptoms.
Limitations and conclusion
There are some limitations of this study that need to be addressed. Most importantly, this was a pilot study in a rather small convenience sample of Swedish students. As a group of students, however, they can be regarded as representative with regard to BDI scores (e.g., Holländare, Askerlund, Nieminen, & Engström, Citation2008; Wang & Gorenstein, Citation2013). A larger sample including clinical participants with depression and controls is needed to assess sensitivity and specificity, internal consistency, and to obtain norm values and “cutoff” scores on the centiMax scale. Another weakness is that only the BDI was used for comparison and validation. Other important rating scales for comparisons would, for example, be the widely used Montgomery–Åsberg Depression Rating Scale (MADRS; Montgomery & Åsberg, Citation1979) and the Patient Health Questionnaire (PHQ)-9 (Kroenke, Spitzer & Williams, Citation2001). Also, this sample consisted of Swedish university students, and it is likely that they show more than average understanding in how to use the centiMax scale. It would therefore also be desirable to study samples from other cultures. Another issue that needs further investigation is if all 32 items scaled with the centiMax really are needed for a diagnosis of depression.
Despite these limitations, the conclusion remains that depressive symptoms can be validly assessed with the Borg centiMax Scale. Psychophysical scaling of depressive symptoms can contribute to the existing knowledge by its strength in rendering ratio data of perceived experience. The results of this pilot study showed that the Borg CR Scale® (centiMax®, CR100) can be used to validly and reliably assess depressive symptoms at least as well as the established BDI. With a ratio scale, it is possible to study quantitative relationships among symptoms, and obtain a profile of depressive symptoms showing both which are the more/less dominant ones (strong/weak) as well as how many times stronger one symptom is perceived compared to another. This could be a major improvement compared to what can be concluded from BDI scores. Following this path, the centiMax might in the future be better in identifying both patients and healthy people (sensitivity and specificity). However, to this achievement, the properties of the Borg centiMax Scale for depressive symptoms need to be studied in larger samples of healthy individuals, in clinical depression samples, as well as in other cultural contexts.
Acknowledgments
CAPES Foundation, Ministry of Education of Brazil, Scholarship no. 99999.003750/2015-09.
Disclosure statement
No potential conflict of interest was reported by the authors.
References
- American Psychiatric Association. (2013). Diagnostic and Statistical Manual of Mental Disorders (5th ed.). Arlington: American Psychiatric Publishing.
- Adroher, N. D., Prodinger, B., Fellinghauer, C. S., & Tennant, A. (2018). All metrics are equal, but some metrics are more equal than others: A systematic search and review on the use of the term ‘metric.’ PLoS One, 13(3), 1–23. http://doi.org/10.1371/journal.pone.019386
- Andrade, L., Caraveo-Anduaga, J. J., Berglund, P., Bijl, R. V., De Graaf, R., Vollebergh, W., … Wittchen, H. U. (2003). The epidemiology of major depressive episodes: Results from the International Consortium of Psychiatric Epidemiology (ICPE) Surveys. International Journal of Methods in Psychiatric Research, 12(1), 3–21.
- Aros, M. S., & Yoshida, E. M. P. (2009). Estudos da Depressão: Instrumentos de Avaliação e Gênero. Boletim de Psicologia, 59, 61–76.
- Beck, A. T., Ward, C. H., Mendelson, M., Mock, J., & Erbaugh, J. (1961). An inventory for measuring depression. Archives of General Psychiatry, 4, 561–571.
- Beck, A. T., Steer, R. A., & Brown, G. K. (1996). Manual for Beck Depression Inventory II. San Antonio: Psychological Corporation.
- Beck, A. T., Steer, R. A., & Garbin, M. G. (1988). Psychometric Properties of the Beck Depression Inventory: Twenty-five years of evaluation. Clinical Psychology Review, 8, 77–100.
- Bland, R. C. (2015). Epidemiology of affective disorders: A review. The Canadian Journal of Psychiatry, 60, 1–17.
- Borg, E. (2007). On Perceived Exertion and its Measurement. (Doctor degree thesis), Stockholms universitet, Stockholm, Sweden.
- Borg, E., Borg, G., Larsson, K., Letzter, M., & Sundblad, B.-M. (2010). An index for breathlessness and leg fatigue. Scandinavian Journal of Medicine & Science in Sports, 20, 644–650.
- Borg, G. (1962). Physical performance and perceived exertion. Lund: Gleerup.
- Borg, G. (1982). A category scale with ratio properties for intermodal and interindividual comparisons. In H.-G. Geissler & P. Petzold (Eds.), Psychophysical Judgement and the Process of Perception (pp. 25–34). Berlin: VEB Deutscher Verlag der Wissenschaften.
- Borg, G. (1990). A general model for interindividual comparison. In W. J. Baker, M. E. Hyland, R. Hezewijk, & S. Terwee (Eds.), Recent trends in theoretical psychology (Vol. 2, pp. 439–444). New York: Springer-Verlag.
- Borg, G. (1998). Borg’s Perceived Exertion and Pain Scales. Champaign: Human Kinetics.
- Borg, G. (2001). Borg’s Range model and Scales. International Journal of Sport Psychology, 32, 110–126.
- Borg, G., & Borg, E. (1994). Principles and experiments in category-ratio scaling. Reports from the Department of Psychology, Stockholm University, No. 789.
- Borg, G., & Borg, E. (2001). A new generation of scaling methods: Level-anchored ratio scaing. Psychologica, 28, 15–45.
- Borg, G., & Borg, E. (2017). The Borg CR Scales® Folder. Methods for measuring intensity of experience. www.borgperception.se. Hässelby, Sweden: Borg Perception.
- Britannica Academic. (2016). Psychophysics. Encyclopaedia Britannica, Inc.
- Cano, S. J., & Hobart, J. C. (2011). The problem with health measurement. Patient Preference and Adherence, 5, 279–290. http://doi.org/10.2147/PPA.S14399
- Dedering, A., Németh, G., & Harms-Ringdahl, K. (1999). Correlation between electromyographic spectral changes and subjective assessment of lumbar “muscle fatigue” in subjects without pain from the lower back. Clinical Biomechanics, 14, 103–111.
- Hamilton, M. (1960). A Rating Scale for Depression. Journal of Neurology, Neurosurgery & Psychiatry, 23, 56–62.
- Holländare, F., Askerlund, A.-M., Nieminen, A., & Engström, I. (2008). Can the BDI-II and MADRS-S be transferred to online use without affecting their psychometric properties? E-Journal of Applied Psychology, 4, 63–65.
- Kendrick, K. R., Baxi, S. C., & Smith, R. M. (2000). Usefulness of the modified 0-10 Borg scale in assessing the degree of dyspnea in patients with COPD and asthma. Journal of Emergency Nursing, 26, 216–222
- Kroenke, K., Spitzer, R. L., & Williams, J. B. W. (2001). The PHQ-9: Validity of a Brief Depression Severity Measure. Journal of General Internal Medicine, 16, 606–613.
- Loe, H., Rognmo, Ø., Saltin, B., & Wisløff, U. (2013). Aerobic capacity reference data in 3816 healthy men and women 20-90 years. PLoS One, 8, 1–11.
- Luce, D. R., & Krumhansl, C. L. (1988). Measurement, scaling and psychophysics. In R. C. Atkinson, R. J. Herrnstein, G. Lindzey, & R. D. Luce (Eds.), Stevens’ handbook of experimental psychology: Perception and motivation; Learning and cognition (pp. 3–74). Oxford, England: Wiley & Sons. http://doi.org/10.1016/0001-6918(90)90085-T
- Luce, R. D. (1990). “On the Possible Psychophysical Laws” Revisited: Remarks on cross-modal matching. Psychological Review, 97(1), 66–77. http://doi.org/10.1037/0033-295X.97.1.66
- Marks, L. E. (1974). Sensory processes: The new psychophysics. New York: Academic Press.
- Marks, L. E., & Gescheider, G. A. (2002). Psychophysical scaling. In H. Pashler & J. Wixted (Eds.), Stevens' handbook of experimental psychology (Vol. 4: Methodology in experimental psychology, pp. 91–138). New York: John Wiley and Sons.
- Montgomery, S., Åsberg, M. (1979). A new depression scale designed to be sensitive to change. British Journal of Psychiatry; 134: 382–389.
- Narens, L. (1996). A theory of ratio magnitude estimation. Journal of Mathematical Psychology, 40(2), 109–129. http://doi.org/10.1006/jmps.1996.0011
- Paranhos, M. E., Argimon, I. I. L., & Werlang, B. S. G. (2010). Propriedades psicométricas do Inventario de Depressão de Beck-II (BDI-II) em adolescentes. Avaliação Psicológica, 9, 383–392.
- Sagal, P., & Borg, G. (1993). The range principle and the problem of other minds. British Journal for the Philosophy of Science, 44, 477–491.
- Stevens, S. S. (1975). Psychophysics: Introduction to its perceptual, neural, and social prospects. New York: Wiley.
- Svensson, E. (1998). Ordinal invariant measures for individual and group changes in ordered categorical data. Statistics in Medicine, 17, 2923–2936.
- Wang, Y.-P., & Gorenstein, C. (2013). Psychometric properties of the Beck Depression Inventory-II: A comprehensive review. Revista Brasileira de Psiquiatria, 35, 416–431.
- Zigmond, A. S., & Snaith, R. P. (1983). The hospital anxiety and depression scale. Acta Psychiatrica Scandinavica, 67, 361–370.