
Abstract
Information on the degree to which individuals can make accurate estimations of someone’s age can be of importance in different legal contexts, such as for example child sexual abuse cases in which the victim is an adolescent and asylum procedures. There is, however, a scarcity of studies concerning age estimations conducted with young target persons. Using facial photos of target persons aged 12–18 years, we investigated the effects of gender, age, and ethnicity of both targets (n = 240) and observers (n = 869) on the accuracy of age estimation. We also investigated the effects of targets’ facial expressions (neutral or smiling), use of makeup, and photo quality. Participants overestimated the age of the adolescents by, on average, 3.51 years. Participants overestimated the age of young adolescent girls to a greater extent than that of younger boys. Men made larger overestimations than women. Participants also estimated smiling targets as being older than targets with neutral facial expression, and the age of girls with makeup to be older than girls without makeup. Because there was considerable variation in the accuracy of estimations, and overestimates were common, we conclude that the ability of individuals to estimate the age of adolescents is generally low. This might have important legal implications.
Introduction
Age estimation plays an important role in many legal contexts, including the selling of alcohol and tobacco products, asylum cases, human trafficking and situations related to child sexual abuse (CSA) and exploitation. For instance, in asylum and human trafficking cases (European Asylum Support Office, Citation2018; The Children's Legal Centre, Citation2017), the authorities may need to be alert in considering the possibility that applicants or victims may be below the documented or reported age. Vendors of alcohol and tobacco products are in many countries required to check the age of perceived-to -be young customers to ensure they do not sell these products to underagedconsuments (e.g., Dutch Institute for Alcohol Policy, Citation2013; Merrill et al., Citation2000). Furthermore,it may be debated in court whether a perpetrator in a suspected CSA case should have realized an adolescent claiming to have attained the legal age of consent was, in fact, below that age. Possible consequences of sexual behaviors directed at adolescents can, thus, differ depending on both the real age of the adolescent and on third-party perceptions (e.g., in court) of the age of the victim. The accuracy with which the age of adolescents can be estimated, and the factors that affect it, have, however, been sparsely investigated. As social interaction increasingly occurs on social media, and age estimation often is based solely on photos or videos of another person and not on face-to-face encounters, there is also a need for information on age estimation accuracy applicable to this context.
The role of age and gender on the accuracy of age estimations
Previous studies indicate that age estimations often are inaccurate and that young individuals often are estimated to be older than they are (Egan &Cordan, 2009; Jason et al., Citation2004; Marsh et al., Citation2013; Vestlund et al., Citation2009; Willner & Rowe, Citation2001). For example, in a study by Egan and Cordan (Citation2009), visitors in bars and cafes were asked to estimate the age of 17-year-old girls from photos in which the maturity-level of the faces had been manipulated by either decreasing or increasing maturity cues. On average, the age of the girls in the photos were overestimated by 3.5 years. The estimate was higher for more mature faces, but also more immature faces were on average estimated as older than 17 years. The age of older targets, on the other hand, seem to be less overestimated or even underestimated (Vestlund et al., Citation2009). This was demonstrated in one of the experiments by Vestlund and colleagues (2009), in which 15–30 years old participants overestimated the age of 15–19- and 34–46-year-old individuals, but underestimated the age of the age of 56–64-year-olds (Vestlund et al., Citation2009).
Previous studies also indicate that people tend to estimate female faces more inaccurately than male faces (Dehon & Brédart, Citation2001; Willner & Rowe, Citation2001), especially when the target is young. In a study conducted by Willner and Rowe (Citation2001), where alcohol servers estimated the age of 13-, 16-, 20- and 22-year-old targets from photos, overestimation errors were greater for girls than boys in the age groups 13 and 16, whereas the age of both girls and boys aged 20 and 22 years was underestimated. In self-reports, alcohol servers also state that they find it more difficult to assess the age of female customers than that of male customers (Willner et al., Citation2000). The current literature, thus, suggests a general tendency for people to overestimate the age of adolescents, and especially females.
Other factors affecting age estimation accuracy
Characteristics of the person who performs the age estimation, such as age and gender, have also been shown to be of importance. According to a study, younger people (under 35 years old) seem to be more accurate estimators than older people (35–50-year-olds), regardless of the age of the target persons (Nkengne et al., Citation2008). Other studies have observed an own-age bias, implying that people generally are more accurate when estimating the age of people who are close to themselves in age, compared to targets who are much younger or older (Anastasi & Rhodes, Citation2005, Citation2006; Sörqvist et al., Citation2011; Vestlund et al., Citation2009; Voelkle et al., Citation2012). This own-age bias has been proposed as one reason for why studies in general find that the age of young targets is overestimated, whereas the age of older targets is underestimated (George & Hole, Citation1995; Willner & Rowe, Citation2001).
There also seem to be gender differences, as, women have been found to make more accurate estimations than men(Nkengne et al., Citation2008; Vestlund et al., Citation2009). Men are more likely to over- and underestimate age than women, especially when estimating female targets (Marsh et al., Citation2013; Nkengne et al., Citation2008). However, contradicting the previous results, a study by Willner and Rowe (Citation2001) indicated that women tend to make slightly higher and thus more biased age ratings than men. In sum, more research is needed concerning the effect of the estimator’s gender on age estimation accuracy.
The ethnicity of the target and the estimator may also affect the accuracy of age estimations. Dehon and Brédart (Citation2001) found that cross-race age estimations were more inaccurate than within-race age estimations, indicating that it is easier to estimate the age of individuals belonging to one’s own ethnic group. The result is likely a part of a wider phenomenon known as the own-race bias, implying that people tend to have better perception and memory for faces when targets belong to an ethnicity highly represented in the context in which the estimator has grown up (see Meissner & Brigham, Citation2001, for a review).
Other factors related to the target potentially affecting age estimation accuracy include facial expression and the target's use of makeup. There is some evidence that smiling emphasizes neotenous, youthful features of the face and thus biases age estimations towards underestimation (Wang et al., Citation2015). Voelkle and colleagues (2012) also demonstrated that presenting individuals with photos of emotional faces lead to more inaccurate age estimations than photos of neutral faces, and that the ages of smiling faces in particular are likely to be underestimated. However, contradicting these results, Ganel (Citation2015) found in a series of experiments that, when smiling, targets were perceived to be older than when having a neutral facial expression. Lastly, makeup can alter facial features and make young faces look older, and older faces look yougner (Egan & Cordan, Citation2009; Tagai et al., Citation2016).
The current study
In the majority of previous studies, target faces have been administered to participants through photos taken under standardized studio conditions. This reduces the risk of irrelevant photo features affecting the results, but also leads to lower ecological validity, asin real life, individuals rarely estimate the age of faces in standardized photos. On social media platforms, for instance, individuals are more likely to present themselves by using unstandardized photos (i.e., photos taken in more naturalistic circumstances and not by professionals). In the current study, we include both standardized and unstandardized photos when investigating how accurately the ages of 12–18-year-old adolescents are estimated based on facial photos. We further investigated the effects of gender, age, and ethnicity of the participant and the adolescent in the photo (target) on age estimation accuracy. We also investigated the possible effects of facial expressions (neutral vs. “small smile” vs. “large smile”), make-up (only for female targets), and photo standardization (professional vs. unprofessional photos). For this purpose, we asked participants to estimate the age of targets presented in photos from different databases. We also asked participants to assess the likelihood that targets were 16 years of age or older and 18 years of age or older. We chose these ages as the age limits for consent in many jurisdictions, including Finland, where this study was conducted, have 16 and 18 as ages of consent. Based on earlier research findings, we formulated the following research hypotheses:
We expected participants to overestimate the age of the targets.
We expected larger overestimates for female compared to male targets.
We expected larger overestimations for smiling (vs. neutral) facial expressions and for targets using make-up (vs. no make-up).
We expected female (vs. male) and younger (vs. older) participants to make more accurate age estimations. We also expected age estimations to be more accurate if the participant and target were of the same (vs. different) ethnicity.
We further explored the effect of photo standardization as well as forensically interesting interactions between the age of targets, target gender, and participant gender to investigate whether there was a bias for male participants to overestimate the age of young female targets.
Method
Participants
The current study included 869 individuals aged 15 to 67 years (M = 25.19, SD = 8.42). Only individuals who had turned 15 years old were allowed to participate. Of all participants, 78.9% (n = 685) reported being female, 19.2% (n = 167) male, and 1.8% (n = 16) other. Most participants reported currently living in Finland (95.4%); others were, for example, from Sweden, China, the US, the UK, or Australia. Most participants (94.1%) reported having lived most of their life in Finland, and 95.3% reported their ethnicity as Caucasian.
Participants were recruited by sending an invitation to e-mail lists of various university student associations, as well as distributing the invitation on Facebook. The invitation was also sent to psychology teachers in Finnish high schools and university teachers in other countries, asking them to distribute the study among their students. Participation was voluntary. Participants were not compensated. The participants were informed about the purpose of the study (age estimation accuracy) in the invitation. The study had received ethical approval from the Board for Research Ethics at ÅboAkademi university.
Stimuli
We chose frontal facial photos of 12–18-year-old individuals from three face databases; the APPA-REAL database (Agustsson et al., Citation2017), the Siblings database (Vieira et al., Citation2014), and the NIMH Child Emotional Faces Picture Set (Egger et al., Citation2011). We screened all photos in the databases. We included a photo if it met predefined criteria (e.g., good quality, frontal facial neutral or smiling facial expression; see Appendix A for a full list of criteria). Photos were either professional (i.e., studio-like photos, with one-color background, good lightning, and high quality) or unprofessional (i.e., everyday photos, such as selfies, or photos without studio-like conditions, poorer lightning, and lower quality). Some photos from the APPA-REAL database were cropped if, for example, the torso was visible. Criteria for cropping photos are also presented in the Appendix A.
Three raters independently rated the photos concerning facial expression (neutral, small smile, or large smile) and make-up (no make-up, light make-up, or heavy make-up). We ran two-way mixed effects intraclass correlation coefficients in SPSS (version 25) to determine the absolute inter-rater agreement. Agreement was high for make-up, ICC = 0.89 [0.86, 0.92], p< .001, and excellent, ICC = 0.93 [0.91, 0.94], p< .001, for facial expressions. In case of disagreement, we selected the alternative that two of the three raters had chosen. In the one case, where all three raters chose different alternatives, we selected the in-between alternative (light make-up). The three raters also rated the targets’ ethnicity (Asian, African, Caucasian, Hispanic, Middle Easterner, Native American, or Pacific Islander). Interrater agreement was high also for ethnicity, ICC = 0.86 [0.83, 0.89], p< .001. Because most targets were Caucasian, the number of other ethnicities was insufficient to form separate categories. We, therefore, divided the photos into two categories regarding ethnicity: Caucasian and Other. The count of photos by category is presented in .
Table 1 The number of photos used by stimulus categories.
Procedure
The photos were divided into six surveys, each including 40 photos (25 girls and 15 boys). All surveys included roughly the same number of photos of girls and boys, photos from each age group, and professional/unprofessional photos. The invitation included links to all surveys, and participants were asked to choose the link next to their month of birth.After first giving informed consent, participants were asked to report their age, gender (female, male, or other), nationality, and ethnicity (Asian, African, Caucasian, Hispanic, Middle Easterner, Native American, Pacific Islander, prefer not to answer, or other). Participants were then presented with photos in two stages. First, participants were shown 40 photos one at a time in randomized order and asked to estimate the age of each person in full years. After this stage, participants were shown the same photos again and asked “How likely do you think it is that this person is 16 years or older?” and “How likely do you think it is that this person is 18 years or older?.” To both questions, participants responded on a scale from 0 (very unlikely) to 100 (very likely) using a slider. At the end of the survey, participants were asked four questions regarding their experience of age estimations. This was done to obtain information about whether the participants had received feedback on age estimating, as training in age assessments has been shown to be effective (Sörqvist & Eriksson, Citation2007; Vestlund et al., Citation2009; Voelkle et al., Citation2012). Participants were asked whether they had worked with 12–18-year-old adolescents, whether they had worked as salespersons selling age-restricted products, and whether they had one or more siblings or children currently aged between 12 and 18 years.
Statistical analyses
Data screening and recoding
In total, 31849 age estimations were included in the analyses. The participants further made 25219 likelihood ratings of the target being over 16 and 18 years old, respectively. We considered age estimations of 5 years or less (n = 68) and 50 years or older (n = 5) as possible mistakes and excluded these ratings. As a measure of estimation accuracy, we subtracted the target’s real age from each estimated age to produce an accuracy score. A positive accuracy score, thus, indicated overestimating the target’s age and a negative accuracy score indicated underestimating the target’s age. We also recoded the participants’ ethnicity into two categories (Caucasian or other) as there were few non-Caucasian participants (n = 22).
Linear-mixed effects models
We conducted all analyses in the statistical software R (R Core Team, Citation2015). To account for the clustering of responses, we used linear mixed-effects modeling (LMM) with the lmer function in the lme4 package (Bates et al., Citation2015) to test our hypotheses. In all LMM analyses, participants and photos were treated as random intercepts, while the accuracy score was set as the outcome variable. To obtain ANOVA-type effects, we used the package lmertest (Kuznetsova et al., Citation2016) in analyses with categorical variables. For follow-up pairwise comparisons, we used the package lsmeans (Lenth, Citation2016).
Results
Descriptive results
Of the 869 respondents, 866 (99.7%) had conducted at least one age estimation in the first stage of the survey, and 714 (82.2%) had conducted the likelihood ratings for at least one photo in the second stage of the survey. We investigated the zero-order correlations between the three types of estimates. As could be expected, there was a strong correlation between the age estimates and the perceived probability of being 16 years old or older (r = .59), and between age estimates and the perceived probability of the target beinng 18 years old or older (r = .73). The correlation between the two probability ratings was r = .68.
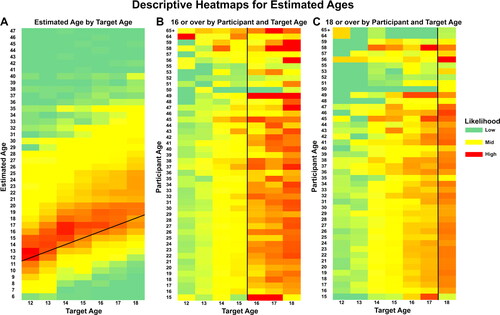
After this, we plotted densities of the age estimations and perceived probabilities by target age using heatmaps (). To do this, the probability rating variables were dichotomized, indicating whether the participant had reported it was more probable than not (> 50% vs. ≤ 50%) that the target was 16 years old or older and 18 years old or older, respectively. In panel A, the densities of estimated ages are plotted against each target age category. A visual inspection shows that participants generally overestimated the targets’ age by a few years. Panel B and C show that targets as young as 14 years old were frequently perceived as having turned 16 and 18. Similarly, 16-year-old targets were frequently perceived as being 18 years old or older (Panel C). The percentage of responses indicating that the targets were perceived more likely than not to be above the respective ages are presented in Appendix B (), divided by participant and target gender. Note that the number of participants is relatively low for older ages. The age distribution of the participants is displayed in in the Appendix B.
Figure 1 Descriptive heatmaps for estimated ages. Panel A shows the estimated age (in years; y-axis) plotted against the target’s actual age (in years; x-axis). Panels B and C shows the likelihood participants of a certain age (in years; y-axis) believes it more likely than not that a target is over 16 or 18 years of age, respectively, as a function of the target’s actual age (in years; x-axis). Black lines represent the correct estimate. Note that the number of participants is relatively low for older ages. The age distribution of the participants is displayed in in Appendix B.
Accuracy of age estimations
Preliminary analysis
Before testing our hypotheses, we investigated the possible effects of having work experience of age estimations and/or current contact with adolescents on estimation accuracy. The LMM analysis showed a significant effect of work experience with adolescents, F(1, 588.40) = 6.48, p = .011, n = 596, indicating that participants with such work experiences (M = 3.25, SE = 0.25) were more accurate in their estimations than those without (M = 3.60, SE = 0.27). The other experience and contact related variables had no statistically significant effect on estimation accuracy: F(1, 586.52) = 0.80, p = .370 for having worked as salespersons; F(1, 587.17) = 0.33, p = .562 for having adolescent siblings; and F(1, 587.41) = 0.12, p = .733 for having adolescent children. Because of this, we conducted control analyses for all hypothesis tests controlling for work experience. As only 596 participants had answered the questions concerning experience, statistical power was reduced in the follow-up analyses.
Main analyses
To investigate our first hypothesis that participants overestimate the age of the targets, we conducted separate one-sample t-tests for each age, comparing the estimated age with the actual target age (). For all age groups, participants significantly overestimated the age. Averaged across all age groups, participants overestimated the age of the targets by 3.51 years (SD = 4.91). We also averaged the perceived probability that targets were 16 and 18 years or older. When evaluating 12-year-old targets, participants on average perceived the probability that targets were 16 years or older to be more than 25% and the probability that the 12-year-old targets were 18 years or older to be close to 15%. For 14-year-old targets, participants perceived, on average, it more probable than not, that the targets were 16 years or older. Concerning 16-year-old targets, participants perceived the probability targets were 18 years or older to be almost 50% ().
Table 2 Accuracy of age estimations for each target age category.
Target gender
To test our second hypothesis,thatoverestimates would be larger for female compared to male targets, we ran an LMM analysis with target gender as a fixed factor and the accuracy score as the outcome. We found that overestimates were larger for female targets (M = 3.95, SE = 0.23) than for male targets (M = 2.77, SE = 0.29), F(1, 236.77) = 10.76, p = .001, n = 850. The effect remained after controlling for whether or not the participants had worked with adolescents, F(1, 236.55) = 9.79, p = .002, n = 583.
Facial expression, make-up, and standardization
We then tested our third hypothesis, that overestimations would be larger for targets with smiling facial expression, for targets using make-up, and for professional photos. We found a significant effect of facial expression, F(2, 237.01) = 4.31, p = .015, n = 866, which remained after controlling for whether participants had worked with adolescents, F(2, 237.07) = 4.38, p = .014, n = 596. Overestimates were significantly smaller for targets with neutral facial expressions (M = 2.94, SE = 0.27) than targets with a small smile (M = 3.95, SE = 0.28), t(236.29) = 2.64, p = .024. Overestimates were larger for targets with a large smile (M = 4.04, SE = 0.45) than targets with a small smile and neutral facial expression, but these differences were not statistically significant, t(237.35) = 0.19, p = .981 and t(237.71) = 2.13, p = .086, respectively.
In the analyses for make-up, we included only photos of female targets. We found an effect of make-up, F(2,145.70) = 4.79, p = .010, n = 863, and also this effect remained after controlling for having worked with adolescents, F(2, 145.51) = 4.68, p = .011, n = 596. Overestimates were smallest for no make-up (M = 3.14, SE = 0.34), and differed significantly from light make-up (M = 4.45, SE = 0.34), t(145.46) = 2.90, p = .012). The largest overestimates were reportedfortargets with heavy make-up (M = 4.56, SE = 0.59). There was, however, no statistically significant difference betweenheavy make-up and light make-up,t(145.89) = 0.16, p = .987. Somewhat unintuitively, the difference between heavy make-up and no make-up was also non-significant, t(145.87) = 2.08, p = .097. This is likey due to low power, as only 19 pictures were rated as heavy make-up.
Concerning standardization, we found no statistically significant effect, F(2, 237.05) = 0.112, p = .739, n = 866, and F(2, 236.86) = 0.15, p = 703, n = 596 when controlling for work experience. Overestimates were larger for standardized (professional) (M = 3.60, SE = 0.33) than unstandardized (unprofessional) photos (M = 3.47, SE = 0.22).
Participant characteristics
After this, we tested our fourth hypothesis, that female (vs. male) and younger (vs. older) participants would conduct more accurate age estimates. Before testing the effect of participant gender, we excluded participants who reported their gender as other (n = 16). We found a significant effect of participant gender, F(1, 829.99) = 5.99, p = .015, n = 850. Male participants (M = 3.80, SE = 0.22) overestimated target age more than female participants (M = 3.44, SE = 0.19). The observed effect did not, however, remain after controlling for work experience, F(2, 576.27) = 2.81, p = .094, n = 596.
In the analysis of participant age, age was modeled as a linear predictor. We found no effect of participant age on accuracy, B = 0.00, SE = 0.01, t = 0.71, p = .480, n = 866, and B = 0.00, SE = 0.01, t = 0.08, p = .936, n = 596 when controlling for work experience.
Before testing the effect of ethnicity, we excluded participants who reported their ethnicity as not being Caucasian, due to the small sample size of this population (n = 22). We found no significant effect of ethnicity on accuracy, F(1, 229.31) = 2.03, p = .155, n = 812, and F(1, 229.30) = 2.19, p = .140, n = 571 when controlling for work experience. Overestimates were larger for targets of another ethnicity (M = 4.08, SE = 0.42) than targets of Caucasian ethnicity (M = 3.42, SE = 0.21).
Exploring interaction effects of target age, target gender, and participant gender
In a final step, we explored forensically interesting interactions between target age, target gender, and participant gender to investigate whether there is a bias for men to overestimate the age of young females. To do this, we conducted an LMM analysis with the main effects, as well as the two- and three-way interactions. We found statistically significant main effects of all predictors, as well as two significant interaction effects (between target age and target gender as well as between target age and participant gender; ). The targets’ age was significantly and positively related to estimation accuracy, B = 0.23, SE = 0.10, t = 2.36, p = .019, indicating larger overestimation as target age increases.
Table 3 Effects of target age, target gender, and participant gender on estimation accuracy.
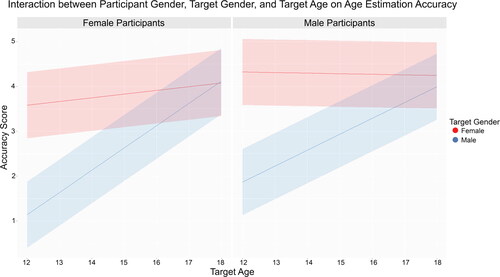
We plotted the three-way interaction between participant gender, target gender, and target age on the accuracy scores (). For female targets, overestimates were relatively independent of the targets’ actual age, with age estimates being higher than the actual age already for 12-year-old targets. For male targets, the overestimates increased as targets became older. This pattern was similar for female and male participants. Target age was more strongly associated with increasing overestimates in female participants, and male participants were slightly more likely to overestimate the actual age of also young targets.
Figure 2 Interaction between participant gender (panels), target gender (lines), and target age (x-axis) on accuracy score (y-axis). Higher accuracy scores mean larger overestimates of target ages.
Discussion
The aim of the current study was to investigate how the participant’s and the target person’s gender, age and ethnicity influenced age estimation accuracy in facial photos of 12-18 year-old adolescents. The effects of makeup, facial expression, and picture standardization on age estimations were also studied.
Main findings and interpretation
As expected, the age of the target persons was overestimated in all age groups (M = 3.51 years). On average, the participants found it 60% likely that the 14-year-olds were 16 years old or older, whereas the mean perceived likelihood that the 16-year-olds were 18 years old or older was about 50%. The results of the current study also indicated that, in younger age groups, pictures of female targets were overestimated to a greater extent than pictures of male targets. Hence, young girls (about 12 years old) have a greater risk of being estimated as older than their actual age compared with boys of the same age or older girls and boys (about 18 years old). This result is consistent with earlier research suggesting that the age of females is experienced as more difficult to estimate and is more likely to be overestimated (e.g., Willner et al., Citation2000; Willner & Rowe, Citation2001). One reason for this may be the use of makeup among young girls, which may make them look more mature. In the present study, make-up was related with an increase in age estimates. However, the female targets without make-up were also overestimated by 3.14 years on average. It is known that girls tend to reach puberty earlier than boys (e.g., Grummer-Strawn et al., Citation2010; Walvoord, Citation2010), which may be the reason for why girls look more mature, and are estimated to be older, than same-aged boys.
In line with the hypothesis, participants gave higher age estimates for smiling faces than faces with neutral expressions. The current results are in line with Ganel’s (Citation2015) series of experiments, where smiling individuals were estimated as older than their real age. On the contrary, Wang et al. (Citation2015) and Voelkle et al. (Citation2012) found that smiling faces were estimated as younger than neutral faces. In Ganel’s experiments, as well as in the current study, the pictures were of relatively young people (20–40 years old in Ganel’s experiments), whereas the target person in the study by Wang et al. (Citation2015) was middle-aged (specific age not mentioned). The age range of the target persons in Voelkle et al.’ (2012) study was wide, 19–80 years. Thus, in the latter experiments, where smiling faces were estimated to be younger than neutral faces, the target persons were on average older. It is possible that the direction of the effect of facial expression depends on the real age of the targets, making younger faces appear older and older faces appear younger.
Experience of working with adolescents was found to affect age estimations by reducing overestimation. Such work experience might, for example, be teaching, tutoring, or coaching a sports team. In these roles, the person has information about the age of a large number of adolescents and is frequently in contact with them, which possibly improves their age estimation accuracy. On the other hand, having children or siblings currently aged 12 to 18 years, or having worked as a salesperson selling age-restricted products, did not affect estimation accuracy. The result concerning work experience of selling age-restricted products is somewhat contradictory to earlier research findings indicating that salespeople perform better in age estimation tasks than laypeople, and that age estimation ability can be improved by training (Sörqvist & Eriksson, Citation2007; Vestlund et al., Citation2009; Voelkle et al., Citation2012). However, the amount of work experience as a salesperson was not investigated in the current study, and, as a majority of the participants was in their early 20 s, it is possible that their experience of such work was rather scarce.
Limitations
There are some limitations of the present study. First, the survey was distributed via the Internet, which means that the conditions in which the participants completed the survey are unknown. However, distributing the survey online allowed for the collection of data from a large number of participants. Second, the devices with which the participants completed the survey (smartphone, tablet, or computer) are likely to have affected the size of the presented photos, which, in turn, could have affected the results. Third, the facial features (make-up or facial expression) were not randomly manipulated, but instead, coded as they appeared in the photos. Especially for the more naturalistic photos, it is possible that the causal relationships between age cues and features are the opposite of what is suggested above. For example, it is possible that females who look more mature use more make-up. However, the possible problem of reversed causality is unlikely to be relevant for facial expression.
Unlike in earlier studies (e.g., Dehon & Brédart, Citation2001), ethnicity was not found to affect age estimation accuracy in this study. However, the measures used in the present study were crude, as target pictures were merely divided into groups of “Caucasian” and “other.” This was done because of the low number of participants who reported their ethnicity as other than Caucasian.
Conclusions and legal implications
The current study adds to the existing research on age estimations by including a relatively large sample of both participants and administered photos, and by focusing specifically on estimating the age of adolescents. The results indicate that there is large variation in age estimations made of facial photos, and that individuals commonly estimate that adolescents, and especially female adolescents, are older than they are. Furthermore, men make larger overestimations than women. The results, thus, indicate that mistaken age estimations are common, implying that other means than relying solely on estimations of age based on physical appearance should be taken into consideration when assessing the likelihood that a person accused of CSA should have been able to estimate that a young person is below the age of sexual consent. Based on these results, the authors would also advise against legal practices that include subjective estimations of age, as these are likely to be inaccurate.
In addition, the current study indicates that certain features of the photos, such as the person in the photo wearing make-up and smiling, can further increase overestimation of the age of adolescents. Previous research on how individuals’ rate the age of other people has mainly been conducted on standardized photos. This kind of photos is rarely used when people present themselves online. However, the present study did not find any difference in age estimation accuracy between standardized and more naturalistic photos, indicating that the results produced in studies administering standardized photos are generalizable to more naturalistic online settings. This, however, should be replicated in future research.
The data that support the findings of this study are openly available in a public server at https://osf.io/ncxb7/.
Disclosure statement
No potential conflict of interest was reported by the authors.
References
- Agustsson, E., Timofte, R., Escalera, S., Baro, X., Guyon, I., Rothe, R. (2017). Apparent and real age estimation in still images with deep residual regressors on Appa-Real database. Proceedings of 12th International Conference on Automatic Face & Gesture Recognition, 87–94.
- Anastasi, J. S., & Rhodes, M. G. (2005). An own-age bias in face recognition for children and older adults. Psychonomic Bulletin & Review, 12(6), 1043–1047. https://doi.org/10.3758/bf03206441
- Anastasi, J. S., & Rhodes, M. G. (2006). Evidence for an own-age bias in face recognition. North American Journal of Psychology, 8(2), 237–252.
- Bates, D., Mächler, M., Bolker, B., & Walker, S. (2015). Fitting linear mixed-effects models using lme4. Journal of Statistical Software, 67(1), 1–48. https://doi.org/10.18637/jss.v067.i01
- Dehon, H., & Brédart, S. (2001). An 'other-race' effect in age estimation from faces . Perception, 30(9), 1107–1113. https://doi.org/10.1068/p3122
- Dutch Institute for Alcohol Policy (2013). Eyes on ages: A research on alcohol age limit policies in European Member States. Legislation, enforcement and research. https://ec.europa.eu/health/sites/health/files/alcohol/docs/eyes_on_ages_report_en.pdf
- Egan, V., & Cordan, G. (2009). Barely legal: Is attraction and estimated age of young female faces disrupted by alcohol use, make up, and the sex of the observer? British Journal of Psychology (London, England: 1953), 100(Pt 2), 415–427. https://doi.org/10.1348/000712608X357858
- Egger, H. L., Pine, D. S., Nelson, E., Leibenluft, E., Ernst, M., Towbin, K. E., & Angold, A. (2011). The NIMH child emotional faces picture set (NIMH‐ChEFS): A new set of children's facial emotion stimuli. International Journal of Methods in Psychiatric Research, 20(3), 145–156. https://doi.org/10.1002/mpr.343
- European Asylum Support Office (2018). Practical guide on age assessment: Second edition. https://www.easo.europa.eu/sites/default/files/easo-practical-guide-on-age-assesment-v3-2018.pdf
- Ganel, T. (2015). Smiling makes you look older. Psychonomic Bulletin & Review, 22(6), 1671–1677. https://doi.org/10.3758/s13423-015-0822-7
- George, P. A., & Hole, G. J. (1995). Factors influencing the accuracy of age estimates of unfamiliar faces. Perception, 24(9), 1059–1073. https://doi.org/10.1068/p241059
- Grummer-Strawn, L. M., Reinold, C., & Krebs, N. F. (2010). Use of World Health Organization and CDC growth charts for children aged 0–59 months in the United States. MMWR RecommRep, 59, 101–115.
- Jason, L. A., Pokorny, S. B., Sherk, J. L., Helzing, D. M., & Rebus, P. J. (2004). Selling tobacco to minors: Can merchants accurately determine a customer's age? Journal of Human Behavior in the Social Environment, 8(4), 67–73. https://doi.org/10.1300/J137v08n04_04
- Kuznetsova, A., Brockhoff, P. B., & Christensen, R. H. B. (2016). lmerTest: Tests in linear mixed effects models. Journal of Statistical Software, 82, 1-26.
- Lenth, R. V. (2016). Least-squares means: The R-package lsmeans. Journal of Statistical Software, 69(1), 1–33. https://doi.org/10.18637/jss.v069.i01
- Marsh, R., Romero, S., & Patrick, S. (2013). Estimating age: College males versus convicted male child sex offenders. Journal of Child Sexual Abuse, 22(8), 968–986. https://doi.org/10.1080/10538712.2013.841789
- Meissner, C. A., & Brigham, J. C. (2001). Thirty years of investigating the own-race bias in memory for faces: A meta-analytic review. Psychology, Public Policy, and Law, 7(1), 3–35. https://doi.org/10.1037/1076-8971.7.1.3
- Merrill, R., Stanford, J., Lindsay, G., & Neiger, B. (2000). The relationship of perceived age and sales of tobacco and alcohol to underage customers. Journal of Community Health, 25(5), 401–410. 2000).
- Nkengne, A., Bertin, C., Stamatas, G., Giron, A., Rossi, A., Issachar, N., & Fertil, B. (2008). Influence of facial skin attributes on the perceived age of Caucasian women. Journal of the European Academy of Dermatology and Venereology: JEADV, 22(8), 982–991. https://doi.org/10.1111/j.1468-3083.2008.02698.x
- R Core Team (2015). R: A language and environment for statistical computing. R Foundation for Statistical Computing. https://www.r-project.org/
- Sörqvist, P., & Eriksson, M. (2007). Effects of training on age estimation. Applied Cognitive Psychology, 21(1), 131–135. https://doi.org/10.1002/acp.1271
- Sörqvist, P., Langeborg, L., & Eriksson, M. (2011). Women assimilate across gender, men don’t: The role of gender to the own-anchor effect in age, height and weight estimates. Journal of Applied Social Psychology, 41(7), 1733–1748. https://doi.org/10.1111/j.1559-1816.2011.00774.x
- Tagai, K., Ohtaka, H., & Nittono, H. (2016). Faces with light makeup are better recognized than faces with heavy makeup. Frontiers in Psychology, 7, 226. https://doi.org/10.3389/fpsyg.2016.00226
- The Children's Legal Centre (2017). Age disputes, traffickingand thecriminal justice system. https://www.childrenslegalcentre.com/resources/criminal-justice-age-trafficking/
- Vestlund, J., Langeborg, L., Sörqvist, P., & Eriksson, M. (2009). Experts on age estimation. Scandinavian Journal of Psychology, 50(4), 301–307. https://doi.org/10.1111/j.1467-9450.2009.00726.x
- Vieira, T. F., Bottino, A., Laurentini, A., & De Simone, M. (2014). Detecting siblings in image pairs. The Visual Computer, 30(12), 1333–1345. https://doi.org/10.1007/s00371-013-0884-3
- Voelkle, M. C., Ebner, N. C., Lindenberger, U., & Riediger, M. (2012). Let me guess how old you are: Effects of age, gender, and facial expression on perceptions of age. Psychology and Aging, 27(2), 265–277. https://doi.org/10.1037/a0025065
- Walvoord, E. C. (2010). The timing of puberty: Is it changing? Does it matter? The Journal of Adolescent Health: Official Publication of the Society for Adolescent Medicine, 47(5), 433–439. https://doi.org/10.1016/j.jadohealth.2010.05.018
- Wang, Z., He, X., & Liu, F. (2015). Examining the effect of smile intensity on age perceptions. Psychological Reports, 117(1), 188–205. https://doi.org/10.2466/07.PR0.117c10z7
- Willner, P., Hart, K., Binmore, J., Cavendish, M., & Dunphy, E. (2000). Alcohol sales to underage adolescents: An unobtrusive observational field study and evaluation of a police intervention. Addiction (Abingdon, England), 95(9), 1373–1388. https://doi.org/10.1046/j.1360-0443.2000.95913738.x
- Willner, P., & Rowe, G. (2001). Alcohol servers' estimates of young people's ages. Drugs: Education, Prevention, and Policy, 8(4), 375–383.
Appendix A
Criteria for photo selection and cropping
From the APPA-REAL database (Agustsson et al., Citation2017), photos were selected if the head of the individual in the photo was completely visible, the photo was frontal facial (photos where marginal sections of the upper forehead or hair were not visible were accepted), the individual’s eyes were directed towards the camera, and the individual had a neutral or smiling facial expression. Only pictures of 12–18-year-old persons were included in the study.
A photo was excluded if:
The lighting in the photo was significantly altered
The quality of the photo was bad(blurry or granular)
The photo was large enough to be clearly visible (all pictures under 16 kilobytes were excluded).
The photo included situational cues about the age of the person, such as photos from parties or graduations.
The photo included more than one individual (except if it was possible to crop out one person).
The photo was in black and white, or had a filter (photos with minor editing was acceptable in case it did not significantly affect the quality of the picture and did not fade out facial features).
The person in the photo was a famous celebrity (e.g., Justin Bieber, Selena Gomez, Emma Watson and Miley Cyrus). Also, photos of individuals on the red carpet, on a runway, or in other film festival-like conditions were excluded, as were photos featuring microphones in front of the face.
The individual in the photo was wearing any kind of costume or accessories covering the face.
The individual in the photo was doing a gesture next to the face (e.g., a peace-sign).
The photo was partly or fully covered with a digital.
The gender of the individual in the picture was unclear.
In case there were two or more photos of the same person, only one of them was included. A photo where the individual had a neutral facial expression was preferred over one where the individual was smiling. If both or all pictures were neutral or smiling, the choice was based on quality, lighting and (a low) amount of editing. The pictures were cropped to include mainly the face, not a torso of the person. Also, if the background of the picture could easily distract the estimator from the task of age estimation (e.g., including furniture and other objects, other people, or a broad scenery), the picture was cropped. Permission to crop some of the photos was obtained from the owners of the database.
From the NIMH Child Emotional Faces Picture Set (Egger et al., Citation2011), where pictures of different facial expressions from nearly all target persons (aged 12–18 years) were included, only one picture of a person was included. Every second picture was chosen as neutral and every second as smiling. In some cases, a database only included neutral or smiling facial expression of a person, and in this case, the available expression was included in the study.
From the Siblings database (Vieira et al., Citation2014), all pictures where the person was 12–18 years old were included in the current study.
Appendix B
Figure B1 Histogram showing the number of participants by participant age.
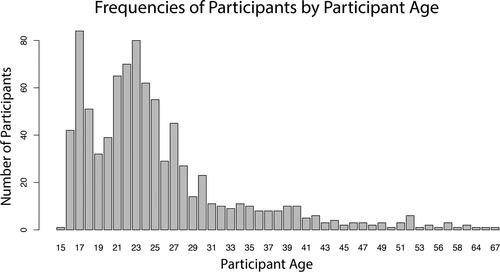
Table B1 Percentage of Responses Indicating a Probability Rating of > 50 that the Target has Turned 16 or 18 Years Old by Participant and Target Gender.