
ABSTRACT
The increasing volume of images published online in a wide variety of contexts requires communication researchers to address this reality by analyzing visual content at a large scale. Ongoing advances in computer vision to automatically detect objects, concepts, and features in images provide a promising opportunity for communication research. We propose a research protocol for Automated Visual Content Analysis (AVCA) to enable large-scale content analysis of images. It offers inductive and deductive ways to use commercial pre-trained models for theory building in communication science. Using the example of corporations’ website images on sustainability, we show in a step-by-step fashion how to classify a large sample (N = 21,876) of images with unsupervised and supervised machine learning, as well as custom models. The possibilities and pitfalls of these approaches are discussed, ethical issues are addressed, and application examples for future communication research are detailed.
Communication research increasingly acknowledges the need for methods able to address the ever-growing datasets derived from online communication, including news articles, social media posts, and website content. Most of these discussions have focused on automated content analysis methods aimed at large datasets of text (e.g., Burscher et al., Citation2014; Jacobi et al., Citation2016; Trilling & Jonkman, Citation2018). However, the Internet has prompted a “visual turn” (Boxenbaum et al., Citation2018), exacerbated by the popularity of platforms where images are the primary content, such as Instagram or Pinterest. Images are increasingly relevant for research across a wide variety of fields, for example, how organizations use visuals to construct meaning, legitimacy, and frame relevant issues (e.g., Christiansen, Citation2018; Cornelissen & Werner, Citation2014), regarding the influence of visuals on framing effects (e.g., Powell et al., Citation2015) and in political communication more broadly (Schill, Citation2012), or in relation to user-generated content about brands (e.g., Presi et al., Citation2016).
The “visual turn” also comes with an upsurge in the volume of visuals published online. Thus, commercial methods for automated image recognition have been developing at tremendous speed in the last years (Jordan & Mitchell, Citation2015). Computers have become as good as a three-year-old in recognizing image contents within roughly 6 years (Savage, Citation2016). Algorithms designed to automatically analyze the content of images often build upon deep learning approaches, and go under different names such as image recognition, machine, or computer vision, or image classifiers (for an overview for computer vision usage for research in social sciences, see: Joo & Steinert-Threlkeld, Citation2018). All major technology organizations are involved in the development of computer vision systems and offer these systems commercially through Application Programming Interfaces (APIs). Given that commercial computer vision algorithms on the market are not built for communication research purposes but rather to detect faces in images, flag offensive content, recognize logos, or identify product characteristics that are often used for corporate or surveillance applications, their output is not readily usable for communication research. Thus, this article proposes a protocol to use the output of these commercial computer vision pre-trained models for communication research. Recent studies show that big data approaches using machine learning provide an opportunity for communication research to increase the breadth and depth of extracting content from larger amounts of images (Boxell, Citation2018; Peng, Citation2018; Peng & Jemmott, Citation2018; Xi et al., Citation2020). However, an overview and comparison of techniques to analyze big image data using commercial computer vision APIs is missing.
One could argue that, instead of using ready-made commercial applications, researchers could train a classifier for (each) research purpose. However, since developing a computer vision algorithm requires access to (relatively) large sets of human-coded pictures, computing power, and some level of familiarity with programming, communication researchers interested in large-scale image analysis may be better off – we argue – evaluating first the extent to which existing pre-trained models may be sufficient to answer their research questions before dedicating time and resources in training their own (potentially single-use) classifiers.
To render the output of computer vision APIs usable for research in communication studies, we developed a protocol to facilitate the wrangling of big image data sets. We tested four approaches to cope with computer vision output apt to research undertakings of inductive or deductive nature. Using the example of corporations’ website images on sustainability communication, we show how to classify a large number of images (N = 21,876) in an unsupervised and three supervised approaches (expert-driven, machine-driven, API training) based on the manual coding of a subsample (N = 868). Our findings suggest that, for our case study, a supervised machine learning approach using the labels provided by the computer vision APIs as an input is the most accurate and precise take for image classification. Moreover, we propose a protocol to help researchers explore how unsupervised or supervised machine learning options using computer vision APIs as their input can help with automated visual content analysis of theory-driven categories.
In the following, we briefly outline the development of computer vision and present a comparison of three applications of major companies (Google, Microsoft, Clarifai). Afterward, we present different approaches to analyze images large scale by outlining general considerations along with an application example covering data sources, data collection, coding and automated content analysis, and results and interpretations. Based on a sample study about the visual depiction of sustainability on corporate websites, we explore which are the different results in terms of precision and recall of each approach. We then discuss the advantages and disadvantages of each approach and briefly review some ethical issues. We conclude by providing an outlook for future research with this rapidly developing technology in different domains of communication research, before ending with general conclusions.
Automating Content Analysis in Communication Research
Text-based Content Analysis
Text-based content analysis allows researchers to segment, categorize, code, and analyze datasets automatically (Burscher et al., Citation2015; Kobayashi et al., Citation2018; Scharkow, Citation2013; Schmiedel et al., Citation2019), in response to increasingly larger (textual) datasets critical for communication research. These larger datasets require researchers to scale up their content analyses (for a discussion on the need to scale up content analysis instead of using smaller samples, see Trilling & Jonkman, Citation2018). Quantitative content analysis of text (Kobayashi et al., Citation2018) has constantly been developing toward more automated methods of analysis (Boumans & Trilling, Citation2016; Duriau et al., Citation2007). Automated content analysis is mostly used in communication science, media studies, and political science to describe a range of methodologies to automatically categorize text, from simpler word/term frequencies to unsupervised methods (Boumans & Trilling, Citation2016).
Quantitative content analysis has been defined as “the systematic assignment of communication content to categories according to rules, and the analysis of relationships involving those categories using statistical methods” (Riffe et al., Citation2014, p. 3). Deductive approaches to automated content analysis include dictionary methods, which originated in linguistics and have been around since the 1950s. Here, predefined lists of words correspond to content categories such as different psychological factors and emotions (Tausczik & Pennebaker, Citation2010) or semantic classes such as positive and negative tone and values (Stone et al., Citation1966). In dictionary-based analysis, categories or classes are said to apply when specific words or word-combinations are present and/or absent in a piece of text.
Another way of content analyzing large amounts of text automatically is to start from a set of texts that have been manually coded (deductively) and use supervised machine learning as a way to potentially replicate the coding to new, unseen texts. Here, an algorithm is trained on a set of human-coded training texts for a wide variety of applications, such as distinguishing fake from real customer reviews (Kumar et al., Citation2018) or predicting categories such as policy issues (Burscher et al., Citation2015). This training entails algorithmically figuring out which words relate to pre-defined labels given for the input data. Since supervised machine learning requires hand-coded (labeled) text as an input, it is also considered a bridge between non-automated and automated content analyses (Scharkow, Citation2013).
In addition to these deductive methods of automated text analysis, topic modeling has evolved as one of the most used approaches of unsupervised machine learning for texts, often in the form of Latent Dirichlet Allocation – LDA – (Blei et al., Citation2003). With LDA topic modeling, large amounts of unstructured text data can be mined to extract common topics, where each topic represents a probability distribution of words (Maier et al., Citation2018). Jacobi et al. (Citation2016), for instance, analyzed the news coverage on nuclear topics since World War II to identify temporal dimensions and trends of topics.
Visual-based Content Analysis
Despite this constant development in the automation of text analysis, visuals have not received the same attention. For visuals, analysis has often relied on manual coding and/or qualitative analyses not feasible for large data sets (Hellmueller & Zhang, Citation2019; Joo et al., Citation2019; Serafini & Reid, Citation2019). If included in content analysis studies, images were usually coded manually and/or researched from an interpretative paradigm (Hellmueller & Zhang, Citation2019; Serafini & Reid, Citation2019). That said, research has engaged with a quantitative content analysis of images, for instance, to identify image frames in the climate change discourse (e.g., Rebich-Hespanha et al., Citation2015) or television coverage of presidential campaigns (Bucy & Grabe, Citation2007). These quantitative attempts are accelerating with the adoption of automated analyses of visuals.
Automated approaches to image analysis have been developed and applied quite recently in a variety of disciplines in the humanities and social sciences. Art historians have used computer vision to identify analogies in large samples of art-related images (Rosado, Citation2017) or to retrieve artworks from an existing database of paintings (Lang & Ommer, Citation2018). In the social sciences more broadly, for example, a study has employed computer vision to estimate the size and dynamics of human crowds (Aziz et al., Citation2018). In psychology, Reece and Danforth (Citation2017) applied computer vision APIs to analyze over 43,000 Instagram images for features that may predict depression in users. In economics, these APIs have been employed, for example, to predict the perceived safety of cityscapes (Naik et al., Citation2016).
In the broader field of communication science, researchers have also started applying computer vision APIs. For instance, the circulation of visual content across social media platforms was investigated with the help of the Google Vision API to locate images on the web (D’Andrea & Mintz, Citation2019). Investigating the factors influencing likability and shareability of visual social media content, Peng and Jemmott (Citation2018) used automated visual content analysis to analyze food images. Marketing researchers have predicted an image’s appeal to consumers based on automatically extracted features such as color, composition, or content (Matz et al., Citation2019). In political communication, computer vision was applied to detect gestures, facial expressions, and emotions in presidential candidates (Joo et al., Citation2019) or the political ideology of legislators (Xi et al., Citation2020). In the same context of the US elections 2016, Peng (Citation2018) found a media bias in the visual portrayals of candidates, as certain attributes of the images (categorized by computer vision APIs) were consistently different between partisan news outlets, while Boxell (Citation2018) also investigated similar trends across the election cycle.
These examples show that automated content analyses of large visual data are apt in describing communication phenomena linked to novel developments in the (digital) communication arena such as the “visual turn.” Following the argument by Slater and Gleason (Citation2012, p. 228), such content analyses are a starting point to build theory on the nature of the underlying concepts (e.g., media bias; Boxell, Citation2018; Peng, Citation2018) and to provide a basis for research on the effects side (e.g., Peng & Jemmott, Citation2018).
Recent Developments in Computer Vision
The sophistication of pre-trained computer vision models to match human judgment (Russakovsky et al., Citation2015) has only been evolving recently with so-called deep learning algorithms, in particular convolutional neural networks (Krizhevsky et al., Citation2012). This is also associated with the usage of the ImageNet project, a database of approximately 14 million web images that were annotated by humans, a process referred to as “ground truth labeling” (Russakovsky et al., Citation2015), through crowd working to be used for algorithm training (Deng et al., Citation2009). With the help of ImageNet and similar databases as well as increasing levels of computing power, deep learning algorithms could be trained to become, in 2015, as good as a three-year-old in identifying content from images (Savage, Citation2016). Such algorithms step through different layers repeatedly to determine the likelihood of a visual feature to appear. This approach has marked a leap in the accuracy of computer vision models (Bohannon, Citation2014; Krizhevsky et al., Citation2012). Models trained with deep learning algorithms are able to detect objects in images at different granularities (Wang et al., Citation2014). Thus, computer vision APIs may extract, we argue, what Searle (Citation2015, p. 113) calls – generally regarding humans – “basic perceptual features [which] are ontologically objective.”
After being trained, computer vision models can be applied to large sets of images, with the objective of classifying these images according to the features that were available in the original dataset used for model training. Often, these features are general concepts that may be associated with the image (labels), such as “dawn,” “outdoors,” or “customer,” being highly dependent on the original dataset used to train the model, with ImageNet being a frequent source. Some models are more specific, recognizing, for example, the presence of logos, or, more commonly, detecting human faces, or even emotions, age, or gender of the faces appearing in the image.
Given the volume of images needed to train a computer vision model and the resources and technical expertise necessary, it is often not feasible for communication researchers to develop a custom computer vision model for their specific research context, especially when the concepts they need to categorize go beyond manifest items. Moreover, such a specific tool would only be applicable to one narrow research purpose, disproportionate to the investment needed for development. Therefore, it seems feasible to refer to existing pre-trained computer vision models to academic research questions.
We focus on the potential of using commercial computer vision applications, such as Clarifai, Google Cloud Vision API, and Microsoft Azure Computer Vision API, for large-scale image classification. All of these APIs classify images by providing potential features for each image, as well as additional information. They can differentiate between specific objects in an image such as people, animals, or logos, extract colors, emotional states of people such as joy or sadness, and recognize text. Since these commercial APIs develop speedily, a comprehensive list of what they are able to detect would be outdated by the time of writing. Moreover, apart from the computer vision APIs’ pre-trained models, Clarifai and Microsoft also offer the option to train custom models with pre-categorized data provided by researchers.
It is important to note that relying on (pre-trained) computer vision models, however, poses challenges to communication researchers. First, these models often cannot detect complex concepts beyond the objects that are in the picture. For instance, an image by an insurance company from this study’s sample shows two women drinking coffee in front of a large window that views on skyscraper office buildings. For this image, one computer vision API gives features such as coffee, daylight, photograph, red, window, and woman. Without aid to interpretation, these features are not meaningful for research, but at the same time, they are meaningful enough to be subjected to interpretation. Since basic perceptual features in the form of labels such as “business” or “woman” do not give communication researchers a lot of insight into communication phenomena per se, there is a need to develop, starting from the output of these computer vision models, an approach that makes these data usable for research purposes.
In doing so, however, researchers face a second challenge: they cannot access the classification and basic labeling structure of pre-trained models – especially commercial computer vision APIs, because this data and the specifics of the pre-trained models are deemed proprietary. Researchers, thus, have to cope with the results of a black box when feeding images into an API. As a result, the output of these APIs may not fit directly with the theories and concepts relevant to communication researchers, either because of task (e.g., recognizing common objects), domain (e.g., website pictures), or genre (e.g., holiday pictures) differences.
With these challenges in mind, we propose an approach leveraging established methods from quantitative content analysis (Krippendorff, Citation2018), unsupervised (Kobayashi et al., Citation2018), and supervised machine learning from text (Burscher et al., Citation2014), to use these commercial computer vision APIs for large-scale visual content analysis focusing on categories theoretically relevant for communication research. The approach developed in the remainder of the paper does not require sophisticated programming skills but provides a research protocol to make use of the output of computer vision APIs for the social and particularly communication science. It is important to note that, when using this approach, researchers are relying on a process of automatically labeling visual information that reduces rich visual information to a set of words. More specifically, the APIs take images as input and condense them into a set of features – e.g., concepts or objects detected –, which are then used as input for the subsequent stages of the content analysis.Footnote1 While the approach proposed below helps, we argue, to identify pre-defined theoretically relevant concepts in images, it is also limited – as it is restricted to what the APIs can detect.
A Research Protocol for AVCA with Computer Vision APIs
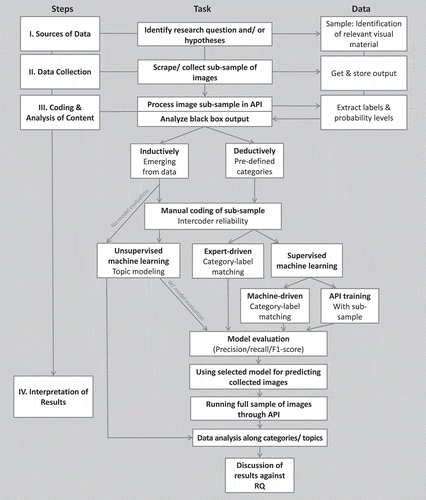
Large-scale image analysis with computer vision APIs is a form of automated content analysis and needs consideration of four steps inherent to all content analyses (Duriau et al., Citation2007): (1) data sources, (2) data collection, (3) coding and analysis of content, and (4) interpretation of results. Since coding and data analysis cannot always be separated in AVCA, we regard them as one major step. Next to this classic procedure, there are two diametrical approaches to machine learning on a spectrum from inductive to deductive methodologies that this protocol covers: unsupervised versus supervised methods (Boumans & Trilling, Citation2016; Schmiedel et al., Citation2019). gives an overview of the protocol.
Figure 1. A research protocol of using computer vision APIs for communication research
For each step of the protocol, we outline general considerations and provide an example from a sample study in the context of sustainability communication.Footnote2
Sample Study
Companies are one of the most powerful actors in global sustainable development (UN, Citation2017) and bear responsibility for their actions regarding people, planet, and profits (Elkington, Citation1998). This classic tripartite concept of sustainability calls on companies to equally treat people, planet, and profit in their business to maintain the “license to operate” in society (Donaldson & Preston, Citation1995). To communicate their sustainable strategies and business practices, companies refer to corporate websites for informing stakeholders regarding their triple bottom line commitment (Seele & Lock, Citation2015). Thus, they are important means for engaging cynical stakeholders with corporate sustainability practices. While website texts regarding sustainability have been in the focus of some research (e.g., Tang et al., Citation2015; Wanderley et al., Citation2008), visuals been less frequently studied. Hence, with the proposed research protocol at hand, we aim to investigate to what extent the website images of the 24 most profitable companies in Europe reflect the triple bottom line (people-planet-profit).
Step 1. Identifying Data Sources
General Considerations
The sources of data for automated image analysis are dependent on the research question at hand. While news articles are a potential source (e.g., Peng, Citation2018), just as TV programs (Joo et al., Citation2019), or social media platforms such as Twitter (e.g., Casas & Williams, Citation2019) or Instagram (e.g., Reece & Danforth, Citation2017). Furthermore, since images are usually larger in file size than text documents, facilities to store and readily access the files are necessary (Wenzel & Van Quaquebeke, Citation2018). Thus, the more concretely the research question specifies the concept of study and in consequence the unit of analysis, the more feasible in terms of cost and computing power a computer vision study will be.
Sample Study
Images are key in online communication: they enhance information processing, memory, and emotions (De Haan et al., Citation2018), and serve as an entry point to media content (Kress & Van Leeuwen, Citation1996). For this sample study, focusing on Europe’s largest corporations’ visual sustainability communication, we analyzed the website images of the 25 most profitable European companies (Forbes, Citation2017; see Appendix ). We selected websites as the source of our data for this study given their role as “business cards” of organizations (Kent & Saffer, Citation2014), their heavy reliance on visuals and given earlier research indicating that websites are one of the most important channels for communicating sustainability to stakeholders (Seele & Lock, Citation2015).
Step 2. Data Collection
General Considerations
Collecting images can be tedious. Extracting images from (digitally) printed documents such as annual or sustainability reports (Benschop & Meihuizen, Citation2002; Lock & Seele, Citation2015) in the form of PDFs is often a manual exercise where the researcher needs to tag and save each image separately. For computer vision projects with large amounts of images, this is not feasible. Accessing digital images on websites requires scraping – i.e., automatically extracting and possibly storing images to a database. However, since websites are built with different designs and architectures, researchers may need to adapt the scraper for every single website (in case of a cross-sectional study). For researchers interested in news imagery, for instance, to view the effects of mediatization on organizations (Jacobs & Wonneberger, Citation2017; Pallas & Fredriksson, Citation2013), databases such as Factiva can be accessed to download images or, alternatively, the news media archives of interest.
Retrieving images on social media platforms is challenging, because access possibilities to the platforms are changing rapidly in light of ongoing privacy discussions. Therefore, researchers are advised to check access options of APIs of social media platforms before narrowing their research focus (see also Braun et al., Citation2018), especially given ongoing discussions about the restrictions and increasing limitations associated with this option (Freelon, Citation2018; Halavais, Citation2019).
Once relevant images have been identified and the feasibility of data collection has been established, the data needs to be stored. Many academic institutions offer the possibility to store, access, and process data in institutional databases. Alternatively, commercial applications are available.
Sample Study
To explore the proposed research protocol in full, we focused on the corporate websites of the 25 most profitable companies in Europe (Forbes, Citation2017), of which one (Banco Santander) did not have an English-language website and was thus excluded. We started from the companies’ main URLs of the English-speaking website versions. Since the sample contained companies from different industries, we excluded product-related pages (see Appendix ). A total of 32,662 pages of these websites were scraped, identifying 90,832 unique images. Out of these, a total of 21,876 unique images were collected from the 8,181 pages located in non-product-related sections of each website. A random sample of 943 images was selected to demonstrate the protocol (on average 37.7 images per company). Given different specifications of the computer vision APIs (see below), the final sample resulted in N = 868 images.
Step 3. Coding and Automated Content Analysis
General Considerations
While classic quantitative content analyses begin with the development of a codebook to extract relevant data from text or images in the form of dimensions and categories (Krippendorff, Citation2018; Riffe et al., Citation2014), AVCA starts from the features that the APIs detect. To receive this output, researchers need to decide which computer vision API to use. The market of computer vision APIs is evolving quickly. For this protocol, we decided to focus on the three publicly available computer vision APIs available in late 2018: Google Vision API, Clarifai API, and Microsoft Azure Computer Vision API. Before selecting one of them, researchers should carefully consider the information they need to retrieve for their research questions and use the demo versions to scan the output.
This output comes in the form of features per image out of a black box as the underlying “codebook” of the classifiers is considered proprietary information. However, with the features and their probability levels and other information from text recognition within the images or the descriptions of images as provided by Microsoft, we can start analyzing these basic perceptual features (Searle, Citation2015) in an inductive as well as deductive fashion. The inductive approach boils down to unsupervised machine learning, whereas the deductive approach considers two methods of supervised machine learning as well as an expert-driven approach that entails manual categorization of labels. For the deductive approaches, a gold standard of manual coding is necessary against which to assess the experts’ or machine-driven classifications (Hillard et al., Citation2008). To do so, the researcher needs to develop a codebook with categories and dimensions of interest (Riffe et al., Citation2014). Researchers then manually code a subset of images that reflects the categories in which the images are supposed to be classified. These training data set needs to be coded reliably along the developed codebook by at least two coders independently as known from classic non-automated quantitative content analysis (for further guidance on codebook development and reliability testing, see e.g., Krippendorff, Citation2018; Riffe et al., Citation2014).
Sample Study: Manual Coding
We manually coded a sample of 943 images to compare the outputs of the expert-driven, machine-driven and API-training approaches to AVCA. Two coders, an undergraduate and a graduate student – who were not involved in the development of the codebook – coded the images in December 2017 using a custom-built web interface. The codebook included the three pillars of sustainability – people, planet, profit – as not mutually exclusive categories. The codebook is part of a more detailed codebook of sustainability images that were developed based on previous research and organizational sustainability guidelines (GRI, Citation2015; Lock & Seele, Citation2015; Rebich-Hespanha et al., Citation2015; see abbreviated coding sheet in the appendix). The coders initially pretested the codebook on approximately 12 images per company in the sample (n = 296) and the codebook was revised thereafter for a final version that contained the three categories people, planet, profit, and a category “other.” With this final codebook, intercoder reliability was calculated on a random subsample of 100 images. The reliability results were good for the categories People (Krippendorf’s ⍺ = 0.82, average agreement = 91%), and Planet (Krippendorf’s ⍺ = 0.78, average agreement = 92%). For the category Profit, the reliability levels were borderline (Krippendorf’s ⍺ = 0.58, average agreement = 79%), demonstrating the difficulty of coding certain categories, even with human coders. As the objective of this study is to illustrate the usefulness of the protocol, we decided to also include this category in the comparison with computer vision, also as a way to explore how a category with lower levels of (human) intercoder reliability would fare with computer vision. A new set of images (N = 200) was coded in a second step, to be used as a test set – as outlined below.Footnote3
Sample Study: Computer Vision API Processing
Images larger than 20 × 20 pixels were fed to three computer vision APIs, namely Clarifai, Google Cloud Vision, and Microsoft Computer Vision API in spring 2018. For Clarifai, the model general-v.1.3 was used, whereas for Microsoft, the version 1.0 of the Vision API was taken – and only images larger than 50 × 50 pixels were categorized due to the requirements of this API. For Google, the latest version of their APIs was used (v1 at the time of the categorization). To ensure that all classifiers could be compared, we only included images that had features detected by each of the three computer vision APIs, leading to a final sample of 868 images, with an average of 36.17 (SD = 6.25) images per company. Each computer vision API was used as follows:
Clarifai. The output of the categorization, i.e., concepts that include objects, themes, moods, among other concepts,Footnote4 was stored, along with their probability (likelihood) values. The most frequent concepts in the sample were business, people and adult.
Google. Three different classifiers were used from the Google Cloud Vision API. First, the label detection classifier was used to categorize the images. This classifier, similar to Clarifai, assigns categories for images.Footnote5 The most frequent categories were product, font, and text. Second, we used the logo detection classifier. This classifier detects product logos present in images.Footnote6 The most frequent logos in the sample were Siemens, Zurich Seguros and Total S.A. Finally, the face detectionFootnote7 classifier detected the presence of faces, as well as the likelihood of emotions (anger, joy, sorrow, surprise) as well as other features (headwear, blurred, underexposure) associated with the faces detected. Approximately 31% of the images in the sample had at least one face present, with an average of 0.49 (SD = 1.25) faces detected per image. All faces detected in each image were aggregated into (a) one variable describing the number of faces detected and (b) a set of variables describing the minimum, maximum, and average likelihood of each of the face-related features (anger, joy, sorrow, surprise, headwear, blurred, underexposure).
Microsoft. Three classifiers from the Microsoft Cognitive Services – Computer Vision API were taken. First, the Category classifier assigned the likelihood of each image belonging to one of Microsoft’s taxonomy 86 of different categories.Footnote8 The most frequent categories were others_, outdoor_ and people_. Second, the Tags classifier was used, to identify the presence of approximately 2,000 objects, living beings, scenes, or actions recognized by the classifier.Footnote9 The most frequent tags were person, indoor, and outdoor. Finally, the Face classifier detected the presence of faces, as well as the gender and potential age of each of the faces.Footnote10 This classifier found less faces than Google, with approximately 24% of the images containing at least one face, and an average of 0.33 (SD = 0.85) faces per image. Of all faces detected to which a gender could be attributed, 36% were categorized as female. The average age per image was 40.25 (SD = 13.37). All faces detected in each image were aggregated into (a) one variable describing the number of faces detected, (b) two variables indicating the total amount of female and male faces detected, and (c) a variable indicating the average age of the faces detected.
Splitting the Sample – Training, Validation and Test Sets
To ensure an adequate comparison across platforms and approaches, we split the manually coded sample in a training set (90% of the images, N = 781) and a validation set (10% of the images, N = 87). The frequencies of the target variables were at approximately similar levels in both the training and the validation sets (People: 59% and 46%, respectively; Planet: 22% and 21%; Profit: 55% and 53%). The training set served both to train the supervised machine learning models, and as the source data for training the custom computer vision API models (using Clarifai custom models). The validation set was used to evaluate the performance of the approaches outlined in the protocol (expert-driven, supervised, and custom models). As indicated earlier, an additional set of images was coded to be used as a final test set.Footnote11 As such, we adopt the best practices and terminology suggested by Russell and Norvig (Citation2016, p. 709), namely that a training set is used to train machine learning models, a validation set is used to fine-tune these models (e.g., which parameters are used, how the models compare with each other), and a test set is used as the final, independent evaluation of the performance of the selected model. In the next sections, we provide an overview of each approach, and discuss its performance when comparing to the validation set. In the final section, we discuss the performance of the best-performing model of each approach against the test set. The performance of the classifiers is evaluated based on recall, precision and F1 scores (Burscher et al., Citation2015). Recall refers to the proportion of predicted documents that are actually relevant to the search; precision is the proportion of documents where the predicted presence – or absence – of a label was correctly classified. However, improving one often is at the expense of the other. Thus, the F1 score gives an overall estimation of classifier performance as it is the harmonic mean of the two criteria.
Inductive Approach: Unsupervised Machine Learning as Topic Modeling
General Considerations
An inductive approach to analyzing the output of computer vision classifiers can make use of unsupervised machine learning techniques. One of these techniques is topic modeling, frequently used for quantitative analyses of text (Blei et al., Citation2003; Burscher et al., Citation2014). Such an approach is useful when the researcher has no preset expectation of what a dataset is about, does not want to or cannot anticipate complex interrelations, and thus seeks exploration of texts. Thus, it is suitable for large-scale inductive analyses (Schmiedel et al., Citation2019).
In topic modeling, an algorithm identifies patterns of words across texts based on relational word co-occurrences using word distributions (Jacobi et al., Citation2016). Social science researchers have often made use of probabilistic topic models such as Latent Dirichlet Allocation (LDA) algorithms to identify a predefined number of topics in documents (Blei et al., Citation2003). This method overcomes the weakness of traditional clustering approaches such as principal component analysis in that it allows words to “load” on more than one factor. Topics are co-occurring sets of words within texts and each text may contain several topics flagged with the probability of topics per text (Schmiedel et al., Citation2019).
In the current paper, we explore the application of topic modeling to large sets of labels for images, as it might allow the identification of recurring topics based on the labels provided by computer vision classifiers. The labels per image are taken together as if they were the text (or rather keywords) describing each visual. Thus, the LDA algorithm can identify topics across a large set of images if the researcher is curious to explore their contents. Just as in document-based topic modeling where researchers, for instance, identified topics associated with stock-listed companies (e.g., Strycharz et al., Citation2018), the interpretation of the resulting topics is up to the researcher (Jacobi et al., Citation2016). Here, construct validity can be tested via several statistical measures such as semantic coherence. For reliability of topics, however, several researchers need to take a qualitative look into the data to establish that their conceptions are consistent. It is important to reinforce that the choice of LDA topic modeling here is just one of the many options that researchers can make when it comes to unsupervised machine learning. We use it here as an illustration of unsupervised machine learning more broadly.
Sample Study: Methods
For this unsupervised approach, we used the features provided by the three APIs (Clarifai, Google and Microsoft) as an input to LDA topic models. Because topic models require actual content (and cannot work with likelihood values as an input), we ran separate models with features that had any likelihood (which is the equivalent of the binary dataset approach), and with likelihood levels above 0.70, 0.90, or 0.95. We also tested different minimum threshold values for the frequency of each feature (any frequency, or present in at least 5%, 10%, 20%, or 30% of the images). We also tested models with different numbers of topics (3, 4, 5, 10, 15, 20, 25, 30, or 50 topics), and alphas (0.001, 0.01, and 0.05). These different models were created using the Gensim Python package (Rehurek & Sojka, Citation2010). In general, assuming there would be no manually coded images, the next step would be for a human expert to select the model on the basis of interpretability, potentially combining with the coherence metrics of each model. Reporting of results contains the estimates per topic model, the descriptive statistics of topics and their relation to other variables such as source or metadata, which is considered a strength of this method (Schmiedel et al., Citation2019).
Sample Study: Results
Selecting an LDA topic model can be done based on evaluations by the researchers – which would assess which model best describes the underlying data or makes the most sense for the research question at hand – or by means of metrics that are inherent to the model. One of such metrics is overall coherence.Footnote12 By this approach, the best model is one with three topics (overall model coherence of 0.83), also using the three API’s as input. The labels associated most strongly with each topic are outlined below:
Topic 1: clarifai_people, clarifai_adult, microsoft_tag_person, clarifai_man, clarifai_portrait, clarifai_business, clarifai_woman, clarifai_one, microsoft_tag_indoor, clarifai_indoors
Topic 2: google_product, microsoft_cat_others_, google_font, clarifai_illustration, clarifai_desktop, clarifai_design, clarifai_business, google_text, clarifai_symbol, clarifai_no person
Topic 3: clarifai_no person, microsoft_cat_outdoor_, clarifai_outdoors, microsoft_cat_others_, clarifai_travel, microsoft_tag_outdoor, clarifai_sky, clarifai_nature, clarifai_architecture, microsoft_tag_sky
Interpretation of these topics is somewhat intuitive, particularly because we already have some categories in mind (which would usually not be the case in inductive research). Two of the authors interpreted these three topics independently with the same outcome: Topic 1 might reflect the dimension People, topic 2 relates to Profit, and topic 3 can be interpreted as Planet. However, the fact that these topics emerged in this way does not necessarily indicate that they provide a reliable way to classify the images in predefined categories. For that, deductive approaches are needed, as we outline next.
Deductive Approaches: Methods
As opposed to inductive automated content analysis, deductive approaches are the standard in quantitative content analysis studies because they predefine rules along which content is to be interpreted or coded (Krippendorff, Citation2018). In this protocol, we outline three ways to deductively analyze the output of computer vision classifiers: an expert-driven approach of manual categorization and two supervised machine learning methods. The results of each approach for the validation set are compared against each other and therefore reported in the section “Deductive approaches: Comparison of results.”
Performance evaluation of computer vision APIs is based on recall, precision, and the harmonic average of both, the F1-score, as outlined earlier. While the thresholds that a classification system is supposed to supersede are usually context-dependent, the general goal for a classifier is at least score above chance. Since manual coding is the gold standard, the validity and reliability of the classification largely depend on the validity of the codebook and the intercoder reliability of the training set’s coding (for common thresholds, refer to Krippendorff, Citation2018).
When interpreting the results in light of theory, the findings are compared against the theoretical framework and research questions to assess in how far they confirm, contradict, or extend existing theory. This step is crucial for automated image analysis as computer vision applications only allow for extraction of basic perceptual features (Searle, Citation2015). The hierarchically higher (latent) concepts (Li et al., Citation2010) in the form of topics (unsupervised machine learning), categories (expert-driven), or classes (supervised machine learning), and their interpretation in the larger knowledge structure, however, is crucial for a sound theoretical contribution.
Expert-driven Approach
General Considerations
In the expert-driven approach, the researcher evaluates the labels provided by the computer vision API across the training data set and assigns them to the predefined categories as formulated in the codebook. Thus, this method merges the expertise of the researcher with the black box output provided by the classifiers. Based on the clustering of labels to content categories and given that images usually have multiple labels, images can adhere to several categories in a codebook. Thus, just like the unsupervised approach, the expert-driven method allows for multiple classifications of each case (Schmiedel et al., Citation2019).
To check for construct validity, researchers are advised to assess qualitatively whether the labels also correspond to the image contents. Choosing and checking a random subsample of images per label helps assessing the construct validity of the classifier output, which is necessary as these applications were not built for communication science purposes. In addition, keeping a research diary is valuable to trace outliers and to reflect on the validity of the labels from the classifiers (Nadin & Cassell, Citation2006).
Sample Study
For expert-driven label categorization, we used the 868 images included in the final sample. Two models with different probability levels were calculated (0.7; 0.9). To exemplify the procedure, we present the model with probability level 0.9. All features with a probability level of 0.9 or higher were extracted resulting in 1,475 features. Features that are present less than 10 times in this sample were excluded (1,200). The expert, the second author of this study who is a researcher from the field of sustainability communication, manually categorized the features at face value exclusively to one of the three categories people, planet, and profit. She then checked these decisions with 10 randomly selected images per tag and adjusted them when necessary. This categorization was double-checked with the first author of the study at a continuous basis using a digital workflow. Disagreements on the final categorization were resolved in a final consensus session. A total of 257 features could be categorized, of which 24 in profit, 16 in planet, and 51 in people. To assess construct validity of these features, we selected 10 images per categorized feature to checked qualitatively by the expert coder. In most of the cases, the feature corresponded to the image contents. Directly observable, manifest constructs such as “tree” (planet) or “boy” (people) are validly detected by the computer vision API, while more latent constructs such as “tourism” do not always correspond to the image contents. Furthermore, some features may have different meanings: “field,” for instance, can indicate an agricultural field, a green lawn, and a soccer field; “race” can refer to ethnicity or a car race. Other features do not directly reflect the image content, but nonetheless the classification to one of the three categories appears to be correct (e.g., “luxury” as being related to the profit category: shows offices or meeting rooms, but no luxury goods as expected). Some features were excluded, because the consulted images did not reflect the feature’s meaning (e.g., “vertebrate” as being potentially associated with planet actually mostly showed people).
Supervised Machine Learning: Machine-driven Approach
General Considerations
Supervised machine learning has been used in automated text analysis in the social sciences (Scharkow, Citation2013). These models automatically classify texts into predefined classes. To learn the patterns for classification, the model needs a “training set” of texts. Such a gold standard is derived by manually coding a subset of the sample into classes. Based on this training set, the model automatically classifies unseen documents of a “test set” into the predefined classes by replicating the coders’ decisions (Hillard et al., Citation2008).
Supervised machine learning techniques as discussed here, for instance, in the form of support vector machines (for details, see Hillard et al., Citation2008), use a bag-of-words approach that refers only to word frequencies and not word order, and thus do not assume syntactic structures in the text (Manning & Schütze, Citation1999). Therefore, they can be readily applied to image labels that do not follow a syntax but are composed of nouns or adjectives. The bag-of-words approach has been applied to image classification since quite some time in computer science (Tsai, Citation2012). The idea is to create a visual vocabulary in the form of a vector that contains the frequency of each label per image can be created. These vectors serve as input (Li et al., Citation2011) for the model to learn the relation between the visual vocabulary vector and the manually coded labels provided in the training set, after which it can be used to automatically classify the images in the test set so they can be evaluated for correct classification (Hillard et al., Citation2008).
Sample Study
For the supervised machine learning approach, we used the 781 images available in the train set to train a set of potential classifiers, which had their performances compared against their ability to correctly predict the categories for the 87 images available in the test set. All steps were executed using the Scikit-Learn package (Pedregosa et al., Citation2011). We ran separate models for each sustainability dimension (i.e., people, planet, and profit) as a binary variable, as one single image may portray more than one dimension. We also tested each computer vision API separately (i.e., only the results provided by Clarifai, Google, or Microsoft, separately), or all of them combined (all features included in one single dataset). When it comes to the actual features provided by the APIs, we created two types of datasets: one in which the features for each image were stored as binary variables (i.e., feature present, or not) and another in which the likelihood values provided by each API for each feature (when present) were used as the actual variable. We tested the performance of five different classifiers available in Scikit-Learn: Multinomial Naive Bayes (MNB), the Support Vector Classification (SVC, an instance of a support vector machine), the Gradient Boosting Classifier (GBC), linear models with Stochastic Gradient Descent (SGD), and the Passive Aggressive Classifier (PAC). To maximize the performance, we ran a grid searchFootnote13 to optimize the most common parameters available for each classifier. We ran three sets of grid search, aiming at the best-weighted F1-score, best F1-micro score, and best F1-macro score.Footnote14 In total, we ran 360 models – 120 per dimension. They are evaluated based on their F1-scores as well as their precision and recall in the results section.
Supervised Machine Learning: API-training
General Considerations
As an alternative to the classic machine-driven supervised machine learning technique to classify images, we propose to train a custom classifier as offered against a fee by Clarifai (see ). These models use the manually coded input from the training set to predict a custom model according to the content categories established in the codebook. Since these services are relatively new on the market, they may provide an alternative for the above-mentioned classic supervised machine learning approach. Training a custom model could hypothetically result in higher precision and recall and thus be valuable for communication research. However, the algorithms used for these models are not known to the researcher.
Table 1. Metrics for the best-performing model per method: validation set
The images needed per content category (i.e., what one is trying to detect in the content analysis) to train the custom model are few – Clarifai suggests starting with 10 per category and adds more if needed.Footnote15 Based on this input, the custom model is trained to automatically classify images according to content categories. As in the supervised approach, model performance is evaluated against precision, recall, and F1-score. As a result, communication researchers can assess whether the APIs are able to identify the content in the images necessary to provide insights into their research questions.
Sample Study
For our example, and to ensure comparability with the other samples, we have used the 781 images in the train set as training examples for the custom Clarifai classifier, and evaluated its performance using the 87 images in the test set.
Deductive Approaches: Comparison of the Results
Validation Set
The four deductive approaches proposed above ultimately generate classifiers (trained models) that can provide the likelihood that a new image – not included in the training set – belongs to a certain category. The performance of this classifier is measured in terms of its precision, recall, and F1-score when trying to categorize the images in the validation set, a set of manually coded images that were used for evaluation purposes during the training of the classifiers, but not provided directly as training material.
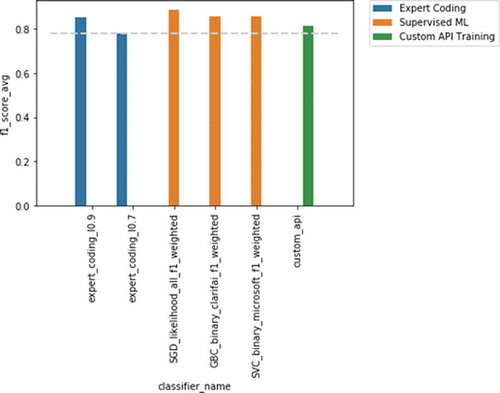
The F1-scores of the best-performing models for each deductive method per sustainability dimension against the validation set are shown in . In general, the supervised approach – using the labels provided by each computer vision API – provides the best performance, followed by the custom training. The F1-scores of the expert coding approach had lower performance levels in general, being only on par with the other methods for one of the three sustainability dimensions. has the detailed performance for the best model per method.
Figure 2. Results for profit
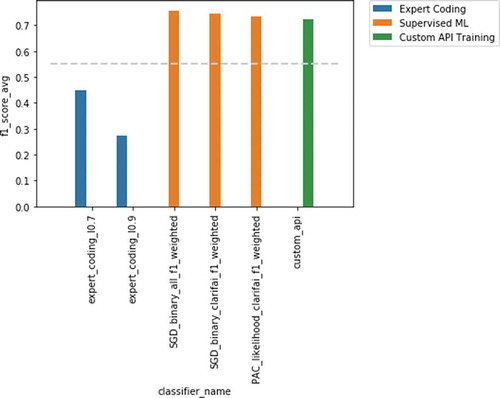
Figure 3. Results for people
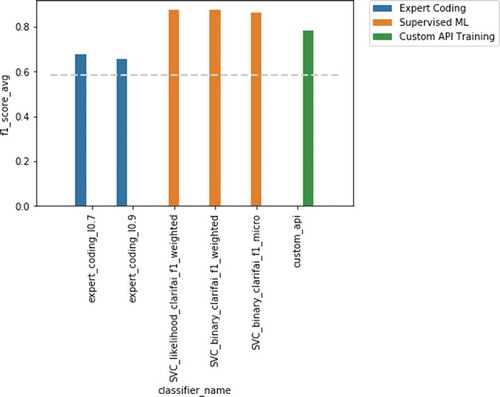
Figure 4. Results for planet
Results: Test Set and Full Sample
The results reported above compare the performance of the different approaches for using computer vision for automated visual content analysis, using a random sample of images that were manually categorized (N = 868). After this analysis is completed, the best-performing models trained for each category – here, the sustainability dimensions People (Supervised ML, with SVC algorithm trained on dataset with likelihood for Clarifai), Planet (Supervised ML, with SGD algorithm trained on dataset with likelihood for all APIs) and Profit (Supervised ML, with SGD algorithm trained on dataset with binary variables for all APIs) – can be used to evaluate the final performance against the test set (N = 200) and ultimately categorize the complete sample of images (N = 21,876).
Out of the 200 images manually coded for the test set, 192 could be processed by the computer vision API’s and were added to the final evaluation. This evaluation was only done for the best-performing models for each sustainability dimension, and this set was not used during the training stage. The results, indicated in , show that the performance of the classifiers was lower when compared to the validation set, especially for the Profit dimension (F1test = 0.63 versus F1validation = 0.76). The results were also slightly lower for People (F1test = 0.81 versus F1validation = 0.87) and Planet (F1test = 0.81 versus F1validation = 0.89), yet above 0.8, being therefore generally acceptable for application in a full sample.
Table 2. Metrics for the overall best-performing model: test set
When considering the complete sample, a total of 21,841 images could be categorized (due to API limitations), the distribution of images across the sustainability dimensions is outlined in . Profit is most frequently represented in companies’ images (M = 56%), followed by people (M = 37%), and last planet (M = 17%). It is important to note, however, that not all computer vision API labels available in the full sample were used in this classification, as the classifiers were only trained with the labels found in the training set (whereas the full sample had additional labels). For planet and profit, 2,905 labels were used as features whereas the total features in the full sample were 8,292 (as the best-performing model combined the three APIs), for people this was 1,364 versus 3,351 features (as the best-performing model only used Clarifai features).
Table 3. Frequency of images in the full sample per sustainability dimension (N = 21,841)
Indeed, this result confirms a critical observation by sustainability researcher and first person to coin the concept of the triple bottom line, Elkington (Citation2018). Reconsidering the development of the sustainability concept since its first mention in 1993, he states that the basic idea of the triple bottom line, namely incorporating the social and environmental dimensions alongside – and on an equal basis – with the financial bottom line, has failed. This is reflected in the visual communication about sustainability analyzed here, as the majority of images refer to the profit dimension. Despite the societal trend to discuss climate change and the sustainability of the environment center stage, this does not seem to be reflected in the visual language on corporate websites, as images related to the planet dimension were less prominent.
Discussion
The suggested protocol for AVCA defined an inductive and deductive ways to make use of commercial computer vision APIs for communication research. To answer the question how the website images of Europe’s most profitable companies mirror the triple bottom line (people-planet-profit), we find that profit is most frequently reflected, followed by people, and least often planet. Thus, the business case seems to be reflected most prominently in companies’ visual online communication, while the environmental dimension appears to be underrepresented.
Regarding the proposed protocol, the supervised machine learning approaches showed the best performances overall tested sustainability dimensions. Supervised machine learning requires a gold standard of manual coding against which the data can be trained. Thus, the results of the supervised machine learning algorithms can only be as good as the input material (Russakovsky et al., Citation2015), which is highly dependent on a sound codebook and rigorous coding procedure (Krippendorff, Citation2018). The best performing supervised machine learning technique was the machine-driven approach. As evident from -, the outputs of the three computer vision APIs, as well as their combination, resulted in differing performance levels. These APIs are constantly developing and remain a black box. Since they have not been developed for research purposes, communication scholars are advised to run their training data through multiple APIs, try different combinations of output and supervised machine learning algorithms, and determine which one fits their data best.
The second best-performing approach across all dimensions is a customized model trained by an existing computer vision API for the specific research purpose. Here, the researcher seemingly gets the best of both worlds:, on the one hand, the well-trained algorithm based on millions of images, on the other hand, a model that is trained on the specific research design at hand. However, the black box issue remains, because specificities on model building or training are not public. From a scientific perspective, this lack of knowledge is unsatisfactory to say the least. However, based on the results of the application example, the customized models performed well with the input of relatively few images and might thus be an option particularly for smaller scale studies.
The protocol also tested an expert-driven method of analyzing the labels of the computer vision APIs, where the researcher categorizes the output labels by hand. This approach showed inferior performance on most dimensions in the application example compared to all other methods. This suggests that API-provided labels are not easy to interpret in relation to the concepts investigated in this study. Even though supervised machine learning seems to perform better than the expert, a detailed look at the meaning of the labels within the image sample is necessary for the researcher to make sense of the output of supervised and above all unsupervised machine learning models. However, in studies with more elaborate research operationalizations, the expert-driven approach might be an apt choice. In general, communication researchers are advised to take a qualitative look at the output from computer vision APIs to get a good understanding of the applied analyses and results.
Besides these deductive approaches, the protocol also applied an inductive technique of image analysis. Based on experience from quantitative content analysis of text (Burscher et al., Citation2014), the labels of computer vision APIs were run through an LDA topic modeling algorithm, as one of the many options possible for inductively analyzing the data with unsupervised machine learning. This method does not have standard thresholds for the number of topics or alpha levels and thus the researcher has significant leeway on how to run the topic models. This unsupervised machine learning method may be useful for the researcher to get a first impression of an unknown dataset of images for which she has no, or no fixed, preset hypotheses (Schmiedel et al., Citation2019). Yet, researchers are advised to interpret its results with caution, as illustrated by the severe limitations observed in our sample study when comparing against pre-defined categories one would expect to find in the data.
Overall, the results of the application example show that there is no one best approach to AVCA. For our specific context, supervised machine learning models worked best, and had in general acceptable performance levels when compared to the test set, but the choice of method is context-dependent. The beauty of the suggested protocol for AVCA is that all approaches can be combined to single out the best fitting solution to the specific research question. Thus, researchers can get an overview of a big data set of images in an inductive fashion by applying unsupervised machine learning, they can go into the depth of understanding the information that image labels give via the expert-driven approach. The supervised machine learning techniques, even in combination with unsupervised approaches, allow the researcher to classify a large set of images into predefined categories or to train a customized model, and even offer the opportunity to combine unsupervised and supervised techniques to meet the challenges inherent to human coding procedures. Bosch et al. (Citation2019) compared the performance of Google Vision API’s and manual coding and found that in the case of photos, 65% of the tags of the human coder and the API were similar. In further analyses, the study found that similar conclusions result from using either the human or the API tags. With this in mind and the savings in time and money, automated visual content analysis is a worthwhile method for encountering these multiple challenges at a time. Thus, with the suggested Python code, this protocol explicates the process of knowledge generation from big visual data (Wenzel & Van Quaquebeke, Citation2018) and allows for data triangulation with text or metadata (Kobayashi et al., Citation2018).
Limitations
Even though the proposed protocol can help communication researchers perform large-scale content analyses of visual content, some inherent methodological limitations must be considered. First, as alluded earlier, this process implies the reduction of rich visual content into a set of features that can be detected by the pre-trained computer vision models, using these features – as a set of words – as an input for the content analysis. While this in itself may not be an issue for quantitative content analyses aimed at categorizing (visual) content against a defined set of dimensions deductively, especially for inductive approaches this may mean that researchers will be restricted to what the APIs can categorize and, more broadly, it by default excludes rich image attributes such as arousal or gestalt principles. Furthermore, each API uses a different set of these features, which are unknown to the researcher. Thus, when using commercial computer vision APIs, the researcher is confronted with the unsatisfactory limitation to not oversee the entire pool of features potentially applicable to an image. However, this is a general limitation for research using commercial APIs or relying on data from commercial platforms such as Twitter, where the basic algorithmic practices are covert.
Second, we used LDA topic models as the technique for unsupervised machine learning for demonstration purposes, given its popularity for inductive content analyses in communication research, and we do not claim that this specific method is better suited for this analysis compared to the many options to inductively analyze data with unsupervised machine learning. Future research should extend our approach, and explicitly compare alternative clustering or topic modeling techniques.
Third, our proposed protocol makes use of pre-trained computer vision models – with a focus on commercial API’s. It is important to note that the black-box approach of commercial API’s also means that these models may change over time, which may pose challenges to replicability. Researchers should be aware of this, and at a minimum make sure to record the version of the API being used (when available).
Fourth, and importantly, researchers do not have insights on the quality of the data used to train the pre-trained computer vision models offered by commercial APIs. As indicated in emerging research on fairness and bias in AI, some of the datasets used for training have been shown to have gender and racial bias (Buolamwini & Gebru, Citation2018) and, as they mostly originate from online social data or crowdsourcing, they often reflect broader societal biases and stereotypes (Olteanu et al., Citation2019; Zou & Schiebinger, Citation2018). Researchers should, therefore, be particularly aware and critical of this bias potential, and at a minimum ensure that their validation and test sets are created – when appropriate – in a way that would allow these biases to be detected when validating the output of these APIs.
Ethical Considerations
The use of big data for research comes with concerns for data privacy and ethics of data collection, which needs to be addressed also for visual data (Wenzel & Van Quaquebeke, Citation2018). Discussions on the ethicality of accessing and scraping online data are ongoing and center predominantly on the issue of consent, especially for personal data on social media platforms (Mittelstadt & Floridi, Citation2016). Even though users agree to the platforms’ terms of service when they subscribe, this may not be sufficient to establish informed consent for research purposes. For large sample sizes, however, receiving informed consent from each participant is not feasible (Nunan & Di Domenico, Citation2013), and some argue that it might not be necessary as the researchers do not go into depth (Lomborg & Bechmann, Citation2014). Researchers generally need to keep in mind that rules vary per institutional and national context. In the European Union, scraped data from social media platforms are considered personal data and thus needs to be anonymized (EU, Citation2016). However, anonymization of personal data after data collection can fail in big data sets (Boyd & Crawford, Citation2012) and thus potentially cause harm to a person’s online reputation (Krotoski, Citation2012). Furthermore, images may contain information about a person that is considered sensitive if it reveals political, philosophical, religious, or sexual orientation or ethnic origin (EU, Citation2016; Wang & Jiang, Citation2017), which offers a potentially big theory-practice gap (Mäkinen, Citation2015). Often, institutional review boards examine projects that entail scraping applications (Lomborg & Bechmann, Citation2014), which can provide useful guidance regarding the “right thing to do,” but may differ substantially across institutions. The general guidelines of legitimate interest and fairness in data collection and analysis as formulated by the GDPR may give researchers ethical guidance when in doubt (Butterworth, Citation2018).
Future Research: Applications of Computer Vision across Communication Studies
AVCA can be employed in various communication contexts. Using it in isolation gives insights into large sets of visual data (Peng, Citation2018). In addition, such visual content analysis can inform subsequent studies on communication effects (Slater, Citation2013) or be applied complementary to automated text-based content analysis designs, thereby fostering a quantitative and automated approach to multimodal content analysis (Serafini & Reid, Citation2019). shows application suggestions that could be explored across selected sub-fields of communication science. This list is by no means exhaustive and should be interpreted with caution: Using our proposed framework, researchers can evaluate the extent to which computer vision labels may be able to assist in the classification of concepts that are theoretically relevant to Communication Science, yet in many cases, the level of complexity of these concepts may fall short. Furthermore, these APIs are more focused on image content; thus, other important aspects of visual analysis, such as esthetics, are left unexplored.
Table 4. Application contexts for AVCA across communication studies
Visual social media platforms such as Instagram are an increasingly important channel for politicians to communicate with their voters. Expanding on research studying single candidates’ (Lalancette & Raynauld, Citation2019) and parties’ (Filimonov et al., Citation2016) use of visual social media, the interrelations between politicians’ visual image strategies and how that affects their parties’ visual communication on social media (or vice versa) and eventually voters’ perceptions of credibility and likability could be a fruitful future research area.
Studies on the communication behavior of employees voicing their opinions about their organization via social media could profit from an inclusion of images, given the spread of visually heavy channels such as Instagram, and the importance of images for sharing behaviors. Such studies could investigate the influence of images posted by employees on social media on brand perceptions or organizational reputation, but also on employee satisfaction, wellbeing (Miles & Mangold, Citation2014), or financial performance (Schniederjans et al., Citation2013).
Communication historians can find AVCA useful in exploring – for instance, in an inductive fashion, propaganda posters as collected by the Washington State UniversityFootnote16 and compare their visual attributes (e.g., color, composition, content; Matz et al., Citation2019) to posters of more recent campaigns.
For marketing researchers, large-scale analyses of user-generated visuals on social media can help predict factors facilitating word-of-mouth, engagement, and brand value enriching text-based measures such as customer sentiment (Campbell et al., Citation2011; Liu et al., Citation2017) and informing research on shareability and likability of contents across channels (Araujo et al., Citation2015; D’Andrea & Mintz, Citation2019).
The long-standing tradition of researching contents of annual financial and sustainability reports (Duriau et al., Citation2007; Lock & Seele, Citation2015) can be enlarged by including visuals in such large-scale analysis with AVCA. Financial analysts’ reports on firm performance can equally be studied from a textual and visual viewpoint (Fogarty & Rogers, Citation2005), as well as corporate environmental reporting and its relationship with environmental performance (Clarkson et al., Citation2008).
Last, news image analysis is of interest to all sorts of communication researchers: public relation scholars in the relationship between news imagery and corporate reputation can employ AVCA for large-scale image analysis of online news images (Jacobs & Wonneberger, Citation2017), also over time. In political communication, studies comparing media bias in politicians’ portrayals across off- and online news media could shed light on channel-specific differences in light of the importance of visuals online (Peng, Citation2018).
Conclusions
Given the vast amounts of visual data published online every day, analyzing images at a large scale has become a looming task for communication researchers. At the same time, automated image recognition is one of the artificial intelligence applications developed at a very fast pace by business (Jordan & Mitchell, Citation2015). This protocol suggests a way to use these commercial computer vision applications for communication research purposes, and propose AVCA as a contribution to thwart a methodological gap present in other social sciences such as management studies yet also still present in communication science, where “the act of gathering, analyzing, and interpreting Big Data is, by and large, unfamiliar territory” (Wenzel & Van Quaquebeke, Citation2018, p. 551).
Acknowledgments
We would also like to thank Jieun Lee, Zühre Orhon, and Kasia Krok for their excellent work in the manual coding of the sample of images used in this study.
Disclosure Statement
No potential conflict of interest was reported by the authors.
Additional information
Funding
Notes
1. We would like to thank an anonymous reviewer for highlighting this point.
2. The study being reported here is used for illustration of each step as a methodological demonstration. The data discussed here are part of a larger project on sustainability communication, with the substantive findings discussed in Lock and Araujo (Citation2020). Samples of the Python code are available at: https://github.com/uvacw/avca.
3. This validation set was coded by a third coder (graduate student), also not involved in the design of the codebook. After two rounds of training, this third coder reached levels of reliability (with the original two coders) at comparable levels for People (Krippendorf’s ⍺ = 0.78, average agreement = 89%), Planet (Krippendorf’s ⍺ = 0.58, average agreement = 88%) and Profit (Krippendorf’s ⍺ = 0.66, average agreement = 83%).
7. https://cloud.google.com/vision/docs/detecting-faces. It is important to note that this classifier only detects the presence of faces, but does not provide facial recognition outputs (i.e., it does not identify who is in the image).
11. We would like to thank an anonymous reviewer for this suggestion.
12. Coherence was calculated based on the Gensim implementation of Röder et al. (Citation2015).
13. Grid search is a technique used in machine learning to identify the best combination of hyperparameters that a model may have available for optimization. These may include steps in the pre-processing of the data (e.g., using TF-IDF or not), or specific hyperparameters in the classifier itself (e.g., for Logistic Regression, whether or not to have an intercept in the model, the type of penalty or solver to be used, etc.). Grid search tests all the potential combinations of hyperparameters and identifies the combination that provides the best performance according to the scoring parameters provided (e.g., F1-scores, precision, or recall).
14. Scikit-learn offers different options to calculate the F1-scores. “Micro” is calculated globally (counting true positives, false negatives and false positives), “macro” uses the unweighted mean for each label, and “weighted”, which calculates the scores for each label and then uses their weighted average for the final result: https://scikit-learn.org/stable/modules/generated/sklearn.metrics.f1_score.html.
References
- Araujo, T., Neijens, P. C., & Vliegenthart, R. (2015). What motivates consumers to re-Tweet brand content? The impact of information, emotion, and traceability on pass-along behavior. Journal of Advertising Research, 55(3), 284–295. https://doi.org/10.2501/JAR-2015-009
- Aziz, M. W., Naeem, F., Alizai, M. H., & Khan, K. B. (2018). Automated solutions for crowd size estimation. Social Science Computer Review, 36(5), 610–631. https://doi.org/10.1177/0894439317726510
- Benschop, Y., & Meihuizen, H. E. (2002). Keeping up gendered appearances: Representations of gender in financial annual reports. Accounting, Organizations and Society, 27(7), 611–636. https://doi.org/10.1016/S0361-3682(01)00049-6
- Blei, D. M., Ng, A. Y., & Jordan, M. I. (2003). Latent Dirichlet allocation. Journal of Machine Learning Research, 3(January), 993–1022. https://www.jmlr.org/papers/v3/blei03a
- Bohannon, J. (2014). Helping robots see the big picture. Science, 346(6206), 186–187. https://doi.org/10.1126/science.346.6206.186
- Bosch, O. J., Revilla, M., & Paura, E. (2019). Answering mobile surveys with images: An exploration using a computer vision API. Social Science Computer Review, 37(5), 669–683. https://doi.org/10.1177/0894439318791515
- Boumans, J. W., & Trilling, D. (2016). Taking stock of the toolkit. Digital Journalism, 4(1), 8–23. https://doi.org/10.1080/21670811.2015.1096598
- Boxell, L. (2018). Slanted images: Measuring nonverbal media bias (Working paper). Retrieved from https://mpra.ub.uni-muenchen.de/89047/.
- Boxenbaum, E., Jones, C., Meyer, R. E., & Svejenova, S. (2018). Towards an articulation of the material and visual turn in organization studies. Organization Studies, 39(5–6), 597–616. https://doi.org/10.1177/0170840618772611
- Boyd, D., & Crawford, K. (2012). Critical questions for big data: Provocations for a cultural, technological, and scholarly phenomenon. Information, Communication & Society, 15(5), 662–679. https://doi.org/10.1080/1369118X.2012.678878
- Braun, M. T., Kuljanin, G., & DeShon, R. P. (2018). Special considerations for the acquisition and wrangling of big data. Organizational Research Methods, 21(3), 633–659. https://doi.org/10.1177/1094428117690235
- Bucy, E. P., & Grabe, M. E. (2007). Taking television seriously: A sound and image bite analysis of presidential campaign coverage, 1992–2004. Journal of Communication, 57(4), 652–675. https://doi.org/10.1111/j.1460-2466.2007.00362.x
- Buolamwini, J., & Gebru, T. (2018). Gender shades: Intersectional accuracy disparities in commercial gender classification. Conference on Fairness, Accountability and Transparency, New York, NY, USA (pp. 77–91).
- Burscher, B., Odijk, D., Vliegenthart, R., de Rijke, M., & de Vreese, C. H. (2014). Teaching the computer to code frames in news: comparing two supervised machine learning approaches to frame analysis. Communication Methods and Measures, 8(3), 190–206. https://doi.org/10.1080/19312458.2014.937527
- Burscher, B., Vliegenthart, R., & De Vreese, C. H. (2015). Using supervised machine learning to code policy issues: Can classifiers generalize across contexts? The ANNALS of the American Academy of Political and Social Science, 659(1), 122–131. https://doi.org/10.1177/0002716215569441
- Butterworth, M. (2018). The ICO and artificial intelligence: The role of fairness in the GDPR framework. Computer Law & Security Review, 34(2), 257–268. https://doi.org/10.1016/j.clsr.2018.01.004
- Campbell, C., Pitt, L. F., Parent, M., & Berthon, P. R. (2011). Understanding consumer conversations around ads in a Web 2.0 world. Journal of Advertising, 40(1), 87–102. https://doi.org/10.2753/JOA0091-3367400106
- Casas, A., & Williams, N. W. (2019). Images that matter: Online protests and the mobilizing role of pictures. Political Research Quarterly, 72(2), 360–375. https://doi.org/10.1177/1065912918786805
- Christiansen, L. H. (2018). The use of visuals in issue framing: Signifying responsible drinking. Organization Studies, 39(5–6), 665–689. https://doi.org/10.1177/0170840618759814
- Clarkson, P. M., Li, Y., Richardson, G. D., & Vasvari, F. P. (2008). Revisiting the relation between environmental performance and environmental disclosure: An empirical analysis. Accounting, Organizations and Society, 33(4), 303–327. https://doi.org/10.1016/j.aos.2007.05.003
- Cornelissen, J. P., & Werner, M. D. (2014). Putting framing in perspective: A review of framing and frame analysis across the management and organizational literature. The Academy of Management Annals, 8(1), 181–235. https://doi.org/10.1080/19416520.2014.875669
- D’Andrea, C., & Mintz, A. (2019). Studying the live cross-platform circulation of images with computer vision API: An experiment based on a sports media event. International Journal of Communication, 13, 21. https://ijoc.org/index.php/ijoc/article/view/10423/2627
- De Haan, Y., Kruikemeier, S., Lecheler, S., Smit, G., & van der Nat, R. (2018). When does an infographic say more than a thousand words? Journalism Studies, 19(9), 1293–1312. https://doi.org/10.1080/1461670X.2016.1267592
- Deng, J., Dong, W., Socher, R., Li, L.-J., Li, K., & Fei-Fei, L. (2009). Imagenet: A large-scale hierarchical image database. 2009 IEEE Conference on Computer Vision and Pattern Recognition, Miami, FL, USA (pp. 248–255).
- Donaldson, T., & Preston, L. E. (1995). The stakeholder theory of the corporation: Concepts, evidence, and implications. Academy of Management Review, 20(1), 65–91. https://doi.org/10.5465/amr.1995.9503271992
- Duriau, V. J., Reger, R. K., & Pfarrer, M. D. (2007). A content analysis of the content analysis literature in organization studies: Research themes, data sources, and methodological refinements. Organizational Research Methods, 10(1), 5–34. https://doi.org/10.1177/1094428106289252
- Elkington, J. (1998). Partnerships from cannibals with forks: The triple bottom line of 21st-century business. Environmental Quality Management, 8(1), 37–51. https://doi.org/10.1002/tqem.3310080106
- Elkington, J. (2018). 25 years ago I coined the phrase “triple bottom line.” Here’s why it’s time to rethink it. Harvard Business Review.
- EU. (2016). Regulation (EU) 2016/679 of the European Parliament and of the Council of 27 April 2016 on the protection of natural persons with regard to the processing of personal data and on the free movement of such data, and repealing Directive 95/46/EC (General Data Protection Regulation—GDPR).
- Filimonov, K., Russmann, U., & Svensson, J. (2016). Picturing the party: Instagram and party campaigning in the 2014 Swedish elections. Social Media + Society, 2(3), 2056305116662179. https://doi.org/10.1177/2056305116662179
- Fogarty, T. J., & Rogers, R. K. (2005). Financial analysts’ reports: An extended institutional theory evaluation. Accounting, Organizations and Society, 30(4), 331–356. https://doi.org/10.1016/j.aos.2004.06.003
- Forbes. (2017). The world’s largest companies. Forbes. https://www.forbes.com/global2000/list/#header:profits_sortreverse:true
- Freelon, D. (2018). Computational research in the Post-API age. Political Communication, 35(4), 665–668. https://doi.org/10.1080/10584609.2018.1477506
- GRI. (2015). Sustainability reporting guidelines (Version G4). Global Reporting Initiative.
- Halavais, A. (2019). Overcoming terms of service: A proposal for ethical distributed research. Information, Communication & Society, 22(11), 1567–1581. https://doi.org/10.1080/1369118X.2019.1627386
- Hellmueller, L., & Zhang, X. (2019). Shifting toward a humanized perspective? Visual framing analysis of the coverage of refugees on CNN and Spiegel online before and after the iconic photo publication of Alan Kurdi. Visual Communication. https://doi.org/10.1177/1470357219832790
- Hillard, D., Purpura, S., & Wilkerson, J. (2008). Computer-assisted topic classification for mixed-methods social science research. Journal of Information Technology & Politics, 4(4), 31–46. https://doi.org/10.1080/19331680801975367
- Jacobi, C., van Atteveldt, W., & Welbers, K. (2016). Quantitative analysis of large amounts of journalistic texts using topic modelling. Digital Journalism, 4(1), 89–106. https://doi.org/10.1080/21670811.2015.1093271
- Jacobs, S., & Wonneberger, A. (2017). Did we make it to the news? Effects of actual and perceived media coverage on media orientations of communication professionals. Public Relations Review, 43(3), 547–559. https://doi.org/10.1016/j.pubrev.2017.03.010
- Joo, J., Bucy, E. P., & Seidel, C. (2019). Automated coding of televised leader displays: Detecting nonverbal political behavior with computer vision and deep learning. International Journal of Communication, 13, 4044–4066. https://ijoc.org/index.php/ijoc/article/view/10725
- Joo, J., & Steinert-Threlkeld, Z. C. (2018). Image as data: Automated visual content analysis for political science. arXiv preprint arXiv:1810.01544.
- Jordan, M. I., & Mitchell, T. M. (2015). Machine learning: Trends, perspectives, and prospects. Science, 349(6245), 255–260. https://doi.org/10.1126/science.aaa8415
- Kent, M. L., & Saffer, A. J. (2014). A Delphi study of the future of new technology research in public relations. Public Relations Review, 40(3), 568–576. https://doi.org/10.1016/j.pubrev.2014.02.008
- Kobayashi, V. B., Mol, S. T., Berkers, H. A., Kismihók, G., & Den Hartog, D. N. (2018). Text mining in organizational research. Organizational Research Methods, 21(3), 733–765. https://doi.org/10.1177/1094428117722619
- Kress, G. R., & Van Leeuwen, T. (1996). Reading images: The grammar of visual design. Psychology Press.
- Krippendorff, K. (2018). Content analysis: An introduction to its methodology. Sage publications.
- Krizhevsky, A., Sutskever, I., & Hinton, G. E. (2012). ImageNet classification with deep convolutional neural networks. In F. Pereira, C. J. C. Burges, L. Bottou, & K. Q. Weinberger (Eds..), Advances in neural information processing systems 25 (pp. 1097–1105). http://papers.nips.cc/paper/4824-imagenet-classification-with-deep-convolutional-neural-networks.pdf
- Krotoski, A. K. (2012). Data-driven research: Open data opportunities for growing knowledge, and ethical issues that arise. Insights: The UKSG Journal, 25(1), 28–32. https://doi.org/10.1629/2048-7754.25.1.28
- Kumar, N., Venugopal, D., Qiu, L., & Kumar, S. (2018). Detecting review manipulation on online platforms with hierarchical supervised learning. Journal of Management Information Systems, 35(1), 350–380. https://doi.org/10.1080/07421222.2018.1440758
- Lalancette, M., & Raynauld, V. (2019). The power of political image: Justin Trudeau, Instagram, and celebrity politics. American Behavioral Scientist, 63(7), 888–924. https://doi.org/10.1177/0002764217744838
- Lang, S., & Ommer, B. (2018). Reconstructing histories: Analyzing exhibition photographs with computational methods. Arts, 7(4), 64. https://doi.org/10.3390/arts7040064
- Li, T., Mei, T., Kweon, I.-S., & Hua, X.-S. (2010). Contextual bag-of-words for visual categorization. IEEE Transactions on Circuits and Systems for Video Technology, 21(4), 381–392. https://doi.org/10.1109/TCSVT.2010.2041828
- Li, T., Mei, T., Kweon, I.-S., & Hua, X.-S. (2011). Contextual bag-of-words for visual categorization. IEEE Transactions on Circuits and Systems for video Technology, 21(4), 381–392. https://doi.org/10.1109/TCSVT.2010.2041828
- Liu, X., Burns, A. C., & Hou, Y. (2017). An investigation of brand-related user-generated content on Twitter. Journal of Advertising, 46(2), 236–247. https://doi.org/10.1080/00913367.2017.1297273
- Lock, I., & Araujo, T. (2020). Visualizing the triple bottom line: A large‐scale automated visual content analysis of European corporations’ website and social media images. Corporate Social Responsibility and Environmental Management. https://doi.org/10.1002/csr.1988
- Lock, I., & Seele, P. (2015). Analyzing sector‐specific CSR reporting: social and environmental disclosure to investors in the chemicals and banking and insurance industry. Corporate Social Responsibility and Environmental Management, 22(2), 113–128. https://doi.org/10.1002/csr.1338
- Lomborg, S., & Bechmann, A. (2014). Using APIs for data collection on social media. The Information Society, 30(4), 256–265. https://doi.org/10.1080/01972243.2014.915276
- Maier, D., Waldherr, A., Miltner, P., Wiedemann, G., Niekler, A., Keinert, A., Pfetsch, B., Heyer, G., Reber, U., Häussler, T., Schmid-Petri, H., & Adam, S. (2018). Applying LDA topic modeling in communication research: Toward a valid and reliable methodology. Communication Methods and Measures, 12(2–3), 93–118. https://doi.org/10.1080/19312458.2018.1430754
- Mäkinen, J. (2015). Data quality, sensitive data and joint controllership as examples of grey areas in the existing data protection framework for the Internet of things. Information & Communications Technology Law, 24(3), 262–277. https://doi.org/10.1080/13600834.2015.1091128
- Manning, C. D., & Schütze, H. (1999). Foundations of statistical natural language processing. MIT press.
- Matz, S. C., Segalin, C., Stillwell, D., Müller, S. R., & Bos, M. W. (2019). Predicting the personal appeal of marketing images using computational methods. Journal of Consumer Psychology, 29(3), 370–390. https://doi.org/10.1002/jcpy.1092
- Miles, S. J., & Mangold, W. G. (2014). Employee voice: Untapped resource or social media time bomb? Business Horizons, 57(3), 401–411. https://doi.org/10.1016/j.bushor.2013.12.011
- Mittelstadt, B. D., & Floridi, L. (2016). The ethics of big data: Current and foreseeable issues in biomedical contexts. Science and Engineering Ethics, 22(2), 303–341. https://doi.org/10.1007/s11948-015-9652-2
- Nadin, S., & Cassell, C. (2006). The use of a research diary as a tool for reflexive practice: Some reflections from management research. Qualitative Research in Accounting & Management, 3(3), 208–217. https://doi.org/10.1108/11766090610705407
- Naik, N., Raskar, R., & Hidalgo, C. A. (2016). Cities are physical too: Using computer vision to measure the quality and impact of urban appearance. American Economic Review, 106(5), 128–132. https://doi.org/10.1257/aer.p20161030
- Nunan, D., & Di Domenico, M. (2013). Market research and the ethics of big data. International Journal of Market Research, 55(4), 505–520. https://doi.org/10.2501/IJMR-2013-015
- Olteanu, A., Castillo, C., Diaz, F., & Kıcıman, E. (2019). Social data: Biases, methodological pitfalls, and ethical boundaries. Frontiers in Big Data, 2, 1–33. https://doi.org/10.3389/fdata.2019.00013
- Pallas, J., & Fredriksson, M. (2013). Corporate media work and micro-dynamics of mediatization. European Journal of Communication, 28(4), 420–435. https://doi.org/10.1177/0267323113488487
- Pedregosa, F., Varoquaux, G., Gramfort, A., Michel, V., Thirion, B., Grisel, O., & Duchesnay, É. (2011). Scikit-learn: Machine learning in python. Journal of Machine Learning Research, 12(Oct), 2825–2830.
- Peng, Y. (2018). Same candidates, different faces: Uncovering media bias in visual portrayals of presidential candidates with computer vision. Journal of Communication, 68(5), 920–941. https://doi.org/10.1093/joc/jqy041
- Peng, Y., & Jemmott, J. B., III. (2018). Feast for the eyes: Effects of food perceptions and computer vision features on food photo popularity. International Journal of Communication, 12, 313–336.
- Powell, T. E., Boomgaarden, H. G., De Swert, K., & de Vreese, C. H. (2015). A clearer picture: The contribution of visuals and text to framing effects. Journal of Communication, 65(6), 997–1017. https://doi.org/10.1111/jcom.12184
- Presi, C., Maehle, N., & Kleppe, I. A. (2016). Brand selfies: Consumer experiences and marketplace conversations. European Journal of Marketing, 50(9/10), 1814–1834. https://doi.org/10.1108/EJM-07-2015-0492
- Rebich-Hespanha, S., Rice, R. E., Montello, D. R., Retzloff, S., Tien, S., & Hespanha, J. P. (2015). Image themes and frames in US print news stories about climate change. Environmental Communication, 9(4), 491–519. https://doi.org/10.1080/17524032.2014.983534
- Reece, A. G., & Danforth, C. M. (2017). Instagram photos reveal predictive markers of depression. EPJ Data Science, 6(1), 1–12. https://doi.org/10.1140/epjds/s13688-017-0110-z
- Rehurek, R., & Sojka, P. (2010). Software framework for topic modelling with large corpora. Proceedings of the LREC 2010 Workshop on New Challenges for NLP Frameworks, Valletta, Malta (pp. 45–50).
- Riffe, D., Lacy, S., & Fico, F. (2014). Analyzing media messages: Using quantitative content analysis in research. Routledge.
- Röder, M., Both, A., & Hinneburg, A. (2015). Exploring the space of topic coherence measures. Proceedings of the Eighth ACM International Conference on Web Search and Data Mining - WSDM ’15, Shanghai, China (pp. 399–408). https://doi.org/10.1145/2684822.2685324
- Rosado, P. (2017). Computer vision models to categorize art collections according to the visual content: A new approach to the abstract art of Antoni Tàpies. Leonardo, 52(3), 255–260. https://doi.org/10.1162/leon_a_01443
- Russakovsky, O., Deng, J., Su, H., Krause, J., Satheesh, S., Ma, S., Huang, Z., Karpathy, A., Khosla, A., Bernstein, M., Berg, A. C., & Fei-Fei, L. (2015). ImageNet large scale visual recognition challenge. International Journal of Computer Vision, 115(3), 211–252. https://doi.org/10.1007/s11263-015-0816-y
- Russell, S. J., & Norvig, P. (2016). Artificial intelligence: A modern approach (3rd ed., Global edition). Pearson.
- Savage, N. (2016). Seeing more clearly. Communications of the ACM, 59(1), 20–22. https://doi.org/10.1145/2843532
- Scharkow, M. (2013). Thematic content analysis using supervised machine learning: An empirical evaluation using German online news. Quality & Quantity, 47(2), 761–773. https://doi.org/10.1007/s11135-011-9545-7
- Schill, D. (2012). The visual image and the political image: A review of visual communication research in the field of political communication. Review of Communication, 12(2), 118–142. https://doi.org/10.1080/15358593.2011.653504
- Schmiedel, T., Müller, O., & Vom Brocke, J. (2019). Topic modeling as a strategy of inquiry in organizational research: A tutorial with an application example on organizational culture. Organizational Research Methods, 22(4), 941–968. https://doi.org/10.1177/1094428118773858
- Schniederjans, D., Cao, E. S., & Schniederjans, M. (2013). Enhancing financial performance with social media: An impression management perspective. Decision Support Systems, 55(4), 911–918. https://doi.org/10.1016/j.dss.2012.12.027
- Searle, J. R. (2015). Seeing things as they are: A theory of perception. Oxford University Press.
- Seele, P., & Lock, I. (2015). Instrumental and/or deliberative? A typology of CSR communication tools. Journal of Business Ethics, 131(2), 401–414. https://doi.org/10.1007/s10551-014-2282-9
- Serafini, F., & Reid, S. F. (2019). Multimodal content analysis: Expanding analytical approaches to content analysis. Visual Communication. https://doi.org/10.1177/1470357219864133
- Slater, M. D. (2013). Content analysis as a foundation for programmatic research in communication. Communication Methods and Measures, 7(2), 85–93. https://doi.org/10.1080/19312458.2013.789836
- Slater, M. D., & Gleason, L. S. (2012). Contributing to theory and knowledge in quantitative communication science. Communication Methods and Measures, 6(4), 215–236. https://doi.org/10.1080/19312458.2012.732626
- Stone, P. J., Dunphy, D. C., & Smith, M. S. (1966). The general inquirer: A computer approach to content analysis. M.I.T. Press.
- Strycharz, J., Strauss, N., & Trilling, D. (2018). The role of media coverage in explaining stock market fluctuations: Insights for strategic financial communication. International Journal of Strategic Communication, 12(1), 67–85. https://doi.org/10.1080/1553118X.2017.1378220
- Tang, L., Gallagher, C. C., & Bie, B. (2015). Corporate social responsibility communication through corporate websites: A comparison of leading corporations in the United States and China. International Journal of Business Communication, 52(2), 205–227. https://doi.org/10.1177/2329488414525443
- Tausczik, Y. R., & Pennebaker, J. W. (2010). The psychological meaning of words: LIWC and computerized text analysis methods. Journal of Language and Social Psychology, 29(1), 24–54. https://doi.org/10.1177/0261927X09351676
- Trilling, D., & Jonkman, J. G. F. (2018). Scaling up content analysis. Communication Methods and Measures, 12(2–3), 158–174. https://doi.org/10.1080/19312458.2018.1447655
- Tsai, C.-F. (2012). Bag-of-words representation in image annotation: A review. ISRN Artificial Intelligence, 2012. https://doi.org/10.5402/2012/376804
- UN. (2017). Sustainable development goals. https://www.un.org/sustainabledevelopment/sustainable-development-goals/
- Wanderley, L. S. O., Lucian, R., Farache, F., & de Sousa Filho, J. M. (2008). CSR information disclosure on the web: A context-based approach analysing the influence of country of origin and industry sector. Journal of Business Ethics, 82(2), 369–378. https://doi.org/10.1007/s10551-008-9892-z
- Wang, J., Yan, F., Aker, A., & Gaizauskas, R. (2014). A poodle or a dog? Evaluating automatic image annotation using human descriptions at different levels of granularity. Proceedings of the Third Workshop on Vision and Language, Dublin, Ireland (pp. 38–45). https://doi.org/10.3115/v1/W14-5406
- Wang, M., & Jiang, Z. (2017). The defining approaches and practical paradox of sensitive data: An investigation of data protection laws in 92 countries and regions and 200 data breaches in the world. International Journal of Communication, 11, 20.
- Wenzel, R., & Van Quaquebeke, N. (2018). The double-edged sword of big data in organizational and management research: A review of opportunities and risks. Organizational Research Methods, 21(3), 548–591. https://doi.org/10.1177/1094428117718627
- Xi, N., Ma, D., Liou, M., Steinert-Threlkeld, Z. C., Anastasopoulos, J., & Joo, J. (2020). Understanding the political ideology of legislators from social media images. Proceedings of the International AAAI Conference on Web and Social Media 14(1).
- Zou, J., & Schiebinger, L. (2018). AI can be sexist and racist—It’s time to make it fair. Nature, 559(7714), 324–326. https://doi.org/10.1038/d41586-018-05707-8