
 ?Mathematical formulae have been encoded as MathML and are displayed in this HTML version using MathJax in order to improve their display. Uncheck the box to turn MathJax off. This feature requires Javascript. Click on a formula to zoom.
ABSTRACT
Many social scientists recognize that quantitative text analysis is a useful research methodology, but its application is still concentrated in documents written in European languages, especially English, and few sub-fields of political science, such as comparative politics and legislative studies. This seems to be due to the absence of flexible and cost-efficient methods that can be used to analyze documents in different domains and languages. Aiming to solve this problem, this paper proposes a semisupervised document scaling technique, called Latent Semantic Scaling (LSS), which can locate documents on various pre-defined dimensions. LSS achieves this by combining user-provided seed words and latent semantic analysis (word embedding). The article demonstrates its flexibility and efficiency in large-scale sentiment analysis of New York Times articles on the economy and Asahi Shimbun articles on politics. These examples show that LSS can produce results comparable to that of the Lexicoder Sentiment Dictionary (LSD) in both English and Japanese with only small sets of sentiment seed words. A new heuristic method that assists LSS users to choose a near-optimal number of singular values to obtain word vectors that best capture differences between documents on target dimensions is also presented.
Many social scientists recognize that quantitative text analysis is a useful research methodology, but its application is still concentrated in documents written in European languages, especially English, and few sub-fields of political science, such as comparative politics and legislative studies. This is not because they are only interested in domestic politics in North America and Europe but because the existing quantitative text analysis toolkit is not suitable for analysis of documents in non-European languages or in other fields.
The domination of European languages in quantitative text analysis is partially due to its history: many of the text analysis dictionaries, including the Lexicoder Sentiment Dictionary (LSD) (Young & Soroka, Citation2012) and the Linguistic Inquiry and Word Count (LIWC), were created based on the General Inquirer dictionaries (Stone et al., Citation1966), which were developed to analyze English texts during the Cold War; statistical analysis of textual data was also introduced to political science for studies of party competition in Europe (Benoit & Laver, Citation2003; Laver & Garry, Citation2000; Slapin & Proksch, Citation2008); many of the early software programs often supported only texts encoded in American Standard Code for Information Interchange (ASCII) or the ISO-8859-x character encodings that extend ASCII for European languages.
The success of comparative politics and legislative studies in adopting the new methodology is also due to the availability and structure of the textual data: political parties’ election manifestos are widely circulated and collected by groups of researchers such as the Comparative Agenda Project; speeches at legislatures are officially transcribed and archived in democratic states. These texts usually have strong features that statistical models can easily identify because political actors attempt to distinguish themselves from others in the documents and speeches with different degrees of emphasis on policy agendas (Klüver & Sagarzazu, Citation2016; Petrocik et al., Citation2003). Such distinguishing features of texts are especially important in applying unsupervised machine learning methods, such as Wordfish (Slapin & Proksch, Citation2008) or topic models (Blei et al., Citation2003).
There is a growing interest in quantitative text analysis in communication studies, but researchers in the field still depend on a small number of analytic tools. Some of them apply off-the-shelf dictionaries to English texts (Hoffman & Jengelley, Citation2020; Kim et al., Citation2016; Mostafa, Citation2020; Rodrigues et al., Citation2019; Smirnova et al., Citation2017; Su et al., Citation2017), but others construct original dictionaries (Petkevic, Citation2018) or employ supervised machine learning models (Ceron & Splendore, Citation2018; Kim et al., Citation2016; Sabatovych, Citation2019; Su et al., Citation2017) to analyze texts in other languages. Sometimes only English-language texts are included in analysis in studies of countries where English is not the most common language due to the lack of appropriate dictionary (e.g., Jaidka et al., Citation2019). Even when dictionaries are available, their suitability is questionable because the subjects of those studies vary widely: nuclear energy (Kim et al., Citation2016; Su et al., Citation2017); nanotechnology (Su et al., Citation2017); terrorism (Hoffman & Jengelley, Citation2020); Arabs (Mostafa & Nebot, Citation2020); Ukraine (Sabatovych, Citation2019); Russia and Islam (Smirnova et al., Citation2017); and the United States (Onat et al., Citation2020).
The importance of expanding the scope of quantitative text analysis toward new domains and languages seems obvious considering the rise of social and political problems such as populism, polarization, censorship, propaganda, terrorism, disease pandemics, and nuclear proliferation, all of which exist outside of North America and Europe. In recent years, software programs that fully support Unicode have been developed (Benoit et al., Citation2018) and multi-lingual text analysis dictionaries have been created (e.g., Proksch et al., Citation2019), but researchers who wish to apply quantitative analysis methodology in non-European languages or in fields such as communication studies and international relations still encounter a the lack of appropriate dictionaries or statistical models.
The goal of this paper is to present a flexible and cost-efficient document scaling method, called Latent Sematic Scaling (LSS), to expand the scope of quantitative text analysis by addressing these issues. LSS is a type of semisupervised machine learning model that takes a small set of polarity words as “seed words” to assign polarity scores to other words in the corpus; it estimates semantic proximity of words employing word-embedding techniques. Importantly, it does not depend on manually-coded documents at all unlike other sentiment analysis technique that combine word-embedding and supervised machine learning (e.g., Rudkowsky et al., Citation2018).
LSS has already demonstrated its flexibility and efficiency in the analysis of news articles on the Ukraine crisis in terms of sentiment in English (Watanabe, Citation2017), street protests in terms of disorder-freedom framing in Russian (Lankina & Watanabe, Citation2017), the European refugee crisis in terms of security threats in German (Han, Citation2019), Iraqi politics in terms of reconciliation-sectarianism framing in Arabic (Yamao, Citation2019a, Citation2019b), the International Criminal Tribunal for the former Yugoslavia in terms of hero-villain framing in Serbian (Kubo, Citation2019), and the analysis of speech transcripts at the United Nations General Assembly in terms of diplomatic politeness (Baturo & Watanabe, Citation2019).
In the following sections, I will summarize the strengths and weaknesses of existing quantitative text analysis methods to highlight the advantages of LSS, explain its concept and algorithm, and demonstrate its flexibility and efficiency using two examples: sentiment analysis of English news articles on the economy and Japanese news articles on politics. Although LSS can be used to scale documents on various dimensions, I choose sentiment because it allows direct comparison between LSS and existing method as it has been a common scale in quantitative text analysis (Boukes et al., Citation2020; Puschmann & Powell, Citation2018).
The first example is meant to be a direct comparison between LSS and LSD; the second is a demonstration of its ability to analyze documents in Asian languages and different subjects. The examples will show that both LSS and LSD can produce sentiment scores for English news articles that correlate with manual coding, but correlation with LSS becomes stronger when aggregated by year. LSS can produce sentiment scores for Japanese news articles that strongly correspond to manual coding only with Japanese sentiment seed words that I have created. Based on these results, I argue that LSS is a document scaling technique that has the potential to expand the scope of quantitative text analysis toward new domains and languages.
Advantages of Latent Semantic Scaling
As a semisupervised machine learning model, LSS combines the characteristics of dictionary analysis and supervised and unsupervised machine learning models, balancing their strengths and weaknesses, such as the ability to measure specific quantities in large corpora and sensitivity to users’ decisions in text preprocessing. I will outline the characteristics of existing methods to highlight the advantages of LSS in this section.
Dictionary Analysis
Dictionary analysis is very old but still one of the most popular methods in quantitative text analysis for its technological simplicity. A dictionary contains words that are related to concepts that it captures, and software programs count these words ignoring all others; they aggregate the frequencies of these words into corresponding categories to simplify the data (Welbers et al., Citation2017). For example, LSD aggregates 4,567 sentiment words in the dictionary to two “negative” and “positive” categories. Such dramatic reduction of dimensionality is unnecessary for today’s personal computers, which have enough capacity to process large corpora with original words, but it makes analysis much easier for humans.
Users can produce meaningful results easily with dictionaries regardless of the size of the corpus because the selection of words is based solely on the pre-defined list. This is the advantage of this method in the analysis of large and noisy corpora, such as a collection of news articles published over an extended period, for which LSD originally was created. Dictionary analysis is also useful in the analysis of a large volume of social media posts because it is robust against unusual words, tags, and internet addresses. Dictionary analysis also works well with small corpora, such as responses to open-ended questions, where frequency of words is often too low to perform statistical analysis.
However, the possibility of performing dictionary analysis is dependent on the existence of suitable dictionaries in the target domains and languages (Boukes et al., Citation2020; Grimmer & Stewart, Citation2013). The English language has the largest collection of dictionaries, such as the Regressive Imagery Dictionary (Martindale, Citation1975), the Moral Foundation Dictionary (Frimer et al., Citation2009), the Dictionary of Policy Positions (Laver & Garry, Citation2000), and Affective Norms for English Words (Nielsen, Citation2011); in addition to those that I have already mentioned, many of these dictionaries have versions in European languages but not in non-European languages.
A notable effort has been made in recent years to increase the availability of dictionaries in non-English languages using computational tools. For example, Proksch et al. (Citation2019) translated the Lexicoder Sentiment Dictionary into 20 European languages using machine translation; Matsuo et al. (Citation2019) created a Japanese-language version of the Moral Foundation Dictionary assisted by online dictionaries. However, machine translation of a dictionary from English to non-European languages is not always possible because of the absence of one-to-one correspondence of words and the ambiguity of word semantics out of context.
New dictionaries are often created by adding or removing words from existing dictionaries, because it is very hard for humans to collect thousands of words that are related to the target concepts (King et al., Citation2017), but it is necessary to create a dictionary from scratch to employ dictionary analysis in new domains or languages. Computer scientists have developed lexicon expansion techniques to assist the construction of dictionaries (Qiu et al., Citation2009; Sumbaly & Sinha, Citation2009), but they are not widely used by social scientists due to their technological complexity.
Researchers can perform document scaling in different languages and domains with much smaller effort using LSS, because the model requires only small set of seed words to define the concepts it captures. The number of seed words LSS requires is only a fraction of words for a dictionary. LSS identifies synonyms of seed words in the corpus of documents to which it will be applied in analysis by the language-independent algorithm. This method resembles to the lexicon expansion techniques but technologically much simpler.
Supervised Machine Learning
Supervised machine learning models have attracted political scientists’ attention for their ability to replicate human judgment. These models are trained on instances created based on manual reading of texts; their algorithms statistically identify association between frequency of words and scores or labels given to the texts by humans; software programs exploit such statistical association to assign scores or labels to unseen texts. For example, Nielsen (Citation2017) trained a naive Bayes classifier on Arabic documents written by authors with or without jihadist ideology to predict other authors’ jihadist tendencies. Naive Bayes classifier is one of the simplest supervised machine learning models but more sophisticated models, such as Random Forests (Breiman, Citation2001) and Support Vector Machines (Cortes & Vapnik, Citation1995), are also available.
Supervised machine learning models can be used to replicate human judgment on various dimensions and categories in any language. The results produced by these models are entirely dependent on the manual scores or labels assigned to documents by humans when models are trained. This allows users to measure very specific quantities in corpora to make their analysis consistent with the existing theoretical framework; results produced by these models are easy to interpret because scores or labels produced by machines are equivalent to those by humans with a greater chance of errors. Supervised machine learning models also enable a group of researchers with different skillsets (e.g., social scientists and computer scientists) to collaborate through clear separation of manual analysis and computational analysis.
However, supervised machine learning models can replicate manual judgment only when their algorithms are trained on a sufficiently large corpus, because fitted models only recognize words that occur in the training set. The minimum number of documents for training varies depending of the complexity of the model and the subtlety of the measurement, but the number of documents for training is often larger than for predicting: Nielsen trained a naive Bayes classifier on 1,769 documents to classify 200 documents in his study.
It is common to train supervised machine learning models on a corpus incorporating existing meta information of documents (e.g., authors and sources), but its availability restricts the choice of measurement. Further, the estimated association between words and scores or labels can be inaccurate when models are trained on a sample drawn from a different population (Hand, Citation2006). For example, Laver et al. (Citation2003) trained the Wordscores model on British parties’ election manifestos from 1992 to predict their policy positions in 1997, but the model can suffer changes in language usage between two elections.
When a corpus of documents with manual scores or labels is not available, users must create one themselves, investing a large amount of resources. They can carry out manual coding of documents by themselves or by hiring others. Benoit et al. (Citation2016) proposed the use of crowdsourcing platforms, but such platforms are not widely available outside of North America and Europe and the cost for crowdsourcing has increased significantly in recent years due to high industrial demand.Footnote1
LSS allows researchers to analyze a very large corpus of documents because it requires only a fixed number of seed words regardless of the size of the corpus and no manual coding of documents for training thanks to the semisupervided machine learning algorithm. Larger sizes of corpora even facilitate identification of synonyms of seed words and improve the accuracy in document scaling by LSS. The use of entire corpora to fit LSS also avoids the model to suffer the differences in language usage between training and test sets.
Unsupervised Machine Learning
Unsupervised machine learning models are also very popular among social scientists because these models do not demand manual coding. These models work without manual supervision because their algorithms automatically identify words that distinguish between documents based on their distribution; the models can scale or classify documents regardless of domain or language as far as they are correctly designed. For example, Catalinac (Citation2018) analyzed Japanese election manifestos using a Wordfish, which was originally developed for German election manifestos (Slapin & Proksch, Citation2008). Other unsupervised machine learning models commonly used in political science are Correspondence Analysis (Greenacre, Citation1984), Latent Dirichlet Allocation (Blei et al., Citation2003), and Structural Topic Model (Roberts et al., Citation2014).
The dimensions or categories that these models identify depend almost entirely on their prominence in documents. For example, Wordfish can measure political parties’ ideologies in election manifestos but not in news articles because the main differences between the content of news articles is not political ideology of authors or sources. Therefore, users of these models often have to cherry pick documents or words in corpora to measure target concepts (Denny & Spirling, Citation2018). Correspondence analysis and topic models can detect more subtle differences between documents, but their outputs still depend on the choice of words and hyperparameters (i.e., number of singular values or topics).
Outputs of unsupervised models are always subject to post-hoc interpretation by users because their dimensions or categories lack prior definition. It is easy to interpret a single dimension identified by Wordfish but more difficult to do multiple dimensions or categories. For this reason, users often select dimensions or categories that they can easily interpret and discard others (Eshima et al., Citation2020). Most importantly, the lack of pre-defined dimensions or categories makes the result of analysis incompatible with existing theoretical frameworks in the field (Watanabe & Zhou, Citation2020).
LSS identifies synonyms based on an unsupervised semantic model, Latent Semantic Analysis (LSA), but still allows users to predefine dimensions its measures through selection of seed words. This combination of the unsupervised algorithm and the word-based supervision makes LSS insensitive to irrelevant dimensions or categories in documents without arbitrary choices of documents or words in the corpus and allows users to perform analysis of large and noisy corpora consistently with existing theoretical frameworks.
Algorithm of Latent Semantic Scaling
It is clear that the current quantitative text analysis methodology has limited utility for social scientists, who wish to analyze documents in new domains and languages, because they must invest a lot of resources for dictionary analysis or supervised machine learning models or surrender consistency of results with the existing theoretical framework for unsupervised machine learning models. Therefore, I propose LSS to allow them to place documents on user-defined dimensions without a dictionary or manual coding both in European and non-European languages.
LSS resembles Wordscores in that it locates documents on a unidimensional scale by producing polarity scores of words, but these scores are computed based on their semantic proximity to seed words instead of their frequency in manually-coded documents; it automatically estimates semantic proximity between words in a corpus employing word-embedding techniques but users still have to choose seed words manually based on their knowledge.
LSS assigns polarity scores to words by analyzing the entire corpus to make its unidimensional scale independent of temporality of language usage unlike Wordscores. This allows the users of LSS to locate documents on a fixed scale over time and makes the model an ideal tool for longitudinal analysis of large collections of documents in communication studies and international relations.
Corpora
LSS requires a sizable corpus of documents to compute semantic proximities between words. Corpora usually comprise of documents that users wish to analyze but they can also be other documents as far as the language usage is similar. The sizes of corpora required for LSS depends on the type of texts and measurements, but it is usually 5,000 to 10,000 documents for news articles which is roughly 200,000 to 400,000 sentences, when the average length of the articles is 40 sentences (discussed in below in more detail). Since semantic proximity is estimated by treating individual sentences as documents, a corpus of shorter texts (e.g., social media posts) can also be used to fit LSS.
Seed Words
Seed words are a small set of words that users choose to define the quantity that LSS measures. For sentiment analysis, users have to provide positive and negative words as seed words to weight the words in the corpus in terms of their sentiment; its algorithm produces their polarity scores based on their relative proximity to positive and negative seed words; users can define a linear dimension and project other words onto this scale using seed word anchored in the semantic space, which lacks absolute coordinates ().
Figure 1. Conceptual illustration of word weighting by seed words in a latent semantic space. The arrow is the sentiment dimension in the semantic space and circles are proximities of positive seed (“good”) words and negative seed words (“bad”) to “crisis”, which is projected on the sentiment dimension and receives a negative score
Ideal seed words are subject-independent generic words in order to achieve their portability across projects. shows English sentiment seed words by Turney and Littman (Citation2003) and Japanese sentiment seed words by the current author. Each seed word is intended to capture sub-dimensions of sentiment such as quality, attitude, behavior, status, mortality. Japanese sentiment seed words are all in kanji (Chinese ideograms) because these words have stronger polarity than those with hiragana (Japanese phonograms).Footnote2
Table 1. Generic sentiment seed words
Model Terms
LSS model terms consist of words that are relevant to the target dimension. When the corpus contains documents about a specific subject, model terms can be all the words in the corpus, excluding grammatical words and low-frequency words. However, model terms must be selected when documents’ subjects are less specific to make the model insensitive to irrelevant differences between documents. For example, sentiment analysis on economy in news articles requires restrictive model term selection because they usually mention not only economic but also political or cultural subjects. In other words, LSS captures political or cultural sentiment of the articles if model terms includes all the words in the corpus.
Although many different methods can be used to select subject-specific words, the simplest method is non-contiguous collocation analysis that identifies words that are statistically significantly frequent around target words (e.g., “econom*” for economy). This method effectively collects modifiers of the concepts that often occur within 5–10 words from the target words. The strength of words’ association with target concept can be computed by signed chi-squire test, which is known as Keyness (Scott, Citation2006).
Polarity Scores of Words
LSS employs the word-embedding technique to accurately estimate semantic proximity between words in the corpus. Word-embeddings are unsupervised algorithms which produce low-dimensional representations of word semantics, called “word vectors”, based on cooccurrences of words within sentences or word-windows. Since the creation of the LSA by Deerwester et al. (Citation1990), multiple word-embedding models, such as Word2vec (Mikolov et al., Citation2013), and Glove (Pennington et al., Citation2014), have been proposed. While latent semantic analysis resembles factor analysis and correspondence analysis as they are based on singular value decomposition (SVD), more recent models are based on an array of complex regression models. All the word-embedding models are aimed at accurately estimating semantic proximity of words, but LSA is optimized for identifying synonyms while Word2vec and Glove are optimized for analogies (Levy et al., Citation2015).Footnote3
LSS computes polarity scores of words by accurately estimating the semantic proximity of words by SVD of a document-feature matrix, in which original documents are segmented into sentences to capture similarity of words in immediate local contexts. More precisely, SVD is first applied to an m × n document-feature matrix to factorize it into three elements,
, where
is a singular values in a k × k diagonal matrix,
is a m × k matrix containing all the sentences, and
is a k × n matrix containing all the words from
(). Since rows and columns are sentences and words in
, they become components for similar contexts and k-length word vectors,
in
.
Figure 2. Factorization of document-feature matrix by SVD. Matrix contains k-length word vectors for all the words (terms) in the corpus
After obtaining word vectors, LSS computes polarity scores of words, based on their proximity to seed words,
, weighted by their user-provided polarity
where is the cosine similarity between two word vectors. In sentiment analysis,
is +1 for positive seed words and −1 for negative seed words. The literature suggests that the optimal value of k in SVD is around 200–300 for synonym identification (Landauer & Dutnais, Citation1997; Turney & Littman, Citation2003).
Polarity Scores of Documents
LSS predicts polarity scores of documents by weighting word polarity scores, , by their frequency in the documents in the same way as Wordscores does. The polarity score of a document,
, which comprises of features,
, is:
where is the frequency of words and N is the total number of words in the document, excluding words that are not in the model.
Documents’ polarity scores are continuously and symmetrically distributed around the mean, so they are recentered by the global mean, , and rescaled by standard deviation,
, to make it easier for users to interpret. Such distribution of documents’ polarity scores is also ideal for post-hoc regression analysis to incorporate covariates.
Examples
Newspapers are rich sources of information for social scientists, especially in communication studies and international relations, but the volume of articles and complexity of their content make quantitative analysis difficult. They often employ dictionary analysis to study newspaper corpora for its robustness, but their measurement is constrained by the availability of dictionaries. LSD and its European language translations are available for North American and European newspapers but there is no such dictionary in other languages. Therefore, I demonstrate that LSS can be used for sentiment analysis of large English and Japanese newspaper corpora in this section. These corpora comprise articles on the economy and politics as common subjects in social science research.
Data
In the following examples, I employ LSS to perform sentiment analysis of economic news articles by the New York Times (n = 33,460) and political news articles by Japan’s Asahi Shimbun (n = 53,071). I downloaded the news articles with the keyword queries “econom* OR compan* OR job* OR consumer*” between 1980–2008 from the English newspaper and “政治 OR 政府” (“politi* OR government*”) between 1992–2018 from the Japanese newspaper. I collected older news articles from the New York Times to construct a corpus that overlaps or contains the sample used in Young and Soroka (Citation2012).
The authors classified the New York Times articles on the economy (n = 450) into “negative”, “neutral”, and “positive” employing three coders reflecting their overall tones and placed them on a 5-point scale: “very negative” (−2) if three coders say “negative”; “moderately negative” (−1) if two coders say “negative”; “neutral” (0) if at least two coders say “neutral” or all disagree with each other; “moderately positive” (+1) if two coders say “positive”, “very positive” (+2) if three coders say “positive”. Following their approach, I randomly sampled Asahi Shimbun articles (n = 500) and asked three native Japanese speakers to classify them in terms of the overall tone of the news articles. The agreement between the coders measured by Krippendorff’s alpha is only moderate high (α = 0.53), but their disagreement is considered due to the coders’ different sensitivity to sentiment and exploited to create the 5-point scale.
Analysis Pipeline
I developed text analysis pipelines using text preprocessing functions in the Quanteda package (Benoit et al., Citation2018) and a truncated SVD function in the RSpectra package (Qiu & Mei, Citation2019).Footnote4 English and Japanese texts require separate pipelines, but I kept their differences minimal. The steps are: (1) remove articles that contain the highest frequency (top 10%) of punctuation marks and numeric expressions or comprise only one sentence to exclude tables and captions; (2) split all the texts into sentences based on full-stop punctuation marks; (3) tokenize texts (both for English and Japanese texts) using the word boundary detection rules implemented in the International Components for Unicode (ICU); (4) identify and compound sequences of capitalized words (for English) or katakana and kanji characters (for Japanese) by contiguous collocations analysis to correct erroneous segmentation of proper nounsFootnote5; (5) remove grammatical and time-related word tokens listed in the Marimo stopwords listFootnote6; (6) remove numeric or punctuation-only tokens based on the Unicode character class; (7) select 2,000 words that frequently occur around subject-specific target words as model terms; (8) form document-feature matrices excluding features that occur less than 10 times in the corpora; (9) perform SVD of the matrices with k = 300 to obtain word vectors; (10) compute polarity scores for model terms with the word vectors and the seed words; and (11) compute polarity scores of original news articles with the fitted LSS models.
Selection of model terms in Step 7 is not an essential part of LSS but often necessary to apply the method to newspaper corpora because of the diversity of the content of the articles. Model term selection with subject-specific target words is aimed at identifying their modifiers and making models only sensitive to how target words are mentioned in the documents. This can be achieved by comparing the frequency of words inside and outside of the 5-word window around the target words using thesigned chi-square statistic (Scott, Citation2006). In these examples, target words are identical to the words in search queries: {“econom*”, “compan*”, “job*”, “consumer*”} for the economy and {“政治*”, “政府*”} for politics.
English Economic News
shows polarity scores of model terms in the LSS model fitted on the English corpus. On the right-hand side of the plot, I can confirm that words such as “good”, “fortune”, “well-managed”, “satisfaction”, and “optimistic” are scored strongly positive, and “prolonged”, “indebted”, “recession”, “crisis”, and “troubled” are strongly negative. Apart from “good”, all these words are non-seed words whose polarities were estimated by their semantic proximities to the seed words by the algorithm; commonly-used words such as “new” or “business” are located in the top-center of the plot as neutral words.Footnote7 However, “harm” is also scored strongly positive because it is used in sentences that express potential impact on the well-performing economy.
Figure 3. Polarity scores and frequency of words related to the economy (English). Positive and negative words are in the right- and left-hand side of the plots, respectively
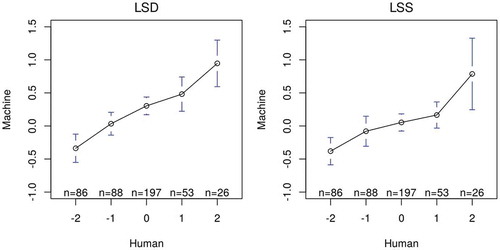
Following Young and Soroka (Citation2012), I computed mean sentiment scores for articles in the sample to compare the results of manual and machine coding. In , the mean scores correspond almost linearly with the manual coding in LSD, while the mean scores for moderately positive (+1) articles are lower than they should in LSS; the standard errors for very positive articles are also smaller in LSD than in LSS; both LSD and LSSscaled negative articles accurately. The overlapped 95% confidence intervals indicate that some of the mean differences are not statistically significant, but their standard errors will be much smaller when the sample is larger.
Figure 4. Distribution of sentiment scores for the economy (English) by LSD and LSS. Bars are 95% confidence intervals of the mean sentiment scores
shows the correlation between machine and manual coding in a longitudinal setting. Although the mean sentiment scores can be less accurate in both manual and machine coding as the articles are spread over 30 years, I can observe the strong correlation between them, especially humans and LSS until 1995. However, neither LSD nor LSS replicate negative overall shifts in manual coding from 1993; one of the largest discrepancies between humans and machines can be found in 2006 when the number of articles is the smallest. In this setting, the correlation between humans and machines is r = 0.62 in LSD and r = 0.70 in LSS (), although the correlation between LSD and LSS is only r = 0.34.
Figure 5. Correlation of sentiment scores for the economy (English) by humans, LSD (r = 0.62) and LSS (r = 0.70) in a longitudinal setting. Lines are mean sentiment scores and bars are number of articles
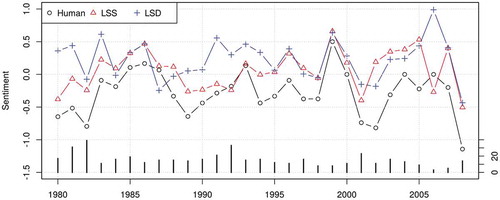
Figure 6. Correlation of annual sentiment scores for the economy (English) by humans, LSD (r = 0.62) and LSS (r = 0.70)
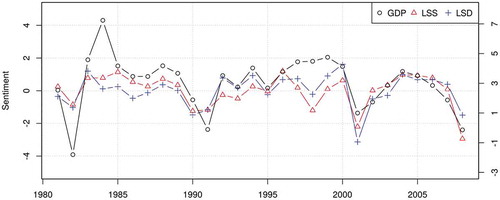
In order to demonstrate how LSS can be used in real research projects, I applied the fitted model to the entire corpus of the English articles (). I can confirm that the news articles were largely positive in the period of Reaganomics (1982–1989) but they became very negative after the savings and loan crisis; they became very positive after 1995, when America’s service sector enjoyed prosperity, but very negative after the occurrence of the economic crisis in Asia; the bursting of the dot-com bubble made their sentiment even more negative; the subprime mortgage crisis that triggered the global economic crisis also changed the sentiment dramatically. shows that mean sentiment scores by LSD and LSS are very strongly correlated with each other (r = 0.77) and with the changes in gross domestic product (GDP) of the United States (r = 0.65). Large discrepancies between the mean sentiment scores and the economic indicator are found in 1984 and 1997–1999, but the fall in sentiment in the latter period was caused mainly by the financial crisis in Asia.
Figure 7. Longitudinal analysis of news articles on the economy (English) in the New York Times corpus by LSS. Curves are LOESS smoothed sentiment scores with 95% confidence intervals. Circles are individual sentiment scores of 10,000 news articles
Figure 8. Correlation of sentiment scores for the economy (English) by the US GDP growth, LSD (r = 0.65) and LSS (r = 0.65)
Japanese Political News
shows the polarity scores of model terms in the fitted LSS on the Japanese corpus. I can find positive words such as “絶好” (ideal/perfect), “人類” (humanity), “民主化” (democratization), “安定” (stable), and “立国” (founding of a nation) on the right-hand side and negative words such as “私利私欲” (self-interest), “暴力団” (crime syndicates), “脱税事件” (tax evasion cases), “不透明” (lack of transparency), and “流用” (misappropriation) on the left-hand side; only “絶好” is the seed word among them. “問題” (problems/issues) and “考え” (ideas/opinions) are the top-center of the plot as neutral words. These words are intuitively positive or negative but “独裁” (dictatorship) is also scored positively because it is used in sentences about actions against dictators.
Figure 9. Polarity scores and frequency related to politics (Japanese). Positive and negative words are in the right- and left-hand side of the plots, respectively
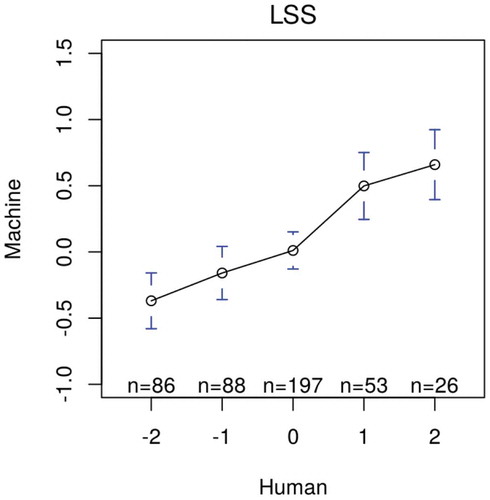
The model produces sentiment scores that correspond almost linearly to manual coding (). In the longitudinal setting, it overestimates negativity in several years but the trend strongly correlates with manual coding, achieving r = 0.70 ().
Figure 10. Distribution of sentient scores for politics (Japanese) by LSS. Bars are 95% confidence intervals of the mean sentiment scores
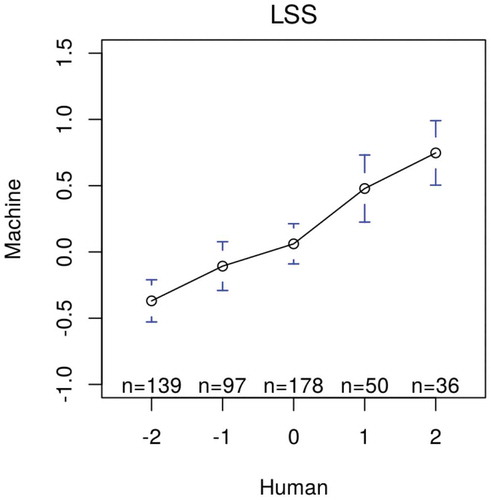
Figure 11. Correlation of sentiment scores for politics (Japanese) by humans and LSS (r = 0.70) in a longitudinal setting. Lines are mean sentiment scores and bars are number of articles
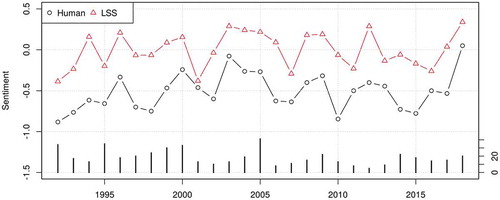
Figure 12. Correlation of annual sentiment scores for politics (Japanese) by humans and LSS (r = 0.70)
Seed Word Selection
The above examples are only sentiment analysis of news articles, but LSS has the ability to capture more subtle dimensions if different polarity words are provided as seed words (Baturo & Watanabe, Citation2019; Han, Citation2019; Kubo, Citation2019; Lankina & Watanabe, Citation2017; Yamao, Citation2019a, Citation2019b). Good seed words should have (1) strong polarity, (2) small ambiguity, and (3) corpus independence. Strong polarity is important because LSS can only recognize polarity of words between seed words; highly polarized words’ scores are truncated when they are outside of the area between seed words in the semantic space. Seed words should be unambiguous because polarity scores become inaccurate when seed words, or their word stems, match unrelated words; word stems are commonly used in dictionaries but not in LSS because seed words are applied to the dense word vectors and, therefore, not affected by the sparsity in the original document-feature matrix. Seed words should be corpus independent because such seed words cannot capture the semantic relationship in the population; seed words that occur only in a specific corpus tend to over-fit and have small scientific value because they cannot be use in other projects.
The high-dimensional semantic space cannot be visualized easily, but offers its snapshot with respect to sentiment. When words are position in the space in this way, “good” has very strong polarity, thus it is suitable as a positive seed word (it is one of Turney and Littman’s seed words); “optimistic” and “satisfaction” have weaker polarity, thus they are less suitable as positive seed words; “harm” has moderately strong polarity but its direction vary depending on the context, thus it is unsuitable as a seed word.
Seed word selection involves a choice between generic versus subject-specific word. Turney and Littman’s sentiment seed words are generic and used in many different domains, but it is often difficult to find generic seed words. In such cases, users can choose more subject-specific polarity words as seed words. I tentatively selected economic sentiment seed words that comprise intuitively positive or negative words () and produce mean scores corresponding to manual coding (). These seed words do not perform well in the longitudinal setting (r = 0.33), because the fitted LSS model is more sensitive to the economic well-being of individuals than to macro-economic trends, but such specificity is sometimes desirable.
Table 2. Experimental economic sentiment seed words
Figure 13. Distribution of sentient scores for the economy (English) by LSS with experimental seed words. Bars are 95% confidence intervals of the mean sentiment scores
I recommend that users choose seed words in the following manner: (1) make a list of polarity words that are related to the target dimension as candidates; (2) select words that have the strongest polarity and the smallest ambiguity from the candidates; (3) fit a LSS model with only one candidate and test if polarity scores of words are intuitively correct; (4) combine all the candidates that pass the checks to form an original seed word setFootnote8; and (5) check the validity of seed words by comparing scores produced by manual and machine coding on either individual or aggregated level. I also encourage users to publish all the seed words they used in research to allow other researchers to replicate the analysis and to refine the seed words collectively.
Corpus Construction
It is important for the users of LSS to construct a larger corpus to estimate semantic proximity of words accurately, but these documents should be sampled from the same population as the documents of interest. The easiest way to match the two samples is collecting all the documents of interest and fitting LSS on these documents as I did in the examples.
shows the results of bootstrapping, where I fitted LSS on sub-corpora by randomly sampling 5–100% of documents from the original corpus. The plots show that correlation coefficients vary widely when the model is fitted on small sub-corpora, but their variance becomes smaller when fitted on around half of the full corpus. This indicates that estimation of semantic proximity stabilizes when I provide 15,000 articles (600,000 sentences) in economy and 25,000 articles (500,000 sentences) in politics. The correlation coefficients are only r ≈ 0.6 in economy and r ≈ 0.5 in politics when fitted on 50% of the documents, but they increase as the size of corpora approaches 80%.
Figure 14. Correlation of annual sentiment scores between humans and LSS in bootstrapping. Circles are the correlation coefficients (n = 20 for each level) and broken lines are prediction by regression models
Users of LSS can resort to external documents such as news articles, speech transcripts, web pages, or a general language corpus (e.g., British National Corpus and Brown Corpus) when the target corpus is not large enough to fit the model, but they must be careful about the relationship between the target and external corpora in such cases: an external corpus should contain documents in which words are used in the same or similar ways as the target corpus.
Nevertheless, sizes of corpora for LSS are still much smaller than those for pretrained word-embedding models (e.g., FastText and BERT), because the users of LSS aim to capture the domain-specific relationship between words by fitting the model on the documents to which the model will be applied in analysis. This means that fitted LSS models have maximum internal validity but cannot be easily applied to different corpora unlike pretrained models.
Hyperparameter Optimization
I chose the size of word vectors k = 300 following the literature in the examples, but there is no guarantee that it is always the optimal value. In factor analysis, the values of k can be chosen based on the steepness of the change in eigenvalues in the scree plot (Cattell, Citation1966), but this method is applicable only to small values of k because changes in eigenvalues are usually very small in higher ranks. In topic models, the number of topics can be optimized based on the dissimilarity of word-topic distribution (Hou-Liu, Citation2018), but this method is inapplicable because singular vectors are uncorrelated by definition.
To assist choice of optimal k, I propose the cohesion statistic that captures similarity between components with respect to seed words. This statistic exploits the tendency that overall similarity of trimmed right singular vectors increases when they are capturing semantic relationships between seed words. When is trimmed right singular vectors that contain only elements that correspond to seed words in the original right singular vectors,
, the cohesion statistic,
, is defined:
where D is a k × k square matrix of dot products of trimmed right singular vectors and is row means of the lower triangle of D, excluding diagonal elements. It uses dot products to compute similarity of vectors while taking the magnitude of the values into account.
The cohesion statistic is useful in optimization of k because it measures whether the k-th component captures similar semantics to its lower-ranked components. When an additional component is dissimilar to existing components, it is considered unrelated or redundant. The cohesion statistic tends to increase sharply in 200 ≤ k ≤ 300 but decreases afterward. The fall in the statistic can be interpreted as the optimal value of k in the same way as eigenvalues in the scree plot.
The upper panels of show the relationship between the value of k and the accuracy of machine coding in the longitudinal settings: the highest correlation is 0.75 when k = 325 in economy and 0.77 when k = 314 in politics; the lowest is 0.50 when k =115 in economy and 0.35 when k = 109 in politics. The accuracy of machine coding rises gradually from the lowest points but falls sharply after the highest points. The default choice k = 300 is nearly optimal, but it may not be the case with different corpus and seed words.
Figure 15. Correlation coefficient and cohesion statistic in different sizes of word vectors. Circles are the original values and lines are smoothed values
The lower panels of the figure show the change in the cohesion statistic with different values of k. In economy, the cohesion rises from k = 200 to 225 but falls afterward until k = 325; this point coincided with the highest correlation coefficient (r = 0.76). In politics, the cohesion is high from k = 250 to 310; k = 314 is the beginning of the area with the highest correlation (r = 0.77). Such correspondence between the fall in the cohesion statistic and the correlation coefficient could be exploited by users to heuristically determine near-optimal k without tests against manually-coded documents.
Discussion
I have demonstrated that LSS produces results as good as LSD in the analysis of English economic news articles and it performs equally well in the analysis of Japanese political news articles. These examples provided evidence that LSS is a document scaling method that can be used in different domains and languages in which appropriate dictionaries are unavailable. LSS allows users to scale documents on different dimensions with manually chosen seed words and in different languages with minimal changes in text preprocessing steps. In the examples, the differences between the sentiment analysis of English articles on the economy and Japanese articles on politics were only seed words and the target words.
LSS has multiple strengths: (1) it can scale documents on a specific dimension, requiring only seed words to define the dimension of measurement; (2) it learns the semantic relationship between words without manual supervision; and (3) it works with documents in both European and Asian languages. Nevertheless, the examples also revealed the method’s weaknesses: (1) it does not have the same level of sensitivity or robustness as the dictionary because it estimates semantic proximity between words on the corpus; and (2) it also predicts polarity scores with relatively larger errors, especially in short documents, because it is a linear and naive model that ignores complex interactions between words in documents.
LSS becomes useful when users analyze large corpora, because they otherwise must pay high costs for training with supervised machine learning models or give up pre-defining dimensions of measurement with unsupervised machine learning models. Although LSS predicts scores for individual documents with relatively large errors, their group means are strongly correlated with manual scores, making measurement errors negligible in aggregated-level analysis (Boukes et al., Citation2020). This became clear when LSS outperformed LSD (r = 0.70 vs. 0.62) and their correlation increased from r = 0.34 to r =0.74 as the size of the samples grew in the longitudinal scaling of economic news. Since LSS scores are continuously and symmetrically distributed around the mean, users can apply regression analysis with document meta-information (e.g., time, author, sources, etc.) to eliminate measurement errors.
The ability of LSS to perform larger corpora in different languages opens the possibility of comparative analysis of textual data in very different languages. It has been difficult for researchers to perform crosslingual analysis with existing methods due to the cost, but LSS allows them to achieve this only by collecting comparable documents and selecting functionally equivalent seed words. For example, they can construct corpora of the New York Times and Asahi Shimbun articles from over decades without translation and directly compare them in terms of economic or political sentiment using the English and Japanese sentiment seed words. Such crosslingual analysis also requires equivalent pre-processing of texts, but multilingual lexical resources (e.g., Marimo stopwords list) are also becoming readily available.Footnote9
The accuracy of document scaling by LSS depends on the quality of text preprocessing, hyperparameter optimization, and seed word selection. It is not only LSS that is sensitive to text preprocessing, but users should be careful about which documents and features to include. It is easy to construct a large corpus of news articles but it can be noisy, containing tables, figures and boilerplates, whose elements can skew the estimation of semantic proximity. I recommend that users remove extremely rare words, grammatical words, time-related expressions, and internet addresses (URL and e-mail addresses) from the document-feature matrix, but I would also like to call for awareness that latent semantic analysis requires infrequent contextual words to estimate semantic proximity accurately.Footnote10 This is exactly why I separate the selection of model terms from the construction of document-feature matrices.
I have adopted Turney and Littman’s sentiment seed word set and created its Japanese equivalent in the examples without scrutiny, but we should not see any of the seed word sets as final and universally applicable. These seed words could be used in different projects, but they may not have enough polarity or specificity in certain contexts (e.g., “positive” is not a good word in the public health context). Furthermore, we should also reconsider if sentiment is the most relevant dimension in our substantive fields because the concept of sentiment is very fuzzy and atheoretical (Puschmann & Powell, Citation2018). Use of such a catch-all dimension may not be justified when scaling of documents on a specific dimension is easy with LSS.
LSS has already been employed in different projects (Baturo & Watanabe, Citation2019; Han, Citation2019; Kubo, Citation2019; Lankina & Watanabe, Citation2017; Yamao, Citation2019a, Citation2019b), but there is a lot of work to do to make the method more reliable. Word vectors are heavily affected by text processing in the same way as unsupervised algorithms. Therefore, we must establish rules to determine which words to remove and which words to compound before creating word vectors. I employed non-contiguous collocation analysis to select 2,000 model terms, but this is not based on the statistical significance of the chi-squire test. Therefore, we must discover the way to determine the optimal number as a general problem in analysis of large high-dimensional data. I proposed the cohesion statistic as a yardstick, recognizing the difficulty for users to determine the hyperparameter, but its usefulness must be tested in future projects.
Further, there are three possibilities of technological development for LSS that should be explored in the future studies. First, LSS is currently based only on latent sematic analysis, but other word-embedding models could be used for the same purpose. For example, LSS can scale documents more accurately with Glove when corpora are smaller, thanks to the denser structure of the feature-cooccurrence matrix, on which the algorithm estimates semantic proximity. Second, although users of LSS aim to maximize the internal validity of document scaling by fitting the model on their own corpora, it is possible to adopt pretrained word-embedding models for greater external validity (e.g., FastText and BERT). Third, although LSS is developed primarily for document scaling, it can be adapted for document classification. Multinomial classification can be performed by computing document scores with multiple unipolar LSS models and discovering dimensions for which the documents have highest scores.
Finally, I demonstrated that it became possible to analyze thousands of documents without domain- or language-specific tools thanks to recent technological and methodological development. I wish more social scientists specializing in East Asian and Middle Eastern countries would employ quantitative text analysis to study social and political issues in the regions and their global implications.
Replication Data
The data to replicate this study is made available at https://doi.org/10.7910/DVN/UF7PVM.
Acknowledgments
I am thankful to student assistants of Waseda University, Ritsu Kitagawa, Takeo Hara, and Masanori Kikuchi for conducting manual coding of the Japanese news articles.
Disclosure Statement
No potential conflict of interest was reported by the author.
Additional information
Funding
Notes
1. See “China’s success at AI has relied on good data”, The Economist, January 2, 2020, https://www.economist.com/technology-quarterly/2020/01/02/chinas-success-at-ai-has-relied-on-good-data.
2. The Japanese sentiment seeds words could be used to analyze documents in other fields but only formal documents, because they are not commonly used in daily conversation. Therefore, users who wish to perform sentiment analysis of informal documents (e.g., online comments, social media posts etc.) must collect different seed words.
3. An example of analogy is that the relationship between “king” and “queen” is equivalent to the relationship between “man” and “woman”.
4. The Quanteda (v2.0.0) and LSX (v0.84) packages are used in the examples.
5. Contiguous collocation analysis estimates strength of association between words in sequence by log-linear model (c.f. Blaheta & Johnson, Citation2001).
6. Marimo stopwords are available in the stopwords package on CRAN.
7. Neutral words are either used in (1) neutral contexts or (2) both positive and negative contexts in the corpus frequently. Therefore, words that have multiple meanings (homonyms and polysemy) or those often appear with negation tend to be neutral words.
8. Note that a single polarity word can make up a seed word set but it should be used only for testing because very small sets tend to lack reliability.
9. Marimo covers English, Japanese, German, Arabic, Hebrew, and Chinese (traditional and simplified).
10. For example, I found removal of all the single hiragana characters, which are usually grammatical words, from the document-feature matrix decreases the correlation between humans and the machine by 5–10%.
References
- Baturo, A., & Watanabe, K. (2019). Insults and criticism in international diplomacy: Evidence from the United Nations general assembly. POLTEXT.
- Benoit, K., Conway, D., Lauderdale, B. E., Laver, M., & Mikhaylov, S. (2016). Crowd-sourced text analysis: Reproducible and agile production of political data. American Political Science Review, 110(2), 278–295. https://doi.org/10.1017/S0003055416000058
- Benoit, K., & Laver, M. (2003). Estimating Irish party policy positions using computer wordscoring: The 2002 election – A research note. Irish Political Studies, 18(1), 97–107. https://doi.org/10.1080/07907180312331293249
- Benoit, K., Watanabe, K., Wang, H., Nulty, P., Obeng, A., Müller, S., & Matsuo, A. (2018). quanteda: An R package for the quantitative analysis of textual data. Journal of Open Source Software, 3(30), 774. https://doi.org/10.21105/joss.00774
- Blaheta, D., & Johnson, M. (2001). Unsupervised learning of multi-word verbs. Proceeding of the Acl/Eacl 2001 Workshop on the Computational Extraction, Analysis and Exploitation of Collocations, Toulouse, France (pp. 54–60).
- Blei, D. M., Ng, A. Y., & Jordan, M. I. (2003). Latent dirichlet allocation. Journal of Machine Learning Research, 3(January), 993–1022. https://doi.org/10.5555/944919.944937
- Boukes, M., van de Velde, B., Araujo, T., & Vliegenthart, R. (2020). What’s the tone? Easy doesn’t do it: Analyzing performance and agreement between off-the-shelf sentiment analysis tools. Communication Methods and Measures, 14(2), 83–104. https://doi.org/10.1080/19312458.2019.1671966
- Breiman, L. (2001). Random forests. Machine Learning, 45(1), 5–32. https://doi.org/10.1023/A:1010933404324
- Catalinac, A. (2018). Positioning under alternative electoral systems: Evidence from Japanese candidate election manifestos. American Political Science Review, 112(1), 31–48. https://doi.org/10.1017/S0003055417000399
- Cattell, R. B. (1966). The scree test for the number of factors. Multivariate Behavioral Research, 1(2), 245–276. https://doi.org/10.1207/s15327906mbr0102_10
- Ceron, A., & Splendore, S. (2018). From contents to comments: Social TV and perceived pluralism in political talk shows. New Media & Society, 20(2), 659–675. https://doi.org/10.1177/1461444816668187
- Cortes, C., & Vapnik, V. (1995). Support-vector networks. Machine Learning, 20(3), 273–297. https://doi.org/10.1007/BF00994018
- Deerwester, S. C., Dumais, S. T., Landauer, T. K., Furnas, G. W., & Harshman, R. A. (1990). Indexing by latent semantic analysis. JASIS, 41(6), 391–407. https://doi.org/10.1002/(SICI)1097-4571(199009)41:6<391::AID-ASI1>3.0.CO;2-9
- Denny, M. J., & Spirling, A. (2018). Text preprocessing for unsupervised learning: Why it matters, when it misleads, and what to do about it. Political Analysis, 26(2), 168–189. https://doi.org/10.1017/pan.2017.44
- Eshima, S., Imai, K., & Sasaki, T. (2020). Keyword assisted topic models. ArXiv:2004.05964 [Cs, Stat]. http://arxiv.org/abs/2004.05964
- Graham, J., Haidt, J., & Nosek, B. A. (2009). Liberals and conservatives rely on different sets of moral foundations. Journal of Personality and Social Psychology, 96(5), 1029
- Greenacre, M. J. (1984). Theory and applications of correspondence analysis. Academic Press.
- Grimmer, J., & Stewart, B. M. (2013). Text as data: The promise and pitfalls of automatic content analysis methods for political texts. Political Analysis, 21(3), 267–297. https://doi.org/10.1093/pan/mps028
- Han, O. (2019). Moderating refugees’ threat in German newspapers in 2008–2018. International Conference on Resources and Human Mobility, Thailand: Mahidol University.
- Hand, D. J. (2006). Classifier technology and the illusion of progress. Statistical Science, 21(1), 1–14. https://doi.org/10.1214/088342306000000060
- Hoffman, A. M., & Jengelley, D. H. (2020). Does bottom-line pressure make terrorism coverage more negative? Evidence from a twenty-newspaper panel study. Media, War & Conflict, 1750635219896001. https://doi.org/10.1177/1750635219896001
- Hou-Liu, J. (2018). Benchmarking and improving recovery of number of topics in latent Dirichlet allocation models. http://vixra.org/abs/1801.0045
- Jaidka, K., Ahmed, S., Skoric, M., & Hilbert, M. (2019). Predicting elections from social media: A three-country, three-method comparative study. Asian Journal of Communication, 29(3), 252–273. https://doi.org/10.1080/01292986.2018.1453849
- Kim, J., Brossard, D., Scheufele, D. A., & Xenos, M. (2016). “Shared” information in the age of big data: Exploring sentiment expression related to nuclear energy on Twitter. Journalism & Mass Communication Quarterly, 93(2), 430–445. https://doi.org/10.1177/1077699016640715
- King, G., Lam, P., & Roberts, M. E. (2017). Computer-assisted keyword and document set discovery from unstructured text. American Journal of Political Science, 61(4), 971–988. https://doi.org/10.1111/ajps.12291
- Klüver, H., & Sagarzazu, I. (2016). Setting the Agenda or responding to voters? Political parties, voters and issue attention. West European Politics, 39(2), 380–398. https://doi.org/10.1080/01402382.2015.1101295
- Kubo. K. (2019). 争われる正義 : 旧ユーゴ地域の政党政治と移行期正義 [Contested justice : party politics and transitional justice in the former Yugoslavia] Tokyo: Yuhikaku..
- Landauer, T. K., & Dutnais, S. T. (1997). A solution to Plato’s problem: The latent semantic analysis theory of acquisition, induction, and representation of knowledge. Psychological Review, 104(2), 211–240. https://doi.org/10.1037/0033-295X.104.2.211
- Lankina, T., & Watanabe, K. (2017). Russian spring’ or ‘spring betrayal’? The media as a mirror of Putin’s evolving strategy in Ukraine. Europe-Asia Studies, 69(10), 1526–1556. https://doi.org/10.1080/09668136.2017.1397603
- Laver, M., Benoit, K., & Garry, J. (2003). Extracting policy positions from political texts using words as data. American Political Science Review, 97(2), 311–331. https://doi.org/10.1017/S0003055403000698
- Laver, M., & Garry, J. (2000). Estimating policy positions from political texts. American Journal of Political Science, 44(3), 619. https://doi.org/10.2307/2669268
- Levy, O., Goldberg, Y., & Dagan, I. (2015). Improving distributional similarity with lessons learned from word embeddings. Transactions of the Association for Computational Linguistics, 3, 211–225. https://doi.org/10.1162/tacl_a_00134
- Martindale, C. (1975). Romantic progression: The psychology of literary history. Hemisphere Publishing.
- Matsuo, A., Sasahara, K., Taguchi, Y., & Karasawa, M. (2019). Development and validation of the Japanese moral foundations dictionary. PLoS One, 14(3), e0213343. https://doi.org/10.1371/journal.pone.0213343
- Mikolov, T., Sutskever, I., Chen, K., Corrado, G. S., & Dean, J. (2013). Distributed representations of words and phrases and their compositionality. ArXiv:1310.4546 [Cs, Stat]. http://arxiv.org/abs/1310.4546
- Mostafa, M. M. (2020). Global halal food discourse on social media: A text mining approach. The Journal of International Communication, 26(2), 211–237. https://doi.org/10.1080/13216597.2020.1795702
- Mostafa, M. M., & Nebot, N. R. (2020). The Arab image in Spanish social media: A Twitter sentiment analytics approach. Journal of Intercultural Communication Research, 49(2), 133–155. https://doi.org/10.1080/17475759.2020.1725592
- Nielsen, F. Å. (2011). A new ANEW: Evaluation of a word list for sentiment analysis in microblogs. ArXiv:1103.2903 [Cs]. http://arxiv.org/abs/1103.2903
- Nielsen, R. A. (2017). Deadly clerics: Blocked ambition and the paths to Jihad. Cambridge University Press. https://doi.org/10.1017/9781108241700
- Onat, I., Cubukcu, S., Demir, F., & Akca, D. (2020). Framing anti-Americanism in Turkey: An empirical comparison of domestic and international media. International Journal of Media & Cultural Politics, 16(2), 139–157. https://doi.org/10.1386/macp_00021_1
- Pennington, J., Socher, R., & Manning, C. (2014). Glove: Global vectors for word representation. Proceedings of the 2014 Conference on Empirical Methods in Natural Language Processing (EMNLP), Doha, Qatar (pp. 1532–1543).
- Petkevic, V. (2018). Media sentiment analysis for measuring perceived trust in government. Žiniasklaidos Požiurio Analize Pasitikejimo Vyriausybe Patikimumui Matuoti, 50(3), 23–45. https://doi.org/10.15823/su.2018.17
- Petrocik, J. R., Benoit, W. L., & Hansen, G. J. (2003). Issue ownership and presidential campaigning, 1952–2000. Political Science Quarterly, 118(4), 599–626. https://doi.org/10.1002/j.1538-165X.2003.tb00407.x
- Proksch, S.-O., Lowe, W., Wäckerle, J., & Soroka, S. (2019). Multilingual sentiment analysis: A new approach to measuring conflict in legislative speeches. Legislative Studies Quarterly, 44(1), 97–131. https://doi.org/10.1111/lsq.12218
- Puschmann, C., & Powell, A. (2018). Turning words into consumer preferences: How sentiment analysis is framed in research and the news media. Social Media + Society, 4(3), 205630511879772. https://doi.org/10.1177/2056305118797724
- Qiu, G., Liu, B., Bu, J., & Chen, C. (2009). Expanding domain sentiment Lexicon through double propagation. Proceedings of the 21st International Jont Conference on Artifical Intelligence, 1199–1204. https://www.ijcai.org/Proceedings/09/Papers/202.pdf
- Qiu, Y., & Mei, J. (2019). RSpectra: Solvers for large-scale Eigenvalue and SVD problems. R package version 0.16-0. https://CRAN.R-project.org/package=RSpectra
- Roberts, M., Stewart, B., Tingley, D., Lucas, C., Leder-Luis, J., Gadarian, S., Albertson, B., & Rand, D. (2014). Structural topic models for open ended survey responses. American Journal of Political Science, 58(4), 1064–1082. https://doi.org/10.1111/ajps.12103
- Rodrigues, U. M., Niemann, M., & Paradies, Y. (2019). Representation of news related to culturally diverse population in Australian media. Journalism, 1464884919852884. https://doi.org/10.1177/1464884919852884
- Rudkowsky, E., Haselmayer, M., Wastian, M., Jenny, M., Emrich, Š., & Sedlmair, M. (2018). More than bags of words: Sentiment analysis with word embeddings. Communication Methods and Measures, 12(2–3), 140–157. https://doi.org/10.1080/19312458.2018.1455817
- Sabatovych, I. (2019). Do social media create revolutions? Using Twitter sentiment analysis for predicting the maidan revolution in Ukraine. Global Media and Communication, 15(3), 275–283. https://doi.org/10.1177/1742766519872780
- Scott, M. (2006). WordSmith tool. Oxford University Press.
- Slapin, J. B., & Proksch, S.-O. (2008). A scaling model for estimating time-series party positions from texts. American Journal of Political Science, 52(3), 705–722. https://doi.org/10.1111/j.1540-5907.2008.00338.x
- Smirnova, A., Laranetto, H., & Kolenda, N. (2017). Ideology through sentiment analysis: A changing perspective on Russia and Islam in NYT. Discourse & Communication, 11(3), 296–313. https://doi.org/10.1177/1750481317699347
- Stone, P. J., Dunphy, D. C., Smith, M. S., & Ogilvie, D. M. (1966). The general inquirer: A computer approach to content analysis. MIT Press.
- Su, L. Y.-F., Cacciatore, M. A., Liang, X., Brossard, D., Scheufele, D. A., & Xenos, M. A. (2017). Analyzing public sentiments online: Combining human- and computer-based content analysis. Information, Communication & Society, 20(3), 406–427. https://doi.org/10.1080/1369118X.2016.1182197
- Sumbaly, R., & Sinha, S. (2009). Sentiment mining in large news datasets. cs.stanford.edu/people/rsumbaly/files/Sentiment_Mining.pdf
- Turney, P. D., & Littman, M. L. (2003). Measuring praise and criticism: Inference of semantic orientation from association. ACM Transactions on Information Systems, 21(4), 315–346. https://doi.org/10.1145/944012.944013
- Watanabe, K. (2017). Measuring news bias: Russia’s official news agency ITAR-TASS’ coverage of the Ukraine crisis. European Journal of Communication, 32(3), 224–241. https://doi.org/10.1177/0267323117695735
- Watanabe, K., & Zhou, Y. (2020). Theory-driven analysis of large corpora: Semisupervised topic classification of the UN speeches. Social Science Computer Review, 089443932090702. https://doi.org/10.1177/0894439320907027
- Welbers, K., Van Atteveldt, W., & Benoit, K. (2017). Text analysis in R. Communication Methods and Measures, 11(4), 245–265. https://doi.org/10.1080/19312458.2017.1387238
- Yamao, D. (2019a). ISのインパクトをはかる:イラク主要3紙の量的テキスト分析から [Measuring the Imapct of Isramic States: Quantitative Analysis of Three Iraqi newspapers] (Relational Studies on Global Crises). Chiba University. http://www.shd.chiba-u.jp/glblcrss/online_papers/onlinepaper20190819.pdf
- Yamao, D. (2019b). 送り出し国で難民危機はいかに報道されたのか:アラビア語主要紙の量的テキスト分析から [News Coverage of Refugees in Source Countries: Quantitative Analysis of the Major Arabic Newspapers] (Relational Studies on Global Crises). Chiba University. http://www.shd.chiba-u.jp/glblcrss/online_papers/onlinepaper20191227.pdf
- Young, L., & Soroka, S. (2012). Affective news: The automated coding of sentiment in political texts. Political Communication, 29(2), 205–231. https://doi.org/10.1080/10584609.2012.671234