ABSTRACT
Internet memes are a fundamental aspect of digital culture. Despite being individual expressions, they vastly transcend the individual level as windows into and vehicles for wide-stretching social, cultural, and political narratives. Empirical research into meme culture is thriving, yet particularly compartmentalized. In the humanities and social sciences, most efforts involve in-depth linguistic and visual analyses of mostly handpicked examples of memes, begging the question on the origins and meanings of those particular expressions. In technical disciplines, such as computer science, efforts are focused on the large-scale identification and classification of meme images, as well as patterns of “viral” spread at scale. This contribution aims to bridge the chasm between depth and scale by introducing a three-step approach suitable for “computational grounded theoretical” studies in which (1) an automated procedure establishes formal links between meme images drawn from a large-scale corpus paving the way for (2) network analysis to infer patterns of relatedness and spread, and (3) practically classifying visually related images in file folders for the purpose of further local, hermeneutic analysis. The procedure is demonstrated and evaluated on two datasets: an artificially constructed, structured dataset and a naturally harvested unstructured dataset. Future horizons and domains of application are discussed.
Introduction
Internet memes are an integral part of contemporary digital culture, reflecting and shaping cultural mind-sets (Seiffert-Brockmann et al., Citation2018). As rapidly spreading, malleable, humorous entities, they are windows into and vehicles for wide-stretching social, cultural, and political narratives (Katz & Shifman, Citation2017; Nissenbaum & Shifman, Citation2017). Memes are the products of human creativity and lie at the core of participatory and “remix” culture (Jenkins et al., Citation2013; Sobande, Citation2019).
Internet memes take on many forms, including text snippets, images, and videos. And even though they might appear as isolated trivial expressions at first glance, they are definitely not. Each expression doubles as a personal expression as well as an index of a shared narrative that reflects a sense of mass connectedness, traveling, and traversing online networks at such immense rates that they have been regularly considered as being “viral,” “infectious,” or “contagious” (Kumar, Citation2015; Wang & Wood, Citation2011). Internet memes often successfully blend popular culture with political references which make them powerful reflections of deeper public concerns and critique on society and politics (Denisova, Citation2019; Milner, Citation2013a; Nissenbaum & Shifman, Citation2018; Shifman, Citation2014; Sobande, Citation2019). In her seminal introduction on the topic, Shifman (Citation2014) argues that Internet memes can be broken down into three dimensions. A first dimension comprises the content of a specific text, the idea it expresses. The second dimension covers the form, that is the visual and audible features that make up the expression. And third, the stance of its creators and adaptors toward the text, ranging from re-creation to altering its discursive orientation.
The study of internet memes, what they are composed of, what meaning they carry, and how they continually travel has gained significant importance in media and communication studies. It is an intriguing, developing, yet difficult field of inquiry. On the one hand, the metadata of meme posts on dedicated platforms (e.g., knowyourmeme.com) carry an in-built visibility that supports analyses. Examples of particular memes are easily found and openly accessible. On the other hand, the sheer scale, pace, and endless diversity make it notoriously hard to get an overview and to distinguish broader patterns in the bulk of memes that traverse the internet, how they spawn, mix, and how they evolve (Bauckhage et al., Citation2013; Katz & Shifman, Citation2017; Zannettou et al., Citation2018).
This challenging situation has caused an apparent divide between in-depth qualitative visual and/or linguistic analysis of targeted examples of particular meme templates or memes tied to a particular topic, and computer science-based technical analysis of larger patterns of spread. The former does an excellent job at seeking out the social, cultural, and political narratives that underlie specific (collections) of specific memes, contextualizing their broader significance. However, this depth may come at the expense of an oversight into the broader “memescape.” In contrast, computer science-based research is heavily invested in identifying memes in enormous corpora and in pattern detection in the spread and evolution of (those) memes, albeit not directly answering those fundamental questions on the meaning of memes and their cultural significance, nor lining up their methods with the practices of media studies.
This contribution aims to narrow this gap between scale and depth, by proposing an approach that facilitates “computational grounded theoretical” research (Nelson, Citation2020; Ophir et al., Citation2020). Its focus is on the visual components in internet memes, and still images in particular. The aim is to provide a rigorously tested method that constructs a networked-based structure of a corpus of images based on the occurrence of shared visual features in these images. We specifically introduce and evaluate an automated procedure that is made up of three open-source Python scripts that can easily be used, even with a limited technical background. These scripts consecutively pre-process input images, run an image feature matching algorithm, and render network graphs and sorted images folders of the results. In essence, this procedure draws on what Shifman refers to as the form factor of memetic expressions to infer relatedness. The input images do not require any labeling, nor is any training needed. The output is (a) an overall network graph of all connected images, (b) subgraphs of components of meme images that are grouped together but isolated from other groups in the graph, and (c) image file folders that contain groups of linked, original images based on that network component membership.
The overall network graph allows to sketch an overview of the broader contours of a corpus of meme images, to explore its structure, and to seek out key regions of interest. The component subgraphs and automated grouping into folders enable an efficient and in-depth analysis of the diversity and communalities within the contents and stances of the filtered meme image collections, whilst being well informed about their prominence and relatedness to other memes. In other words: this method leverages techniques used in computer vision to automatically map out and classify larger datasets, preparing them for the in-depth, interpretative analysis that a meme study requires and that media researchers are accustomed to, hence allowing to articulate both scale and depth in a multi-staged approach.
Our proposed method is a needed addition to the methods toolbox of any meme researcher. Yet, its domain of application reaches well beyond the analysis of meme templates, meme spread dynamics, and meme evolutions. Our feature matching protocol can be used in any type of project in which researchers wish to cluster visual content. Especially in the context of global media rituals or media events (such as news coverage of terrorist attacks or social uprisings such as Black Lives Matter), the proposed method could help journalists as well as digital journalism scholars to establish meaningful connections between visuals and news sources on a scale that was previously strenuous to achieve.
This contribution is structured as follows. We first further expand on the tenets and accomplishments of the most relevant research traditions involved with the study of internet memes and their communicative properties. This brief overview is followed by consolidating the goals and the scope of the method that is discussed in this contribution. In the empirical part, the mechanics of this method are discussed, as well as its performance at multiple parameter settings on a labeled representative test data set. This data set contains 600 items, 300 of which were hand-picked to represent related examples of 50 popular meme templates randomly selected from knowyourmeme.com. Subsequently, an unlabeled set of 2,055 items harvested from 9GAG’s fresh page is classified and its outcomes are discussed. This is followed by a general discussion on possible applications in the context of researching shared visual elements and the spread of specific meme templates. Finally, we conclude with a discussion on the merits, but also the limitations of the approach, as well as possible future expansions.
Empirical research on internet memes
Various fields of scholarship have taken a profound interest in internet memes. And yet, that scholarship is strongly compartmentalized. In the social sciences and humanities, the main focus is on building an in-depth understanding of the communicative and discursive properties of memes. As digital artifacts at the nexus of language, culture, and society, the lion’s share of research on internet memes has relied mainly on (critical) discourse analytic approaches (Andreasen, Citation2020; Hakoköngäs et al., Citation2020; Massanari & Chess, Citation2018; Milner, Citation2013b; Moritz et al., Citation2012; Wiggins, Citation2020), rhetorical and linguistic analyses (Iloh, Citation2021; Mielczarek, Citation2020; Onanuga, Citation2020), or feminist perspectives (Drakett et al., Citation2018; Harlow et al., Citation2020; Massanari & Chess, Citation2018).
Intrigued by memes’ fast spread and their omnipresence in information spaces, researchers engage in a variety of studies covering various domains, ranging from memes as critiques of – and playful interactions with–popular culture (Iloh, Citation2021; Shifman, Citation2012, Citation2014) to memes as the vehicles and mechanics of politics (Ross & Rivers, Citation2017). The shared denominator of most of these studies is that they conceptualize and analyze memes as expressions of bottom-up or grassroots like sentiments, whereby the memes are considered as ultimate markers or currency to negotiate norms and stereotypes, express collective identities, and reject or challenge hegemony (Duile, Citation2021; Gal et al., Citation2016; Kligler-Vilenchik & Thorson, Citation2016; Peck & Good, Citation2020).
As such, it may not come as a surprise that most studies look at memes in the context of online activism or protest (Olesen, Citation2018) and mass social movements such as #MeToo and #distractinglysexy (Andreasen, Citation2020; Brantner et al., Citation2020). More recently, scholars have been using memes as research windows into previously hard-to-study insular networks of (right-wing) extremists such as Boogaloo (Wiggins, Citation2020), Proud Boys (DeCook, Citation2018), Soldiers of Odin (Hakoköngäs et al., Citation2020), and the Neo-Nazi organization called The Nordic Resistance Movement (Askanius, Citation2021). In those latter cases, there is a particular interest in how memes are used as seemingly innocent carriers for misinformation and/or propaganda and how they work as devices used by fringe communities to have their discourses infiltrate the mainstream (Askanius, Citation2021; Davey & Ebner, Citation2017; Glitsos & Hall, Citation2019; Ichau et al., Citation2019; Marwick & Lewis, Citation2017).
While this kind of studies possesses a unique capacity to describe memetic imagery and their underlying meaning(s) to the most minute detail, there are two main arenas of challenges that are intrinsically related to this strand of research, independent of the standard limitations that come with qualitative research of cultural texts (Nelson, Citation2020).
In the first place, most studies in this line of research make use of relatively small, handpicked samples. Samples are often chosen purposefully and intentionally, which entails a subjective selection and inclusion process driven by specific criteria that are deemed relevant for the given study’s objectives (Ross & Rivers, Citation2017). For example, Andreasen (Citation2020) uses digital ethnography and a snowballing method to identify and collect “funny” memes on three different distinct online platforms (9GAG, Reddit, and Imgur) for further analysis of online humor. Similarly, most meme studies have used sample sizes that can be regarded as relatively small, varying somewhere between N = 16 (Ross & Rivers, Citation2017) to N = 1,000 (Segev et al., Citation2015). Important to note here is that a small, purposeful sample is in and of itself not per se problematic. However, in the context of meme research such samples may risk to over- or under-attribute certain meanings to specific memetic features, because – by design – they omit information of the alternative meanings the same meme may carry within the discourse under scrutiny.
In second place, this line of research runs the risk to be somewhat disconnected from the boundaryless reality of the wider memescape. With a targeted, hermeneutic approach, we may be over- or underestimating and/or misinterpreting the importance of specific memetic imagery in a discourse because we turn a blind eye to the fact that the same memetics can also be applied, mixed, and remixed into parallel or even counter discourses. Therefore, these approaches, when used without a complimentary aerial perspective, come with substantial challenges in terms of ecological validity regarding the broader memescape. Although qualitative studies often strive less for representativeness and aim for theoretical generalization, the question we ponder here is: can small and purposive samples with clearly articulated analytical borders adequately and accurately reflect the ad random nature of the actual meme universe?
Conversely, technical disciplines have approached memes from a different perspective. Within applied mathematics, computer science, and engineering, the research focus is diverse, although it can be subdivided into two broad categories: (a) the identification and categorization of memes and (b) their spread and virality, both at significant scale.
The identification of memes is a significant technical challenge that is generally engaged to tackle multiple practical problems ranging from open-ended descriptive purposes to tools for online platform moderation and audience response mining. Depending on the problem that needs to be addressed, a range of techniques is used. A notable cutting-edge example is a recent classifier dubbed “Meme Hunter” (Beskow et al., Citation2020), which is a multi-modal supervised deep learning model intended to initially classify images as either memes or non-memes. The classifier, applicable to photo-based images, relies on face and text extraction and uses image features, which are shared image characteristics. An image could be automatically classified as a meme if it contains the typical text overlay and if there are faces involved. In a test case, the Meme Hunter classification outcomes were subsequently clustered together using a deep ranking algorithm, which is particularly well suited to match images with similar global appearance. That is, it combines images with the same aggregate properties, rather than grouping them based on local elements. These outcomes were modeled in a network and were analyzed for their chronology and their spread by using Google’s Vision API to reverse image search the items in their test data, retrieving the domain names at which the images and similar versions were indexed. Meme Hunter is a powerful example of the potential of automated image processing to handle large datasets.
Another commonly used, yet conservative and less performant technique for automated content analysis of memetic imagery and image macros, is template matching (Dubey et al., Citation2018). With a deep convolutional neural network (CNN), Dubey and colleagues (Dubey et al., Citation2018) created a so-called “Sparse Match Algorithm,” in order to classify memes on the basis of a given template image (i.e., an image macro). This enabled the identification of different memetic offspring and mutations and provided insights into how a meme template is remixed. However, a serious disadvantage of this method is that you need to know a priori what you are looking for, because you are testing a pool of images against a pool with templates. Given the dynamic nature of memes, this may be therefore not the most suitable approach, even though it allows for relatively fine-grained content analysis of the images (Dubey et al., Citation2018).
Besides identifying and classifying meme imagery, technical disciplines are also increasingly occupied with developing an in-depth understanding of the spread dynamics of memes and particularly with predicting meme virality in order to develop better meme generators. While an unimaginable number of memes are produced on the internet every day, only a few of them go “viral” (Ling et al., Citation2021; Weng et al., Citation2014). This raises the question of whether a meme’s popularity can be modeled as a function of specific semantic “ingredients” (Oliveira et al., Citation2016; Shubeck & Huette, Citation2015; Weng et al., Citation2014). Remarkably, the studies in this research domain have adopted mainly a textual and network analytic approach, by analyzing the propagation of memes as hashtags (Ratkiewicz et al., Citation2010) and meme phrases (Oliveira et al., Citation2016) across different popular online platforms. Weng et al. (Citation2014) conclude that it is mainly network community structures that predict popularity rather than meme semantics. In contrast, Zannettou and colleagues (Zannettou et al., Citation2018) have opted for tracking meme propagation over several web communities by means of a visual cluster analysis. Using a dataset of 160 million images and a procedure called perceptual hashing, they created clusters of similar memes on the basis of isolated visual components. They conclude that meme imagery linked to racist expressions, such as Pepe the Frog and The Happy Merchant, increase the popularity of the meme within a given web community as well as the likelihood to cascade into other online platforms. More recently, Ling and colleagues (Ling et al., Citation2021) trained a machine learning model that could effectively predict meme virality based on three dimensions: composition, subjects, and target audience. Their findings suggest that close-up images of a concrete character together with short, emotionally laden texts are more likely to go viral than memes with no clear subjects and long texts.
However, the problem with the above-mentioned technical approaches is that they are excellent in clustering and tracking memes on the basis of their overall textual and visual similarities (i.e., what Shifman (Citation2014) would call the content and form dimensions, respectively), yet they miss out on two crucial communicative aspects of memes.
Firstly, they do not take into account that meme texts and visuals are constantly being mixed and remixed into new, blended meme templates. Indeed, meme mutations may very well contain texts and imagery from two or more different meme templates (i.e., cross-overs). The bird’s-eye perspective of above-mentioned approaches is not capable of detecting this because they are tied to overall characteristics.
Secondly, current technical approaches lack the possibility to analyze the complex, differential, and multi-layered cultural meanings that the same visual and textual key features might have in different contexts (i.e., the stance dimension (Shifman, Citation2014)). In fact, a recent computer scientific study acknowledged that human conscience and interpretation is key in truly understanding and thus classifying internet memes (Priyadarshini & Cotton, Citation2019).
At this point, it becomes evident that internet memes have become a focal point around which numerous scientific research traditions have actively converged, but where insufficient interdisciplinarity is being pursued. Indeed, while the study of memes does perhaps not fit neatly into any one academic discipline, it is not a stand-alone field either. Therefore, we believe that a computational social scientific approach is needed, in which in-depth interpretative, hermeneutic analysis is integrated with automated image processing techniques. In contrast to the context-specific qualitative approaches (focusing on depth) and the culturally insensitive technical bird’s-eye approaches (focusing on scale), the current study proposes an integrative avenue that combines the best of both worlds. This is accomplished through a meaningful symbiosis between the robust pattern-recognition capacities of computers and the excellent interpretive qualities of humans. In that sense, the current study provides an instrument for researchers following a “computational grounded theoretical” approach (cfr. Nelson (Citation2020) and Ophir et al (Citation2020)) to address modern communication questions.
Materials and methods
Scope
Accomplishing the integration of scale and depth requires a methodological scope that aligns automated, computational analysis of a large corpus of images with the requirements of a qualitative study. The goal of this contribution is to outline and evaluate the implementation of a fine-grained, sensitive image classification technique based on local similarities, rather than just overall image property similarities. The identification of these similarities then allows to draw an overviewing map of the structure of an image corpus and empowers the qualitative researcher to make decisions on what regions to further explore and analyze.
The concrete goal of the following empirical analysis is to test whether an approach based on feature matching (cf. infra) is suitable to actually detect formal similarities and to reflect the underlying semantic network structure of image-based memes. In what follows, the proposed procedure is both introduced and evaluated.
Test samples
Sample 1: an artificial, human-labeled test dataset
The first test dataset contains 600 items. It is constructed to test the performance of image point feature matching in detecting communalities in meme images. Fifty percent of the test dataset consists of examples of 50 popular meme templates that were randomly selected from knowyourmeme.com’s “popular meme” page. These meme templates and links to their descriptions are enumerated in . We wish to emphasize that the inclusion of a meme template and its expressions in the dataset is by no means an endorsement on our behalf of the messages they convey.
Table 1. Overview of the 50 meme templates included in the labeled test dataset.
Per meme template, six examples were handpicked from Google Image Search. The objective was to vary the examples in image size, quality, and degrees of image processing (e.g., pasting in new faces, adding text) to test the robustness of the method. More specifically, we explicitly sought to sample images with varying levels of overlayed text and alteration or replacement of original key elements with others (e.g., swapping faces, adding filters, adding in objects, object rotation, mashups with other templates). The remaining 50% of the test set is made up of 300 distractor images that were scraped from 9GAG’s Fresh page. The images used as distractors do not use any of the 50 meme templates. Their purpose is to challenge the overall performance of the method in reconstructing the structure of the dataset by adding additional visual variation or noise in the dataset.
Sample 2: a real-life scraped dataset
The second test dataset consists of 2,055 images that were scraped from 9GAG’s Fresh page at the beginning of October 2020. The contents of these images were unknown prior to the analysis and are meant to resemble organically posted visual online content. It caters for a second, less formal test of the procedure, as well as a demonstration on how to handle data and fine-tune a solution on data with an unknown structure.
Key feature matching
The task at hand involves comparing images. This means that we need a method to describe the characterizing features of an image in order to compare it to others. A go-to method is feature extraction (OpenCV, Citation2020a; Tyagi, Citation2019a). This technique is a machine-translation of how humans interpret visual stimuli: we look at distinctive combinations of shapes and textures that pop out. Similarly, feature extraction is a procedure that analyzes an image for information-dense areas where there is substantial variation going on. A solid background, for example, is not informative. In contrast, a shape that is rich in contours and has a particular texture is, as it comprises regions of pixels with contrasting pixel brightness. As a means of illustration, shows the extracted features drawn on an original image.
Figure 1. Extracted key features drawn on an image.
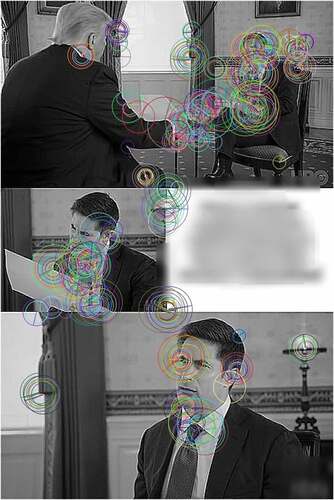
The example uses an Orientated FAST and Rotated BRIEF (ORB) feature detector as included in the OpenCV Python package (OpenCV, Citation2020b; Rublee et al., Citation2011; Tyagi, Citation2019b). The Oriented FAST algorithm scans each pixel of a grayscale image and compares the surrounding pixels for their brightness. If the surrounding area is darker or brighter, it is flagged as a key point. It does so at different resolutions of the image, making it a scale-invariant approach. The Rotated BRIEF algorithm describes the local appearance around each key feature, i.e., it establishes the pattern that surrounds a key point being robust for changes in scale, rotation, translation, and illumination.
Feature matching compares the descriptors of two images. The algorithm that is used in our implementation is the Brute-Force Matcher. For each descriptor in one image (i.e., a key point and its surroundings), it will compare that descriptor with the descriptors in a second image. The descriptor in the second image that matches the one in the first image best is considered a match. That match is expressed as a distance. The smaller the distance, the stronger the descriptors resemble each other. A larger distance implies that the descriptors are less similar.
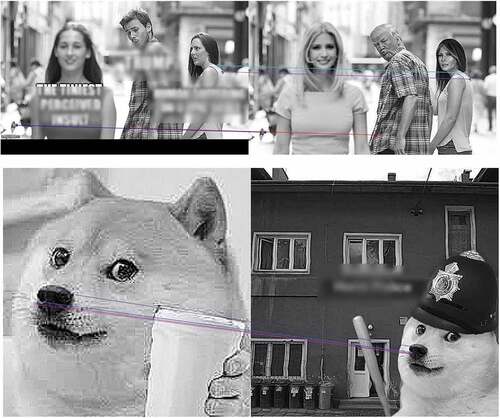
In the images below, all features with matching descriptors of two images are shown as connecting lines. (top) shows all feature matches, regardless of their distance. It is clear that some of the lines connect features in the image that are not the same. Those are poor matches at a great distance. In (bottom), only matches with a distance (d) equal to or lower than 25 are shown. These much stricter matches clearly connect identical key features in both images.
Figure 2. Visualization of all key feature matches between two images (top) and those key features matches filtered for matches with a distance equal to or below 25 (bottom).

Overall procedure
The feature matching implementation in this contribution entails a procedure that consists of three related Python scripts, available in open source at the first author’s GitHub page [https://github.com/uq-courtois/memes]. These scripts are used to consecutively (a) pre-process the images, (b) identify images with matching key features, and (c) generate a network graph of the data and identify components. The tests were run on an Apple MacBook Pro with a 2.4 GHz Quad-Core Intel Core i5 processor.
Script 1: pre-processing
Internet memes are usually highly processed images of varying quality and sizes. As such, they require considerable pre-processing to increase the likelihood of detecting distinctive image features. The images in the test set were first sharpened and normalized to brighten particularly dark images and to darken particularly bright images.
Another issue is the fact that internet memes usually include considerable amounts of text that are blended into the image. Typically, but not necessarily, the characteristic Impact typeface is used for captions, regardless of the meme template (Brideau & Berret, Citation2014). When feature matching would be run on the raw images, such text – and the letters it is composed of – is likely to emerge as false-positive matches. This is because the shape and edges of a letter are optically well-articulated, which would lead to a match between shapes of letters, rather than substantive visual elements in the images. This would result in matching images that do not share any formal or semantic link, which would render the method completely useless. To avoid this issue, the images need to be processed in such a fashion that all text as distinctive features are excluded.
An effective method to remove features from a region within the image is to blur, which dilutes the underlying pattern and makes them less susceptible to feature extraction (Sieberth et al., Citation2014). The identification of text regions in our implementation draws on an Efficient Accurate Scene Text (EAST) detector (Zhou et al., Citation2017). Such detectors are based on deep learning and are instrumental to identify the coordinates of predicted rectangular text regions in images. In this case, the pre-trained “frozen_east_text_detection” model was used (Rosebrock, Citation2018).
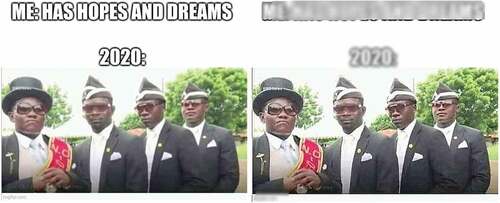
The EAST detector identifies regions within the image that, with a certain probability, contain text. It is essential to identify and blur as much text as possible to avoid false positive matches purely based on text-related image features. For that reason, the accepted probability for a region to be identified as containing text is set at a low default of 25% or higher. The excessive layering of blurred regions, which would generate sharp borders that are in itself prone to provoking false positives, is avoided by calculating and using the Intersection over Union (IoU) of identified regions (Sheremet, Citation2020). In case of excessive overlap of two text regions – a threshold of .80 in this case – only the shared region in the image is blurred using a Gaussian blur. shows an example of a before and after of the pre-processing.
Figure 3. Image before and after sharpening, normalizing and text blurring (left and right respectively).
The Python script responsible for sharpening, normalization and text blurring of each image uses multiprocessing to distribute the computational demand over the machine’s available CPU cores (”Python” 3.8,” Citation2020). This approach optimizes the efficiency and reduces the time needed to run through the process. Pre-processing the test set of 600 items took 844.37 seconds (1.41 seconds per image on average), running eight processes in parallel.
Script 2: key feature matching
The second Python script loads all possible unique image pairs, one by one. Each image is converted from an RGB color image to a grayscale image and temporarily resized to a width of 800 pixels. In line with the earlier description, we used the Oriented FAST and Rotated BRIEF (ORB) algorithm to extract feature descriptors and the BruteForce Matcher algorithm to compare features. These algorithms are free to use and are included in the open computer vision library in Python (CV2).
The script goes on to compare and match the descriptors of all possible 179,700 unique pairs in the dataset of sample 1 (i.e., N(N-1)/2). Per image pair, the key point descriptors of the first images are compared with those of the second image, only to keep the best possible match. As mentioned earlier on, each key point match comes with a distance measure, indicating how good the key point match is. The smaller the distance, the better the two finally retained descriptors match. When two images share a substantial amount of matches at a short distance, they are considered a match. shows a side-by-side comparison of extracted features.
Figure 4. Matched key image features for example, of the “Distracted Boyfriend” and “Doge” memes. Note that these side-by-side examples are heavily processed by their creators.
The decision to classify two images as related starts with the outcome of the feature matching procedure. Per pair of images, a connection is established based on two cutoff parameters. That is: how many feature matches (m) are required at what maximum distance (d). As we are unaware of any clearly documented priors in the context of research on internet memes, the optimal settings needed to be researched empirically and verified by the human eye. We ran 2,500 performance tests at various settings. Each combination of m (range 1–50) and d (range 1–50) was tested. This allowed to establish direct matches, indicating that two images share features. Subsequently, also indirect matches were considered, allowing for transitivity. The guiding logic is that the aim is to establish collections – or classes – of related images through their networked structure. If images x and y, as well as y and z matched, x and z were considered matches too.
For each of the 2,500 test runs, the degrees of true positive (TP), true negative (TN), false positive (FP), and false negative (FN) connections were computed. These are the key components of a confusion matrix, which is a commonly used instrument to assess the performance of a classification task (He & Ma, Citation2013). The confusion matrix was built by comparing the known networked structure of the dataset with the outcomes of each test run. The dataset contains 50 groups of 6 related images and 300 distractors. This means that out of the 179,700 possible connections between the 600 meme images, only 750 connections are valid. shows the performance metrics for each of the 2,500 tests. It shows that less restrictive parameter settings increase the number of false positives and true positives (i.e., higher allowed feature distance and lower matches), whereas more restrictive settings are penalized by more false negatives and true negatives. Both are communicating vessels, so it is key to find the right trade-off.
Figure 5. Performance metrics for each of the 2,500 tests. The darker the color the higher the proportion of each metric (e.g., the darker the red in the upper right pane, the more false positives). The white dot is the optimal solution suggested on the basis of the highest geometric mean (see below).
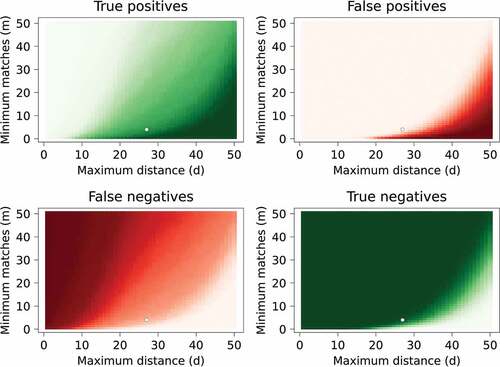
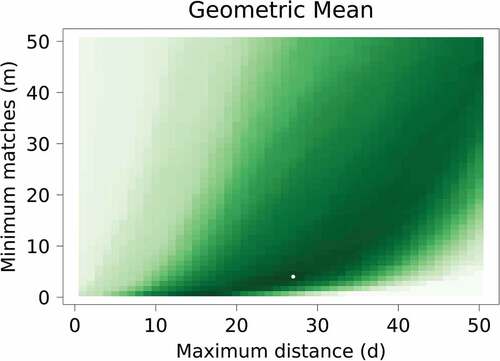
Because in the test set, there are only 750 valid connections and 178,950 possible connections are invalid, we are dealing with an imbalanced classification task. Typical measures of accuracy and recall are ill-suited to evaluate the performance of detecting a minority class (i.e., valid connections). Instead, we use the geometric mean as an evaluation criterion (Barandela et al., Citation2003; He & Ma, Citation2013; Sun et al., Citation2009). This metric balances both sensitivity and specificity. Sensitivity expresses the rate of true positives (TP) and the extent to which this positive class was identified [TP/(TP + FN)]. Specificity works the other way around and expresses the performance of identifying the negative class [TN/(TN + TP)]. The geometric mean is square root of the multiplication of sensitivity and specificity. The parameter combination with highest geometric mean (.84) is d = 27 and m = 4, which is plotted with a white dot both in the confusion matrix as well as in , in which the darker the color of the area, the higher the geometric mean.
Figure 6. A plot of the geometric mean for each combination of the parameters. The darker the color of the area, the higher the geometric mean. The highest geometric mean (0.84) was found for the setting d = 27, m = 4, indicated by the white dot.
Script 3: generating network (sub)graphs and image allocation
The outcome of the feature matching can easily be visualized as a network graph. For the solution with the preferred settings suggested by the results from the confusion matrix and the geometric mean (d = 27, m = 4) this has been done in . It shows the components based on the image examples of a single template at the periphery of the graph. In the middle, there is a single, much larger component. Closer inspection of that component and its edges reveals that this larger component is an amalgamation of multiple smaller, uniform, subcomponents. The edges between these subcomponents are made up by edges based on feature matches that only mildly exceed the d setting.
Figure 7. Graph visualization of the feature matching outcome with solution reached through the confusion matrix and the geometric mean: d = 27 and m = 4.
Eyeballing the outcome in an overall graph and subgraphs of its components offers a clear view of the networked structure of the matched images. Moreover, based on these extracted components, the original image files are easily grouped into folders. These functions are integrated in the third Python script, largely drawing on methods from the NetworkX Python module (NetworkX, Citation2020).
To demonstrate its potential, and to further test the method, the 2,055 images in the second dataset with organic posts from 9GAG were processed and analyzed for feature matches (d= 27, m= 4). The pre-processing took .95 hours, while the matching process required 5.42 hours (2,110,485 combinations). At the first run, the script generates images of the overall network graph and each individual component subgraph. In total, 93 components were generated. Per network component, a folder is generated that contains image files with the side-by-side matches of the individual pairs. The image file name contains the number of total key feature matches with a distance lower than the preset cutoff (d = 27, m = 4). This information allows assessing the overall efficacy of the outcome. This was done by means of a manual inspection of all 93 components by the research team. We found an 88% efficacy (i.e., computer-coder agreement) of the computer-generated classification solution. Which means that 82 out of the 93 components, consisted of meaningful matches (i.e., at least two images with the same memetic features).
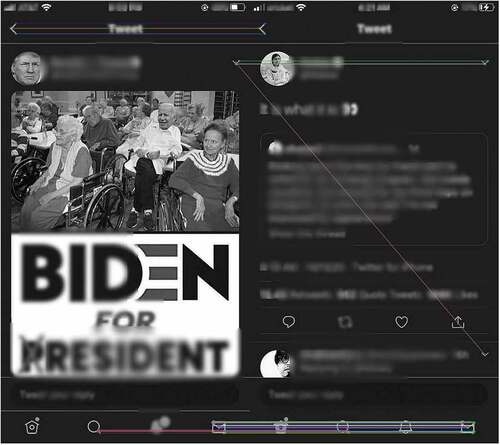
After further exploring the feature matching images in the folders, it became clear that the smaller components generally contained sensible, correct matches. The large components however consisted of smaller sense-making components that were sparsely linked by (semantic) mismatches. This is in most part explained by the prevalence of screenshots from social media platforms such as Twitter and Facebook, but also mobile phone screenshots. Their distinctive interface features are valid matches, although linking these images lacks particular meaning apart from the fact that they originate from the same social media platform and/or mobile operating system (see Appendix 1). Another issue is the occurrence of images that only contain text and no further visual features. The borders of the blurred areas in these pictures are picked up as matches (albeit relatively sparse matches). There is a large number of edges based on m values that only mildly exceed the cut-off of four. If the m criterion for the matches in this component would be increased to for example, 15, this component would break down into smaller components that are semantically much more homogenous.
The third script has the inbuilt capability to impose a more stringent post hoc number of feature matches for a particular component (or a group of components). The script requires inputting the number of the local component and the desired new cutoff, upon which it redraws the network graphs and updates the file structure for further evaluation. This allows researcher to explore the best suitable solution for a given research project.
When a suitable solution is finally accepted, all graphs are redrawn and component folders with the original images are generated. The subgraph images are expanded with a collage of the images that it contains. Examples of these images are listed in , while provides a snapshot of the file folder structure.
Figure 8. Examples of generated component subgraph and image collages concatenations.
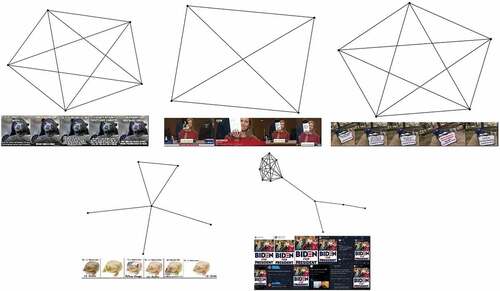
Figure 9. Snapshot of file folder structure, grouping original images in a folder per component.
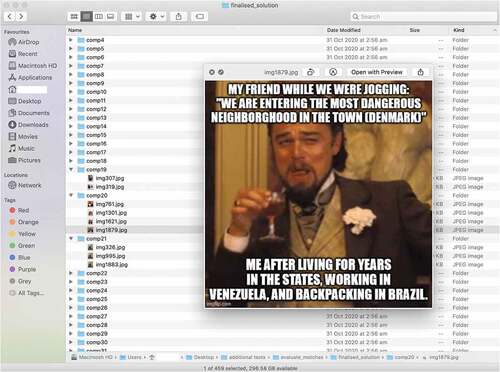
At this stage, the pattern-recognition task of the computer has been completed. Now, the interpretative, hermeneutic analysis can begin. The folder structure on the computer that the scripts above have produced enables the researcher to dive into a specific community with shared visual features. An optic categorizing of memetic imagery is meaningful as it facilitates two types of qualitative, hermeneutic analyses of the memes in a given corpus. First, it allows researchers to scrutinize and understand how the same memetic imagery – or rather its distinct visual features (what Shifman (Citation2014) would call form) – are used in different discursive contexts (what Shifman (Citation2014) call content and stance). To be more specific: demonstrates that folder “comp20” contains images with the “Leonardo DiCaprio Laughing”-meme template. This now enables researchers to inquire how this exact meme template is used to convey differential, sometimes perhaps diametrically opposing messages. This is particularly relevant in the context of online social movement research. For example, the still image taken from the video of George Floyd’s murder, became a meme in support of the Black Lives Matter movement and the fight against systemic racism, whilst at the same time a visual symbol for the counter-movement Blue Lives Matter (Hristova & Howard, Citation2021).
Second, it allows researchers to study an important yet currently under-explored field in meme research which is “cross-over” or “blended” visual features. As discussed before, memes are an inherent part of “remix” culture (Jenkins et al., Citation2013; Sobande, Citation2019). Using the current approach, images will be clustered following optic similarity and mapped out in a network structure which allows to identify specific “bridge” features. These elements have a unique memetic meaning in and of themselves that requires further interpretative analysis as they can link two or more templates together. The above proposed approach gives meme researchers and visual communication scholars in general an unprecedented opportunity to assess the scale of the interconnectedness of meme templates.
Potential applications
The outlined method leaves ample room for further customization based on specific research questions, as explained and demonstrated in the following sections.
Shared visual elements
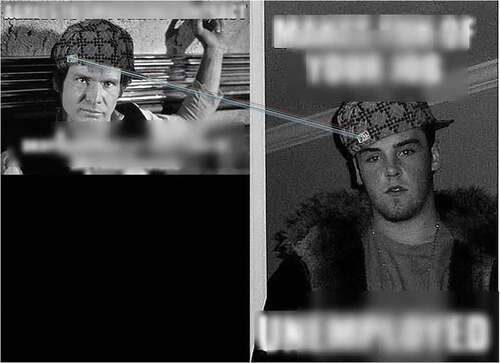
A key feature of internet memes is their recognizability. They share common elements that audiences immediately pick up on. These elements are overly visual in nature, ranging from straightforward image macros that only require customized text, to more complex and elaborate collages of image objects. Moreover, templates are often blended, making instances of cross-over commonplace. Take for example, the popular meme of “Scumbag Steve,” which carries meanings of opportunism and disregard of others. A key element in the original image macro is Steve’s distinctive hat. The popularity of the original meme led to multiple derivatives in which the only reference to the original template was the use of this hat. As shows, this is picked up on by the template matching algorithm, successfully linking instances of the original template with its derivatives that draw on the same meaning (). This is important as it allows to document the evolution of memes as they might grow increasingly abstract.
Figure 10. Feature matches based on Scumbag Steve’s iconic hat, carrying over its original meaning to subsequent versions.
Template matching is also productive in identifying cross-sections of memes. It is common practice to collapse the semantics of two or more memes in one. In the example below, the “Drakeposting” and “Woman yells at Cat” memes are blended into a single image (). This crossover establishes a connection between original memes (or at least parts of them), which over time might grow more popular than the original memes themselves. A limitation is that the cross-over should be distinctive in its features to be identified. For example, the Drakeposting meme’s essence is to juxtapose an adverse situation with a preferred one (i.e., Drake’s discarding turning away versus his appreciative finger pointing). This implicit template sparked various adaptations picturing other protagonists in a similar configuration. This semantic link is clearly identifiable by a knowledgeable audience. However, feature matching will obviously not pick up on this since there are no significantly shared features in the images. Still, when narrowing down common patterns to the sharedness of explicit visual features, template matching is clearly productive. It especially adds value considering that such matches connect otherwise disconnected network components. It could, for example, be worthwhile to further investigate images that “bridge” saturated components within the image network.
Figure 11. Image that combines two meme templates, allowing to link other expressions of both memes into a single component.

The analysis of both the adoption of isolated elements into new memes and the integration of multiple existing memes are worthwhile, especially when that analysis includes data sources beyond the pure image features. Such data sources include text titles and captions directly related to the image and textual discussions surrounding the image. This enables to further assess in what context memes are used, and how potentially different viewpoints on for example, social and political issues appropriate the same meme templates and elements, or alternatively develop their own visual language to communicate about the issue at hand (cfr. what Shifman refers to as stance).
Spread of specific memes
A feature of internet memes is that they traverse platforms and networks. Appropriations of meme templates often carry cultural, social, and political significance as they might defend certain viewpoints or attack opposing ones. Under the veil of humor, these positions have the potential to spread virally, for example, from fringe communities to popular social media platforms (Zannettou et al., Citation2018). In such instances, originally controversial viewpoints infiltrate mainstream debates and discussions in a covert way. The conditions and pathways of memes going viral are important research venue supported by the feature matching method but remain still underexplored.
A potential approach is to, for a longer period of time, gather meme images from different platforms that are likely to be accountable for the initial spread of memes, such as 4chan, 9GAG, and Reddit. Simultaneously, and also stretched out in time, discussions related to for example, mainstream news article posts on Facebook could be monitored for image uploads. Using feature matching, similar images can be identified and linked. Not only does it facilitate to identify which memes are mainstreamed (or not), it also enables a longitudinal analysis of the trajectory of mainstreaming.
Media events, rituals, and digital journalism (studies)
The proposed method does not necessarily end with user-generated content such as memes. Instead, it could be used to investigate the genealogy of any type of imagery well-beyond memetic discourses. Essentially, our feature matching protocol can be used in any type of project in which researchers wish to cluster visual content. For example, an alternative and meaningful application could be a large-scale analysis of news media reporting of significant world events. In the context of such media events (see Hepp & Couldry, Citation2009), e.g., terrorist attacks, protest movements, sports games, researchers could use feature matching to identify trends and communalities in press photos across time periods and/or regions. By analyzing the visual news media discourse in this fashion, it is not only possible to investigate networks of symbols/image features, it becomes also possible to identify clusters of media outlets on the basis of their shared visual features and the underlying semantics.
Discussion
This contribution has sought to outline and evaluate a modus operandi to automatically detect common features in image memes and to map out those communalities in a network structure. Added to that, meme images are classified into discrete network components and grouped together in a distinct file directory. The approach, which is capable of automatically handling substantial corpora of images, thus not only visualizes but also practically sorts and groups visually related images with the purpose of further in-depth qualitative analysis. The significance of having such a tool available is apparent: it enables and streamlines communication research on the substance and spread of memes based on (locally) shared form, while preparing data for subsequent in-depth analysis of content and stance.
Based on our experiment with both an artificial labeled test dataset and a representative unlabeled natural dataset, it is fair to conclude that a key feature matching approach is a feasible way forward. It allows researchers to analyze these large datasets and establish an overview of patterns of visual relatedness relatively quickly and automatically. This visual relatedness can be quite detailed, as the images are mapped and compared locally on their key features, rather than only looking at the overall properties. Capturing visual relatedness in network graphs further unlocks the potential of network analysis, possibly illuminating key visual features and how they cross over. The outlined approach is not only worthwhile in its own right but also helpful in guiding more commonplace interpretative, qualitative work (cf. Segev et al., Citation2015). It has the potential to identify common patterns that are worth exploring in depth and practically organizes the data to accomplish just that. The approach not only guides and eases further analysis, it even legitimizes inclusion criteria for further local, qualitative visual analysis.
The most significant challenge in automating visual analysis is to develop and implement methods that are capable of finding the right balance between exact visual similarity and the trivial similarity. A focus on exact similarity is unhelpful because it is a key property of memes to evolve and be constantly altered, both textually and visually. Only looking for exact matches would imply a gross under and misrepresentation of the very essence of meme culture (cf., Dubey et al. Citation2018). In contrast, a too liberal approach to similarity would render useless results, as it would be distracted by meaningless common elements. The relevance of this contribution, laying out the mechanics and performance of an approach based on image feature matching, lies exactly in looking for that sweet spot. It illuminates the performance at varying parameter settings in terms of acceptable key feature match distance and the number of matches that are required to qualify as a match. The strength of the implementation is found in its specific approach to image pre-processing and its openness to select and post-hoc (locally) restrict the parameter settings concerning the number of required feature matches to return an overall positive match. As such, interpretation and parameter settings continually go hand in hand, giving researchers considerable control over the classification process.
Yet, there are several limitations to this approach. A first limitation is the inevitable reality of having to deal with false negatives (i.e., formal links that are not picked up by the feature matching procedure). The reasons for false-negative results are manifold. Memes are often poor in image quality, which in itself undermines the possibility of accurate feature detection. For instance, a sloppy copy/paste of a meme template into a larger image, in which other elements are blended with much clearer features, actively hinders the feature detection and thus also the matching process. Also, images – and meme templates – can be that heavily processed that they significantly lose resemblance with other template examples. As argued, this is at least in part countered by merely growing the corpus of images and increasing the likelihood of matches through transitivity. Moreover, meme images can share a template in meaning, and have no technically identifiable communality with the original template whatsoever. Hence, implicit references to a common template or distant adaptations go unnoticed. Another difficulty is found in the appropriation of still frames of audiovisual productions. For example, two images from the same scene have a clear semantic link, but their image features could differ completely. There are possible mitigation strategies, such as for example, including facial recognition as an added feature to establish a match. This is definitely a venue for further development. The same is true for expanding the approach to gif-files and video memes, as the current implementation is restricted to still images as the unit of analysis.
Such further expansions will come at the cost of having to recruit significant computational resources. This ties in directly with a second key limitation, namely the computational demands and the scalability of the approach. Both the pre-processing – due its reliance on text detection – and the matching procedures are computationally intensive. Moreover, the processing time of the matching procedure increases exponentially when the corpus of images increases. After all, each image’s feature is compared with all others’ during this process. A possible mitigation strategy is to first build a repository of template references. This a database with multiple examples of known meme templates. Each new image could then be compared with only these images to identify matches and label those new data. This is especially applicable for research problems that focus on the spread of a series of priorly identified memes. It is not helpful when such a pre-identification is not feasible, which is the case for research problems where meme templates of interest are not defined at the onset. However, although this implementation fully functions – and is available in open source – we will seek to further improve its performance in the future by simplifying the code base and increasing the efficiency of data handling, and by further researching alternative, potentially more efficient algorithms to extract and match image features. An option is to replace the currently used open-source ORB Brute-Force matcher algorithm by a faster FLANN-based matcher (Fast Library for Approximate Nearest Neighbors; OpenCV, Citation2020c), which is however, to the best of our knowledge currently not available in the CV2 library due to intellectual property issues.
In conclusion, this method proves effective in furthering communication research on internet memes. In spite of its limitations, it shows promise to increase the scale of research projects and the possibility to engage in quantitative, statistical analysis. At the same time, it shows potential to inform and streamline common qualitative visual analysis efforts that are currently dominant in the study of the visual properties and semantics of internet memes.
Disclosure statement
No potential conflict of interest was reported by the author(s).
Additional information
Notes on contributors
Cedric Courtois
Cedric Courtois is a senior lecturer at the University of Queensland (Australia). He specialises in digital and computational methods in media and communication research. Besides methodological development, his research centres on the user consequences of online platforms with a particular focus on how users and algorithmic mechanisms interact.
Thomas Frissen
Thomas Frissen is Assistant Professor in Digital Technology and Society at the Faculty of Arts and Social Sciences, Maastricht University. His research centres around questions concerning the influences of digital media and technologies in various ‘dark’ and vicious cultures and behaviours. His past research has focused on Salafi-jihadism, right-wing extremism, and communities of Non-Suicidal Self-Injurious behaviour. His current research concentrates on the spread dynamics of (extreme) conspiracy theories, fake news, and memes in the online information ecosystem. Thomas uses a research toolbox that consists of both classical as well as computational social scientific research methods.
References
- Andreasen, M. (2020). ‘Rapeable’ and ‘unrapeable’ women: The portrayal of sexual violence in internet memes about #MeToo. Journal of Gender Studies, 30(1), 1–12. https://doi.org/10.1080/09589236.2020.1833185
- Askanius, T. (2021). On frogs, monkeys, and execution memes: exploring the humor-hate nexus at the intersection of neo-nazi and alt-right movements in Sweden. Television & New Media, 22(2), 147–165. https://doi.org/10.1177/1527476420982234
- Barandela, R., Sánchez, J. S., Garcı́a, V., & Rangel, E. (2003). Strategies for learning in class imbalance problems. Pattern Recognition, 36(3), 849–851. https://doi.org/10.1016/S0031-3203(02)00257-1
- Bauckhage, C., Kersting, K., & Hadiji, F. (2013). Mathematical models of fads explain the temporal dynamics of internet memes. Proceedings of the International AAAI Conference on Web and Social Media, 7(1), 22–30. https://doi.org/10.1145/2502081.2502117
- Beskow, D. M., Kumar, S., & Carley, K. M. (2020). The evolution of political memes: Detecting and characterizing internet memes with multi-modal deep learning. Information Processing & Management, 57(2), 102170. https://doi.org/10.1016/j.ipm.2019.102170
- Brantner, C., Lobinger, K., & Stehling, M. (2020). Memes against sexism? A multi-method analysis of the feminist protest hashtag #distractinglysexy and its resonance in the mainstream news media. Convergence, 26(3), 674–696. https://doi.org/10.1177/1354856519827804
- Brideau, K., & Berret, C. (2014). A brief introduction to impact:‘The meme font.’ Journal of Visual Culture, 13(3), 307–313. https://doi.org/10.1177/1470412914544515
- Davey, J., & Ebner, J. (2017). The fringe insurgency. Connectivity, convergence and mainstreaming of the extreme right. Institute for Strategic Dialogue. http://www.isdglobal.org/wp-content/uploads/2017/10/The-Fringe-Insurgency-221017.pdf
- DeCook, J. R. (2018). Memes and symbolic violence:# proudboys and the use of memes for propaganda and the construction of collective identity. Learning, Media and Technology, 43(4), 485–504. https://doi.org/10.1080/17439884.2018.1544149
- Denisova, A. (2019). Internet memes and society: Social, cultural, and political contexts. Routledge.
- Drakett, J., Rickett, B., Day, K., & Milnes, K. (2018). Old jokes, new media–Online sexism and constructions of gender in Internet memes. Feminism & Psychology, 28(1), 109–127. https://doi.org/10.1177/0959353517727560
- Dubey, A., Moro, E., Cebrian, M., & Rahwan, I. (2018). Memesequencer: Sparse matching for embedding image macros. Proceedings of the 2018 world wide web conference, 1225–1235. https://doi.org/10.1145/3178876.3186021
- Duile, T. (2021). Challenging hegemony: Nurhadi-Aldo and the 2019 election in Indonesia. Journal of Contemporary Asia, 51(4), 537–563. https://doi.org/10.1080/00472336.2020.1748896
- Gal, N., Shifman, L., & Kampf, Z. (2016). “It gets better”: Internet memes and the construction of collective identity. New Media & Society, 18(8), 1698–1714. https://doi.org/10.1177/1461444814568784
- Glitsos, L., & Hall, J. (2019). The pepe the frog meme: An examination of social, political, and cultural implications through the tradition of the darwinian absurd. Journal for Cultural Research, 23(4), 381–395. https://doi.org/10.1080/14797585.2019.1713443
- Hakoköngäs, E., Halmesvaara, O., & Sakki, I. (2020). Persuasion through bitter humor: Multimodal discourse analysis of rhetoric in internet memes of two far-right groups in Finland. Social Media+ Society, 6(2), 1–11. https://doi.org/10.1177/2056305120921575
- Harlow, S., Rowlett, J. T., & Huse, L. K. (2020). ‘Kim Davis be like … ’: A feminist critique of gender humor in online political memes. Information, Communication & Society, 23(7), 1057–1073. https://doi.org/10.1080/1369118X.2018.1550524
- He, H., & Ma, Y. (2013). Imbalanced learning: Foundations, algorithms, and applications. Wiley.
- Hepp, A., & Couldry, N. (2009). Introduction: Media events in globalized media cultures. In N. Couldry, A.Hepp, & F. Krotz (Eds.), Media events in a global age (pp. 1–20). Routledge. https://doi.org/10.4324/9780203872604
- Hristova, S., & Howard, A. L. (2021). ‘I can’t breathe’: The biopolitics and necropolitics of breath during 2020. Mortality, 26(4), 471–486. https://doi.org/10.1080/13576275.2021.1987662
- Ichau, E., Frissen, T., & d’Haenens, L. (2019). From# selfie to# edgy. Hashtag networks and images associated with the hashtag# jews on Instagram. Telematics and Informatics, 44. https://doi.org/10.1016/j.tele.2019.101275
- Iloh, C. (2021). Do it for the culture: The case for memes in qualitative research. International Journal of Qualitative Methods, 20, 1–10. https://doi.org/10.1177/16094069211025896
- Jenkins, H., Ford, S., & Green, J. (2013). Spreadable media. New York University Press.
- Katz, Y., & Shifman, L. (2017). Making sense? The structure and meanings of digital memetic nonsense. Information, Communication & Society, 20(6), 825–842. https://doi.org/10.1080/1369118X.2017.1291702
- Kligler-Vilenchik, N., & Thorson, K. (2016). Good citizenship as a frame contest: Kony2012, memes, and critiques of the networked citizen. New Media & Society, 18(9), 1993–2011. https://doi.org/10.1177/1461444815575311
- Kumar, S. (2015). Contagious memes, viral videos and subversive parody: The grammar of contention on the Indian web. International Communication Gazette, 77(3), 232–247. https://doi.org/10.1177/1748048514568758
- Ling, C., AbuHilal, I., Blackburn, J., De Cristofaro, E., Zannettou, S., & Stringhini, G. (2021). Dissecting the meme magic: Understanding indicators of virality in image memes. Proceedings of the ACM on human-computer interaction, 5, 1–24.
- Marwick, A., & Lewis, R. (2017). Media manipulation and disinformation online. Data & Society. https://datasociety.net/pubs/oh/DataAndSociety_MediaManipulationAndDisinformationOnline.pdf
- Massanari, A. L., & Chess, S. (2018). Attack of the 50-foot social justice warrior: The discursive construction of SJW memes as the monstrous feminine. Feminist Media Studies, 18(4), 525–542. https://doi.org/10.1080/14680777.2018.1447333
- Mielczarek, N. (2020). The dead syrian refugee boy goes viral: Funerary aylan kurdi memes as tools of mourning and visual reparation in remix culture. Visual Communication, 19(4), 506–530. https://doi.org/10.1177/1470357218797366
- Milner, R. M. (2013a). Hacking the social: Internet memes, identity antagonism, and the logic of lulz. The Fibreculture Journal, 22, 62–92. http://twentytwo.fibreculturejournal.org/fcj-156-hacking-the-social-internet-memes-identity-antagonism-and-the-logic-of-lulz/
- Milner, R. M. (2013b). Pop polyvocality: Internet memes, public participation, and the occupy wall street movement. International Journal of Communication, 7(34). https://ijoc.org/index.php/ijoc/article/view/1949
- Moritz, S., Schilling, L., Hauschildt, M., Schröder, J., & Treszl, A. (2012). A randomized controlled trial of internet-based therapy in depression. Behaviour Research and Therapy, 50(7–8), 513–521. https://doi.org/10.1016/j.brat.2012.04.006
- Nelson, L. K. (2020). Computational grounded theory: A methodological framework. Sociological Methods and Research, 49(1), 3–42. https://doi.org/10.1177/0049124117729703
- NetworkX. (2020). Software for complex networks. https://networkx.org/documentation/stable/index.html
- Nissenbaum, A., & Shifman, L. (2017). Internet memes as contested cultural capital: The case of 4chan’s/b/board. New Media & Society, 19(4), 483–501. https://doi.org/10.1177/1461444815609313
- Nissenbaum, A., & Shifman, L. (2018). Meme templates as expressive repertoires in a globalizing world: A cross-linguistic study. Journal of Computer-Mediated Communication, 23(5), 294–310. https://doi.org/10.1093/jcmc/zmy016
- Olesen, T. (2018). Memetic protest and the dramatic diffusion of Alan Kurdi. Media, Culture & Society, 40(5), 656–672. https://doi.org/10.1177/0163443717729212
- Oliveira, H. G., Costa, D., & Pinto, A. M. (2016, June). One does not simply produce funny memes!–explorations on the automatic generation of internet humor. Proceedings of the seventh international conference on computational creativity.
- Onanuga, P. (2020). Transnationalizing humour on social media: A linguistic analysis of ideology, identity and didactics in Robert Mugabe Quotes memes. Digital Scholarship in the Humanities, 35(2), 399–416. https://doi.org/10.1093/llc/fqz019
- OpenCV. (2020a). Feature matching. https://docs.opencv.org/master/dc/dc3/tutorial_py_matcher.html
- OpenCV. (2020b). ORB (Oriented FAST and Rotated BRIEF). https://docs.opencv.org/3.4/d1/d89/tutorial_py_orb.html
- OpenCV. (2020c). ORB (Oriented FAST and Rotated BRIEF). https://opencv24-python-tutorials.readthedocs.io/en/latest/py_tutorials/py_feature2d/py_matcher/py_matcher.html
- Ophir, Y., Walter, D., & Marchant, E. R. (2020). A collaborative way of knowing: Bridging computational communication research and grounded theory ethnography. Journal of Communication, 70(3), 447–472. https://doi.org/10.1093/joc/jqaa013
- Peck, A., & Good, K. D. (2020). When paper goes viral: Handmade signs as vernacular materiality in digital space. International Journal of Communication, 14, 626–648. https://ijoc.org/index.php/ijoc/article/view/10965
- Priyadarshini, I., & Cotton, C. (2019). Internet memes: A novel approach to distinguish humans and bots for authentication. Proceedings of the future technologies conference, 204–222. https://doi.org/10.1007/978-3-030-32520-6_16
- Python 3.8. (2020). Multiprocessing — Process-based parallelism. https://docs.python.org/3.8/library/multiprocessing.html
- Ratkiewicz, J., Conover, M., Meiss, M., Gonçalves, B., Patil, S., Flammini, A., & Menczer, F. (2010). Detecting and tracking the spread of astroturf memes in microblog streams. arXiv preprint. https://doi.org/10.1145/1963192.1963301
- Rosebrock, A. (2018). OpenCV Text Detection (EAST text detector). pyimagesearch. https://www.pyimagesearch.com/2018/08/20/opencv-text-detection-east-text-detector/
- Ross, A. S., & Rivers, D. J. (2017). Digital cultures of political participation: Internet memes and the discursive delegitimization of the 2016 US Presidential candidates. Discourse, Context & Media, 16, 1–11. https://doi.org/10.1016/j.dcm.2017.01.001
- Rublee, E., Rabaud, V., Konolige, K., & Bradski, G. (2011, November). ORB: An efficient alternative to SIFT or SURF. International conference on computer vision, 2564–2571.
- Segev, E., Nissenbaum, A., Stolero, N., & Shifman, L. (2015). Families and networks of internet memes: The relationship between cohesiveness, uniqueness, and quiddity concreteness. Journal of Computer-Mediated Communication, 20(4), 417–433. https://doi.org/10.1111/jcc4.12120
- Seiffert-Brockmann, J., Diehl, T., & Dobusch, L. (2018). Memes as games: The evolution of a digital discourse online. New Media & Society, 20(8), 2862–2879. https://doi.org/10.1177/1461444817735334
- Sheremet, O. (2020). Intersection over union (IoU) calculation for evaluating an image segmentation model. Medium: Towards Data Science. https://towardsdatascience.com/intersection-over-union-iou-calculation-for-evaluating-an-image-segmentation-model-8b22e2e84686
- Shifman, L. (2012). An anatomy of a YouTube meme. New Media & Society, 14(2), 187–203. https://doi.org/10.1177/1461444811412160
- Shifman, L. (2014). Memes in digital culture. MIT press.
- Shubeck, K. T., & Huette, S. (2015). Predicting meme success with linguistic features in a multilayer backpropagation network. Proceedings of the 37th Annual Meeting of the Cognitive Science Society, 22-25 July 2015, Pasadena, California, 1–6. https://cogsci.mindmodeling.org/2015/papers/0376/paper0376.pdf
- Sieberth, T., Wackrow, R., & Chandler, J. H. (2014). Influence of blur on feature matching and a geometric approach for photogrammetics deblurring. International Archives of the Photogrammetry, Remote Sensing & Spatial Information Sciences, 3, 321–326. https://doi.org/10.5194/isprsarchives-XL-3-321-2014
- Sobande, F. (2019). Memes, digital remix culture and (re) mediating British politics and public life. IPPR Progressive Review, 26(2), 151–160. https://doi.org/10.1111/newe.12155
- Sun, Y., Wong, A. K. C., & Kamel, M. S. (2009). Classification of imbalanced data: A review. International Journal of Pattern Recognition and Artificial Intelligence, 23(4), 687–719. https://doi.org/10.1142/S0218001409007326
- Tyagi, D. (2019a). Introduction To Feature Detection And Matching. Medium.com. https://medium.com/data-breach/introduction-to-feature-detection-and-matching-65e27179885d
- Tyagi, D. (2019b). Introduction to ORB (Oriented FAST and Rotated BRIEF). Medium.com. https://medium.com/data-breach/introduction-to-orb-oriented-fast-and-rotated-brief-4220e8ec40cf
- Wang, L., & Wood, B. C. (2011). An epidemiological approach to model the viral propagation of memes. Applied Mathematical Modelling, 35(11), 5442–5447. https://doi.org/10.1016/j.apm.2011.04.035
- Weng, L., Menczer, F., & Ahn, Y. Y. (2014). Predicting successful memes using network and community structure. arXiv Preprints.
- Wiggins, B. E. (2020). Boogaloo and civil war 2: Memetic antagonism in expressions of covert activism. New Media & Society, 23(11), 3179–3205. https://doi.org/10.1177/1461444820945317
- Zannettou, S., Caulfield, T., Blackburn, J., De Cristofaro, E., Sirivianos, M., Stringhini, G., & Suarez-Tangil, G. (2018). On the origins of memes by means of fringe web communities. Proceedings of the internet measurement conference 2018, 188–202. https://doi.org/10.48550/arXiv.1805.12512
- Zhou, X., Yao, C., Wen, H., Wang, Y., Zhou, S., He, W., & Liang, J. (2017). East: An efficient and accurate scene text detector. Proceedings of the IEEE conference on computer vision and pattern recognition, 5551–5560.
Appendix 1
Figure A1. Mismatches between screenshots from social media platforms such as Twitter and Facebook, and mobile phone screenshots.