
ABSTRACT
This study aimed to characterize alternative food source (AFS) utilization profiles among newly registered food bank (FB) users in urban, semi-urban, and rural settings. A cross-sectional analysis was conducted on the baseline data of the Pathways Study, a cohort of newly registered FB-users in Québec (2018–2020). Participants aged between 18–63 responsible for household food acquisition (n = 990) were included. Latent class analysis was used to classify FB-users into three latent AFS utilization profiles: FB-Exclusive-users, FB-Fruit/Vegetable-Market-users, and Multiple-AFS-users. The socio-demographic factors related to AFS utilization profiles vary across settings. These differences should be considered to improve AFS access.
Introduction
Although the reduction of hunger is a key objective in the Canadian’s First Poverty Strategy,Citation1 the number of people needing food aid has increased in the last years. Between March 2018 and March 2023, the number of food bank (FB) visits rose from 1.1 to 1.9 million,Citation2 which is inextricably linked to the increase of domestic hunger. In Québec, the number of individuals living in severely food insecure households (i.e., food deprivation or reduction in the amount of food consumedCitation3) increased from 888.400 in 2017–2018 to 1.1 million in 2021.Citation4 FBs are non-for-profit organizations serving as collectors and distributors of food donations for those in need. Research on FB utilization has come on in leaps and bounds in the last two decades, shedding light on FB users’ socio-demographic characteristics and high risk of food deprivation.Citation5-13 Qualitative studies have shown that this population often has to adopt complex and dynamic food acquisition strategies, including the use of alternative food sources (AFSs) such as food sharing, growing food, local markets, or any other means to acquire food free or at low cost.Citation14 Yet, quantitative studies examining the utilization of AFSsCitation5,Citation13,Citation15 among FB users across settings are lacking. Citation16,Citation18 There is an urgent need for valid empirical information about how FB users utilize different AFSs. This information is vital to develop targeted food interventions that can optimize access to AFSs among this population. This paper aims to improve the understanding of how newly enrolled FB users in urban, semi-urban, and rural settings of Québec (Canada) use AFSs.
Most frequently available AFSs in Québec are: FBs, domestic food production (at gardening level), and fruit and vegetable markets (FV-markets). FBs vary in the number of services offered (e.g., some of them provide food donations only, while others offer both food donations and capacity-building programs),Citation5 eligibility criteria used, the number of people served, types of foods offered, as well as operating hours, distribution frequency of food hampers, and locations.Citation11,Citation19 Domestic food production is an activity performed by households that are not professional farmers but have access to the necessary resources to grow food for their own consumption.Citation20,Citation21 FV-markets are short food supply chains such as farmers' markets, community-supported agriculture, or community initiatives designed to improve access to fruit and vegetables in low-income communities.Citation22 FB users might have differential utilization of these AFSsCitation23 because they form a heterogenous population. They face different challenges and risk factors related to their position in the social structure (e.g., lack of money, prestige, power, knowledge, and beneficial social connections), which are aggravated by environmental barriers,Citation24 and translated into inequalities in education, occupation, and income.Citation25,Citation26
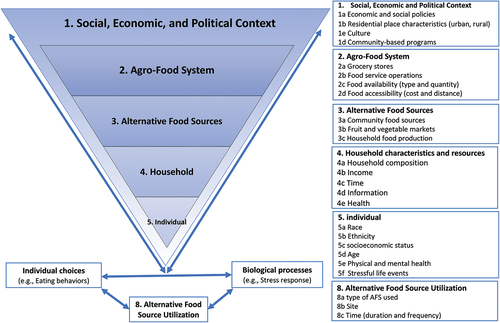
The utilization of AFSs is a dynamic and adaptative process in which several AFSs can be used simultaneously,Citation27 and the usage of one of them may decrease the likelihood of using another (and vice versa).Citation28 This process involves the type of AFS used, site and time: Type of AFS refers to the characteristics of AFSs; site refers to the geographical location of AFSs used; and time refers to the frequency within a specific period that a person uses the AFSs.Citation29 As shown in , AFS utilization may vary over time according to seasons,Citation30 the social, economic, and political context of the residential place,Citation18,Citation31 as well as the characteristics of the local agro-food system, the local AFSs, and the resources and capabilities of households and individuals.Citation31,Citation32 For instance, domestic food production and FV-markets might be more frequently used or adopted by FB users with additional resources (e.g., income or education).Citation18,Citation33 All these factors affect the interactions between individuals’ choices, biological processesCitation34 and the utilization of AFSs.R
Figure 1. Inspired by bird & rieker’s conceptual model of constrained ChoiceCitation34 and Campbell’ s framework for US household food security.Citation32
However, much research on AFS utilization among FB users has focused on FB utilization, assessing FB as a dichotomous variable of utilization/non-utilization,Citation21,Citation35 number of visits to the FBs,Citation13,Citation18,Citation28,Citation36–41 or duration of utilization,Citation8,Citation9 separately. In addition, the limited quantitative studies examining the relationship between the utilization of AFSs and food insecurity and health among this population only have assessed FB utilization,Citation8,Citation42–46 neglecting the fact that some FB users might use more than one AFS simultaneously. Without a complete picture of AFS utilizationCitation27,Citation47–50 among FB users, it is difficult to understand the factors that contribute to improving access to these resources in different settings (urban, semi-urban, and rural).Citation16,Citation17 To bridge this gap, this study has two main objectives: 1) to identify and compare profiles of AFS utilization among newly registered food bank users in urban, semi-urban, and rural settings of Québec, Canada; and 2) to quantify the associations between socio-economic factors and AFS utilization profiles.
Materials and methods
Study context and population
This analysis uses the baseline data from the Pathways Study, a cohort 1001 of newly registered FB users in Québec. The aim of the Pathways Study is to estimate the long-term effects of food aid programs on food insecurity, dietary intake, food competencies, social integration, civil participation, as well as physical and mental health. It was carried out in four regions of Québec (Montréal, Lanaudière, Mauricie-Centre-du-Québec, Estrie) selected because all community organizations could be reached within a four-hour drive, all have urban, semi-urban, and rural settings, and they expressed a willingness to participate. One hundred and six community organizations (32 in rural, 35 in semi-urban, and 50 in urban areas) that offered food donations, on a regular basis, to everyone in need were included in the study.Citation51,Citation52
The Pathways Study’s target population was newly registered FB users (i.e., individuals who used food donation for the first time during the six months prior to recruitment) between 18 and 63 years of age, who were able to communicate in French or in English. Individuals were excluded if they lived with a person who was already enrolled in the study, or if they used FBs for more than six months prior to recruitment (i.e., non-incident cases). Individuals older than 63 years were excluded because they would be eligible for guaranteed income supplements over the course of the 2-year follow-up, which is correlated with a significant reduction in food insecurity in Canada.Citation53 People experiencing homelessness were excluded because special programs apply to this population and follow-up cannot be ensured.Citation51
Study design and sampling
This is a cross-sectional analysis of the Pathways Study baseline data. The sample of this study is composed by 990 newly registered FB users, out of 1001 participants of the Pathways Study, who reported to be involved in getting food for their households at the time of the survey. The full description of sampling and recruitment strategies has been described in detail elsewhere.Citation51 Briefly, newly registered FB users were recruited via community organizations’ staff and the research team. The interviewers used a screening questionnaire to assess eligibility. The research team implemented 18 strategies (e.g., fliers, referrals, financial compensation, social networks) aimed at maximizing study credibility, ensuring consistency of the follow-up plan, and maintaining regular communication with participants. All participants provided informed written consent after receiving detailed explanation about the aims and procedures of the study.
Baseline data of the Pathways Study were collected through a 45-minutes computer-assisted face-to-face structured interview with a trained interviewer between September 2018 and January 2020. The interview included questions about socio-demographic characteristics, food shopping behaviors, food bank usage, food security status, eating behaviors, civic participation, and perceived health.Citation51
Measures
Alternative food sources utilization
Five indicators related to three dimensions of AFS utilization (type, time, and site) were assessed. Three types of AFSs used were measured using three items: 1. Type of FB used was created based on the goal of the community organization from which the participant was recruited. Given that some studies have shown that the quality and quantity of food parcels vary according to the complexity of organizations,Citation5,Citation54,Citation55 FBs were classified into Capacity-Building Programs (CBP-FBs), those aimed at food distribution and food capacity building (e.g., community kitchens, cooking classes), and Food donations (FD-FBs), those aimed solely at food distribution (e.g., food donations, community meals); 2. Fruit and vegetable market (FV-market) usage during the summer was assessed by asking participants whether they use FV-markets; 3. Domestic food production during the summer was assessed by asking participants whether they grow their own food during the summer. One question was used to measure the time dimension: FB usage frequency refers to the number of times per month the participant visited the FB during the last six months. To prevent low cell counts, this variable was converted into percentiles (four or five times per month, two or three times per month, once or less per month). Due to data availability issues, travel time to the most used grocery store was used as a proxy for the distance traveled to AFSs. It was assessed by asking responders “how long it takes to get to their most used food store from their homes by car?” This variable was dichotomized: 0–5 minutes vs. six or more minutes to avoid issues with low cell counts, given that half of the participants traveled five minutes or less. All response options for the recoded variables can be found in the supplementary file (Appendix A).
Setting
The settings were determined by the location of the community organization where participants were recruited from. The full description of this variable has been described in detail elsewhere.Citation52 Briefly, Urban settings are characterized by higher population and building density and more mixed land uses. Semi-urban settings are secondary areas located around urban settings that have relatively dense built environments and mixed land uses. Rural settings are characterized by low population density and a lack of diversity in land use.
Covariates
Household and individual factors that have been identified as important FB utilization covariates including sex, household composition, household educational level, annual household income, household food security, and mode of transportation most used by respondent to access a food store. These variables were assessed by questions from the Canadian Community Health Survey and Canada census.Citation56 Household composition was grouped into three categories: single-parent home, couples with/without children, and singles (individuals living alone or with others). Total annual household income from all sources before taxes in the previous year was reported by respondents. Given that the income level of half of participants was less than CAN$15,000, this variable was dichotomized (CAN$14,999 or less, and CAN$15,000 or more). Household educational level was determined by self-reported highest educational level achieved by the respondents or their partner. Responses were grouped into two categories: Secondary studies (high school) or less, and post-secondary studies. The mode of transportation was determined by asking the respondents, “how do you usually get to your usual grocery store?” This variable was dichotomized: use its own car vs. use any other form of transportation. Household food security was assessed using 18-item of Household Food Security Survey Module (HFSSM) of the Canadian Community Health Survey (CCHS). The HFSSM is a tool that measures the severity of HFI over the past 12 months based on 10-item adult food security scale and 8-item child food security scale. A score of zero or one indicates HFS. Scores between two and four for children or between two and five for adults denote moderate HFI, and scores above four for children or above five for adults indicates severe HFI.Citation57 This variable was dichotomized into severe food insecurity and at risk of severe food insecurity. To prevent potential issues with low cell counts, we aggregated the categories of all covariates, except for sex. All response options for the recoded variables can be found in the supplementary file (Appendix A).
Statistical analysis
We performed Phi-Cramer’s test to find differences in socio-economic characteristics and AFS utilization variables across settings (urban, semi-urban, and rural). We choose to use latent class analysis (LCA) to take into account that FB users form a heterogenous population in which some groups may use several AFSs simultaneously at different sites and times. To fulfill objective 1, which is to identify and compare profiles of AFS utilization across settings, we followed two steps that have been described in the literature to assess latent structure across subpopulations.Citation58,Citation59
In the first step, we identified the number of AFS utilization profiles for each setting (urban semi-urban and rural) by applying LCA to the five indicators of AFS utilization: type of FB used, usage frequency, travel time to the most used grocery store, as well as domestic food production and FV – market usage during the summer. A series of five LCA models were defined for each setting, specifying latent class counts from one to five sequentially. The initial number of random start values was increased to reach the best log-likelihood replication (convergence) to avoid local maxima. The Bayesian information criteria (BIC), or sample-size adjusted BIC (a-BIC) were used to compare models to determine the best-fitting and parsimonious model (see Appendix B, supplementary file). Bootstrap likelihood ratio test (BLRT) and Vuong-Lo-Mendell-Rubin likelihood ratio test (LMR) were used to examine the significant improvement of a k-classes model over a k-1 class model. A significant p value indicates that a k-1 class model should be rejected.Citation60 The entropy test was calculated to evaluate the precision with which participants were classified into classes. Entropy values above 0.7 were considered an indication of the quality of individuals’ classification in their most likely class.Citation61 The selection of the model was based on four criteria: lowest values of BIC/a-BIC, quality (i.e., entropy tests) and parsimony of the model, the number of participants in each class (>5),Citation58 and class interpretability (i.e., logical sense of latent classes within models and differences between each other).
In the second step, we performed multigroup LCA models to the entire sample using the variable setting as the grouping variable. To examine whether the response probabilities were the same in each setting (measurement equivalence),Citation58 we fitted three types of multigroup LCA models: unconstrained, semi-constrained, and full constrained. In the unconstrained multigroup LCA models, the parameters of the models were not restricted across settings. In the semi-constrained multigroup LCA models, class sizes were constrained to be equal across settings to examine whether the response probabilities were the same in all setting. In the full constrained multigroup LCA models, class sizes and conditional response probabilities were fixed to be equal across settings to assess whether these parameters were the same across settings (see Appendix C, supplementary file). We increased the number of classes in all multigroup LCA models from one to four consequently and compared them using BIC, or a-BIC indices. If the unconstrained model fit the data better than the semi-constrained and full constrained models, it was an indication of differences of AFS utilization profiles between settings. The conditional class probabilities of class membership provided by LCA and multigroup LCA express the likelihood of participants belonging to an AFS utilization profile (see Appendix D, supplementary file).
Lastly, to address objective 2, which involves quantifying the associations between socio-demographic characteristics and AFS utilization profiles, multinomial logistic regression models with robust standard errors were used to estimate adjusted odds ratios (OR) and 95% confidence intervals (95%CI) to account for FB users’ distribution in community organizations. Only annual household income and mode of transportation variables presented missing data (3.1% and 0.4%, respectively). To preserve sample size, we used multiple imputation by chained equations (MICE) (100 sets) to handle missing values on covariates before fitting the multinomial logistic regression analyses.Citation62 Multigroup LCA were conducted using maximum likelihood estimation in Mplus version 8.4.Citation63 Descriptive analyses and multinomial logistic regression analyses with robust standard errors were performed in SPSS version 28 (IBM, 2021).
Results
Descriptive and overall setting level differences
The full description of the Pathways Study sample (n = 1001) and the socio-demographic differences among participants in urban, rural, and semi-urban settings have been extensively detailed elsewhere.Citation52 Descriptive data for this study sample (n = 990) are available in the supplementary file (Appendix E). Respectively, 56.9%, 18.3%, and 24.8% of the participants lived in urban, rural, and semi-urban settings. In rural settings, the majority of participants traveled six or more minutes to reach their most frequently used grocery store (64.2%). Furthermore, over 40% of them visited CBP-FBs once a month or less and grew their own food during the last summer. In contrast, in urban settings, half of participants spent five or fewer minutes traveling to their primary grocery store. However, only 38.1% of them visited FBs four or five times per month, and 26.4% engaged in growing their own food during the same season.
Profiles of AFS utilization
In the first step, the three-class model was selected because it had the lowest a-BIC and the highest entropy values in all settings (urban: 0.74; semi-urban: 0.68 rural: 0.86) suggesting that it provided the best parsimonious fit of the observed data. The BLRT and LRT of the model with four classes were not significant at p > .5 indicating that adding a class to the three-class model does not improve this model. In addition, the classes in the three-class model were distinct from each other and presented a logical sense (see Appendix B, supplementary file). In the second step, the multigroup LCA, the unconstrained three-class model presented the lowest a-BIC values (see Appendix C, supplementary file). It also showed the same latent class structures and class sizes of the three-class models identified in the first step, which suggests that the structure of the latent classes varies across settings.
shows the participants’ likelihood of belonging to AFS utilization profiles. Three profiles were identified among FB users that differ in type and number of food sources used, FB usage frequency and travel time to the most frequently used grocery store across settings: Profile 1 (31,1%), labeled “FB-Exclusive users,” were composed of participants who only used FBs. Profile 2 is the largest group (41,9%), labeled “FB and FV-Market users”, represents participants who used FBs and frequented FV-Markets during the summer. Profile 3 (27%) labeled “Multiple-AFS users”, represents participants who used FBs, engaged in growing their own food, and frequented FV-markets during the summer. The response probabilities for the three-class model in each setting are presented in terms of conditional class probabilities and robust standard errors in the supplementary file (Appendix D).
Figure 2. Participants’ likelihood of membership in each profile of alternative food source utilization by setting.
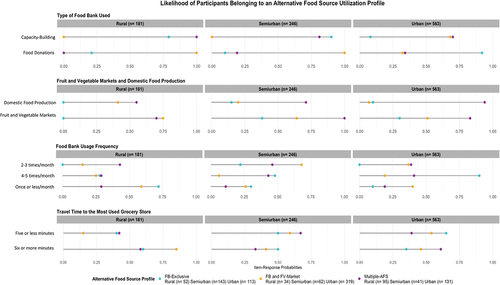
In rural settings, all AFS utilization profiles were characterized by participants who travel six or more minutes to their most frequented grocery store (). Among them, 52% were Multiple-AFS users with a high probability of using CBP-FBs two or three times per month (0.43), and 29% were FB-Exclusive users with a high probability of using the same type of FBs (0.79), but once or less per month (0.72). The remaining 19% were FB and FV-Market users with a high probability of visiting FD-FBs once or less per month (0.59). In contrast, in semi-urban and urban settings, the majority of AFS utilization profiles were characterized by being FB users who traveled five or fewer minutes to their primary grocery store (), except for Multiple-AFS users in urban settings.
Within urban settings, 23% were Multiple-AFS users with a high probability of visiting CBP-FBs (0.68) two or five times per month; 57% were FB and FV-Market users with a high probability of using the same type of FBs (0.68), but three or fewer times per month. Additionally, 24% of them were FB-Exclusive users with a high probability of visiting FD-FBs (0.92) four or five times per month (0.92). In contrast, within semi-urban settings, the majority of participants were FB-Exclusive users (58%) with a high probability of visiting CBP-FBs (0.90) four or five times per month (0.48); 25% were FB and FV-Market users with a high probability of visiting two or three times per month (0.68); and 17% were Multiple-AFS users with high probability of visiting CBP-FBs (0.81) two or more times per month ().
The socio-demographic characteristics of AFS utilization profiles by setting are presented in . There were statistically significant differences among profiles of AFS utilization across settings. While in rural and semi-urban settings, the majority of FB-Exclusive users were single women; in urban settings a noteworthy proportion were single men. In urban and semi-urban settings, a high proportion of FV-Market users held post-secondary studies and resided in households at risk of severe food insecurity. In contrast, in rural settings, one third of FV-Market users had attained a secondary level education or less and lived in households experiencing severe food insecurity. Across all settings, Multiple-AFS users were predominantly women with post-secondary education, residing in households at risk of severe food insecurity and using their own car. Notably, in semi-urban settings, this profile presented the highest proportion of participants with an annual household income equal to or greater than CAN$15.000 (65.9%).
Table 1. Socio-demographic characteristics of 990 new food bank users by profiles of alternative food source utilization in urban, semi-urban, and rural settings of Québec.
As shown in , in rural settings, households comprising a couple (with or without children) were more likely to be Multiple-AFS users (OR = 5.96; 95%IC = 2.14–24.29) compared to single households. In semi-urban settings, households with an annual income under CAN$15,000 were more likely to be FB and FV-Market users (OR = 2.40; 95%IC = 1.29–5.25) and less likely to be Multiple-AFS users (OR = 0.39; 95%IC = 0.18–0.79) than those with an income equal to or greater than CAN$15,000. In urban settings, households with an annual income under CAN$15,000 were less likely to be Multiple-AFS users (OR = 0.33; 95%IC = 0.17–0.62) compared to those with an income equal to or greater than CAN$15,000. Households with lower educational attainment were less likely to be Multiple-AFS users (OR = 0.46%95IC = 0.25–0.75) or FB and FV-Market users (OR = 0.64; IC = 0.41–0.98) compared to those with post-secondary studies. In these settings, males were less likely to be FB and FV-Market users (OR = 0.59; IC = 0.36–0.92) or Multiple-AFS users (OR = 0.17; 95%IC = 0.08–0.28) than women. Notably, household food security and transport mode were not correlated with profiles of AFS utilization.
Table 2. Differences in socio-demographic characteristics between alternative food source utilization profile of 990 new food bank users by setting in Québec.
Discussion
This study sought to identify AFS utilization profiles and factors associated with them among newly registered FB users across settings. Our findings confirm prior research showing that FB users are a heterogeneous population who implement several strategies, including the use of different AFSs to feed their households.Citation8,Citation11,Citation18,Citation64–66 We identified three significantly different profiles of AFS utilization (FB-exclusive users, FB and FV-market users, and Multiple-AFS users) with variations in FBs usage frequency and travel time between and within settings. The socio-economic factors related to these profiles were different across settings. In urban settings, households with a lower annual income, those less educated, and male users were less likely to use multiple AFSs (Multiple-AFS users). In semi-urban settings, households with a lower annual income were also less likely to use multiple AFSs. In contrast, in rural settings, only households comprising a couple were more likely to utilize multiple AFSs. These findings underscore the fact that those new FB users, who already have more resources and capabilities, tend to use more multiple AFSs. Thus, there are differences in the utilization of AFSs among new FB users that result from a combination of factors related to setting (social, economic, and political context) and household characteristics (background, needs, resources, and capacities). All these factors should be considered when attempting to improve access to AFSs among this population.
The results in urban and semi-urban settings extend the idea that FB users use FBs in different ways depending on their income, time, and coping skillsCitation5,Citation18,Citation67 by showing that there is also differential utilization of other AFSs. To our knowledge, there is not any previous quantitative study analyzing the simultaneous use of various AFS among new FB users. However, our findings are similar to those from studies carried out among low-income communities in the US.Citation21,Citation27 For instance, Ma et al.. (2018), identified three acquisition and shopping patterns that were associated with socio-demographic characteristics.Citation27 Crespo-Bellido et al., found that participants who used AFSs were more likely to be non-Hispanic White, female, born in the US, and own a home than participants who did not use AFSs.Citation21 Nevertheless, they included transportation mode as a component of food shopping patterns, did not include FB usage frequency in their analyses, and did not account for the confounding effect of income.
Although transportation mode has been linked to food access among low-income populations,Citation50,Citation68,Citation69 in our sample it was not correlated with increased odds of Multiple-AFS or FB and FV-Market profiles. In urban and semi-urban settings, this could be explained by the fact that a high proportion of FB-exclusive and FB and FV-Market users reported walking or using other modes of transportation to do their groceries which is in line with previous studies.Citation64,Citation70 In rural settings, there is not a clear explanation for this result, but it may reflect the fact that in these settings most participants used their own car to do their groceries.
In urban settings, our findings on the absence of correlation between household composition and profiles of AFS utilization confirm earlier studies indicating that household structure is not associated with FB usage.Citation28,Citation36,Citation70 But in rural settings, we observed that living in a household composed of a couple was the only variable associated with higher odds of Multiple-AFS users, which is different from the findings of Daponte et al. in 1996, who found that car ownership was the only household socio-economic characteristic significantly correlated with food pantry utilization among low-income people in Allegheny County, Pennsylvania,Citation69 These differences could be explained by the context differences between countries or because our sample is relatively small in these settings.
A key strength of this study is the expansion of the understanding of AFS utilization among a sample of new FB users in rural, semi-urban, and urban settings. To the best of our knowledge, this is the first study to adopt a multidimensional conceptualization of AFS utilization including the type of AFSs used, the FB usage frequency and travel time. It is also the first study to use LCA to capture variability of possible profiles of AFS utilization among this population across settings in Canada. Thus, our results add to the limited literature about AFS utilization among FB users, showing the importance for future research to use approaches that consider the multidimensional nature of AFS utilization when evaluating the relationship between these sources and food insecurity and health among this population.Citation71,Citation72 It also highlights the need to understand the context and the characteristics of FB users, as well as their needs, resources, and capacities to optimize their access to AFSs.
Although we were cautious to avoid the oversimplification of the reality, as well as practical and interpretational issues with LCA, this study has some limitations that should be addressed in future research. First, the results of this study are limited to newly enrolled FB users between 18–63 years old living in four regions of Quebec, thus they cannot be generalized to long-term FB users, or other regions of Canada because the social and physical structure of each region is different. Second, we did not assess the availability and accessibility of AFSs that may influence the utilization of these resources.
Third, even if we evaluated the existence of differences between the identified profiles of AFS utilization across settings by testing the measure of equivalence,Citation61 this study should be replicated to validate these profiles in other places. Fourth, self-reported data may cause response bias. Fifth, we did not collect information about the frequency of using summer FV-market and self-grown food produce to have a complete picture of the utilization of these sources. Sixth, although travel time is a good proxy of distance,Citation73 and it is highly probable that the distance traveled to the most frequently visited grocery store is correlated with the distance traveled to the AFSs used; however, data on the travel time to AFSs were unavailable for testing. Future studies should measure the distance FB users’ place of residence and at least one of the AFS to be more precise. Seventh, given the observational nature of this study, we were unable to control the use of multiple food banks at the same time. Eight, we did not ask for any information about other AFSs, such as the acquisition of food through friends or family which could be important food sources for this population.Citation44,Citation74 Finally, in addition to the unequal prevalence of profiles across settings, the small sample size affected the precision our estimates, resulting in wider confidence intervals, especially the identification of profiles with low prevalence. However, we carefully addressed the potential data sparseness problem at every step of the analyses (i.e., limiting the number of items, reducing the number of categories, selecting the most parsimonious LCA model that provides adequate fit, and using multinomial logistic regression models with robust standard errors) to improve the precision, ensuring robustness of our estimates and took all precautions to avoid other biases.
Conclusion
Our findings offer valuable insight into the utilization of AFSs among FB users across urban, semi-urban, and rural settings, indicating the existence of distinct subgroups within this population that use AFSs in different ways. Furthermore, they suggest that certain subgroups may capitalize more on AFSs. These findings underscore the vital need for more research and consideration of factors related to differential utilization of AFSs among FB users to have a more comprehensive understanding of social and contextual elements (i.e., social cohesion) enabling FB users’ access to AFS. Moreover, further studies are needed to understand if and how AFS utilization profiles vary in the long-term and examine other important covariates, such as health status, type of housing, social support, and disability status that we were unable to assess due to our small sample size. This knowledge is of value, not only as an aid to stakeholders in delineating a targeted population but lends considerable insight into the needs planning process of FB users to improve their access to food. Although, our results are insufficient to inform intervention design, they provide initial paths for researchers, stakeholders, and policy-makers reflection on interventions to improve access to AFSs among new FB users considering the complexity of AFS utilization among this population.
Supplemental Material
Download MS Word (45.3 KB)Acknowledgements
The authors would like to thank all participants and community organizations for their contribution to the study.
Disclosure Statement
No potential conflict of interest was reported by the author(s).
Supplementary Data
Supplemental data for this article can be accessed online at https://doi.org/10.1080/19320248.2024.2355926.
Additional information
Funding
References
- Employment and Social Development Canada. Opportunity for all - Canada’s first poverty reduction strategy. Government of Canada; 2018. chrome-extension://efaidnbmnnnibpcajpcglclefindmkaj/https://www.canada.ca/content/dam/canada/employment-social-development/programs/poverty-reduction/reports/poverty-reduction-strategy-report-EN.pdf.
- Food Banks Canada. HungerCount 2023. Food Banks Canada. https://hungercount.foodbankscanada.ca/. 2023. Accessed January 4, 2024.
- Tarasuk V. Discussion paper on household and individual food insecurity. http://www.hc-sc.gc.ca/fn-an/alt_formats/hpfb-dgpsa/pdf/nutrition/food_sec_entire-sec_aliments_entier-eng.pdf. 2001. Accessed January 4, 2024.
- Tarasuk V, Li T, Fafard St-Germain A Household food insecurity in Canada, 2021. Research to Identify Policy Options to Reduce Food Insecurity (PROOF). 2022. https://proof.utoronto.ca/wp-content/uploads/2022/08/Household-Food-Insecurity-in-Canada-2021-PROOF.pdf. Accessed Janvier 15, 2023.
- Roncarolo F, Adam C, Bisset S, Potvin L. Traditional and alternative community food security interventions in Montreal, Quebec: different practices, different people. J Community Health. 2015 Apr;40(2):199–207. doi:10.1007/s10900-014-9917-8.
- Loopstra R, Tarasuk V. Food bank usage is a poor indicator of food insecurity: insights from Canada. Soc Policy Soc. 2015;14(3):443–455. doi:10.1017/s1474746415000184.
- Tarasuk V, St-Germain A-A F, Loopstra R. The relationship between food banks and food insecurity: Insights from Canada. VOLUNTAS Int J Volunt Nonprofit Org. 2019;31(5):1–12. doi:10.1007/s11266-019-00092-w.
- Rizvi A, Wasfi R, Enns A, Kristjansson E. The impact of novel and traditional food bank approaches on food insecurity: a longitudinal study in Ottawa, Canada. BMC Public Health. Apr 22 2021;21(1):771. doi:10.1186/s12889-021-10841-6.
- Black JL, Seto D. Examining Patterns of food bank use over twenty-five years in Vancouver, Canada. Voluntas. 2020;31(5):853–869. doi:10.1007/s11266-018-0039-2.
- Wainwright D, Buckingham A, Wainwright E. Why do people use food banks? A qualitative study of food bank users in an English city. Volunt Sect Rev. 2018;9(3):311–329. doi:10.1332/204080518x15428930047072.
- Thériault L, Yadlowski L. Revisiting the food bank issues in Canada. CSWR-RCSS. 2000;17:205–223.
- Garthwaite KA, Collins PJ, Bambra C. Food for thought: an ethnographic study of negotiating ill health and food insecurity in a UK foodbank. Soc Sci Med. 2015May;132:38–44. doi:10.1016/j.socscimed.2015.03.019.
- Holmes E, Fowokan A, Seto D, Lear S, Black J. Examining food insecurity among food bank members in greater vancouver. J Hunger Environ Nutr. 2018;14(1–2):141–154. doi:10.1080/19320248.2018.1465001.
- Campbell C, Desjardins EA. Model and research approach for studying the management of limited food resources by low income families. J Nutr Educ. 1989;1(4):162–171. doi:10.1016/S0022-3182(89)80052-4.
- Thatcher E, Johnson C, Zenk SN, Kulbok P. Retail food store access in rural Appalachia: A mixed methods study. Public Health Nurs. 2017 May–Jun;34(3):245–255. doi:10.1111/phn.12302.
- Middleton G, Mehta K, McNaughton D, Booth S. The experiences and perceptions of food banks amongst users in high-income countries: An international scoping review. Appetite. Jan 1 2018;120:698–708. doi:10.1016/j.appet.2017.10.029.
- Piaskoski A, Reilly K, Gilliland J. A conceptual model of rural household food insecurity: a qualitative systematic review and content analysis. Fam Community Health. 2020 Oct/Dec;43(4):296–312. doi:10.1097/FCH.0000000000000273.
- Garasky S, Morton L, Greder K. The food environment and food insecurity: Perceptions of rural, suburban, and urban food pantry clients in Iowa. Fam Econ Nutr Rev. 2004;16:41–48.
- Tarasuk V, Martin C, Alessio C, Dachner N, Loopstra R. Food banks, welfare, and food insecurity in Canada. Br Food J. 2014;116(9):1405–1417. doi:10.1108/bfj-02-2014-0077.
- Vávra J, Daněk P, Jehlička P. What is the contribution of food self-provisioning towards environmental sustainability? A case study of active gardeners. J Clean Prod. 2018;185:1015–1023. doi:10.1016/j.jclepro.2018.02.261.
- Crespo-Bellido M, Grutzmacher S, Smit E. Food security and alternative food acquisition among US low-income households: results from the national food acquisition and purchasing survey (FoodAPS). Public Health Nutr. 2021 Apr;24(5):787–795. doi:10.1017/S1368980020003791.
- Wegener J, Hanning RM. Concepts and measures of “Alternative” retail food outlets: Considerations for facilitating access to healthy, local food. J Hunger Environ Nutr. 2010;5(2):158–173. doi:10.1080/19320248.2010.487023.
- Jonason A. The Promises and Pitfalls of Alternative Food Institutions: Impacts on and Barriers to Engagement with Low-Income Persons in the United States and Canada. Bingley, UK: Advances in Medical Sociology; 2017.
- Iezzoni LI. Eliminating health and health care disparities among the growing population of people with disabilities. Health Aff (Millwood). 2011 Oct;30(10):1947–1954. doi:10.1377/hlthaff.2011.0613.
- Phelan J, Link B. Controlling disease and creating disparities: a fundamental cause perspective. J Gerontol B Psychol Sci Soc Sci. 2005;1(60):S27–33. doi:10.1093/geronb/60.Special_Issue_2.S27.
- Masters RK, Link BG, Phelan JC. Trends in education gradients of ‘preventable’ mortality: a test of fundamental cause theory. Soc Sci Med. 2015 Feb;127:19–28. doi:10.1016/j.socscimed.2014.10.023.
- Ma XN, Sharpe PA, Bell BA, Liu JH, White K, Liese AD. Food acquisition and shopping patterns among residents of low-income and low-access communities in south carolina. J Acad Nutr Diet. 2018 Oct;118(10):1844–1854. doi:10.1016/j.jand.2018.04.017.
- Bhattarai G, Duffy P, Raymond J. Use of food pantries and food stamps in low‐income households in the United States. J Consum Aff. 2005;39(2):276–298. doi:10.1111/j.1745-6606.2005.00015.x.
- Aday L, Shortell S. Indicators and predictors of health services utilization. In Williams S. J., Torrens, P. R. ed. Introduction to Health Services 4th, 47–70, New York, USA: Delmar; 1987.
- Mosley Jt L, Tiehen L. The food safety net after welfare reform: Use of private and public food assistance in the Kansas City Metropolitan Area. Soc Serv Rev. 2004;78(2):267–283. doi:10.1086/382769.
- Larson NI, Story MT, Nelson MC. Neighborhood environments: disparities in access to healthy foods in the U.S. Am J Prev Med. 2009 Jan;36(1):74–81. doi:10.1016/j.amepre.2008.09.025.
- Campbell C. Food insecurity: a nutritional outcome or a predictor variable? J Nutr. 1991;121(3):408–415. doi:10.1093/jn/121.3.408.
- Lorenc T, Oliver K. Adverse effects of public health interventions: a conceptual framework. J Epidemiol Community Health. 2014 Mar;68(3):288–290. doi:10.1136/jech-2013-203118.
- Bird C, Rieker P. Gender and barriers to health. constrained choice in everyday decisions. In: Bird C, and Rieker P, eds. Gender and Health the Effects of Constrained Choices and Social Policies, 54–74, Cambridge, UK: Cambridge University Press; 2008.
- Sharpe PA, Liese AD, Bell BA, Wilcox S, Hutto BE, Stucker J. Household food security and use of community food sources and food assistance programs among food shoppers in neighborhoods of low income and low food access. J Hunger Environ Nutr. 2018;13(4):482–496. doi:10.1080/19320248.2017.1364188.
- Paynter S, Berner M, Anderson E. When even the’dollar value meal’costs too much: Food insecurity and long term dependence on food pantry assistance. Public Administration Quarterly. 2011;1:26–58.
- Bartfeld J.Single Mothers, Emergency food assistance, and food stamps in the welfare reform age. J Consum Aff. 2003;37(2):283–303. doi:10.1111/j.1745-6606.2003.tb00454.x.
- Berner M, Ozer T, Paynter S. A portrait of hunger, the social safety net, and the working poor. Policy Stud J. 2008;36(3):403–420. doi:10.1111/j.1541-0072.2008.00274.x.
- Ford J, Lardeau MP, Vanderbilt W. The characteristics and experience of community food program users in arctic Canada: a case study from Iqaluit, Nunavut. BMC Public Health. 2012;12(464). doi:10.1186/1471-2458-12-464.
- Robaina KA, Martin KS. Food insecurity, poor diet quality, and obesity among food pantry participants in Hartford, CT. J Nutr Educ Behav. 2013 Mar;45(2):159–164. doi:10.1016/j.jneb.2012.07.001.
- Prayogo E, Chater A, Chapman S, et al. Who uses foodbanks and why? Exploring the impact of financial strain and adverse life events on food insecurity. J Public Health (Oxf). Dec 1 2018;40(4):676–683. doi:10.1093/pubmed/fdx133.
- Roncarolo F, Bisset S, Potvin L, Georgantzis N. Short-term effects of traditional and alternative community interventions to address food insecurity. PLOS ONE. 2016;11(3):e0150250. doi:10.1371/journal.pone.0150250.
- Depa J, Hilzendegen C, Tinnemann P, Stroebele-Benschop N. An explorative cross-sectional study examining self-reported health and nutritional status of disadvantaged people using food banks in Germany. Int J Equity Health. Nov 24 2015;14(1):141. doi:10.1186/s12939-015-0276-6.
- Kaiser ML, Hermsen J. Food acquisition strategies, food security, and health status among families with children using food pantries. Families Soc J Contemp Soc Serv. 2018;96(2):83–90. doi:10.1606/1044-3894.2015.96.16.
- Loh S, Knight A, Loopstra R. Working-age adults using food banks in England have significantly poorer health and higher rates of mental health conditions than adults in the general population: A cross-sectional quantitative study. Health Soc Care Community. November 19, 2020;29(5):1594–1605. doi:10.1111/hsc.13226.
- Cheyne K, Smith M, Felter EM, et al. Food bank-based diabetes prevention intervention to address food security, dietary intake, and physical activity in a food-insecure cohort at high risk for diabetes. Prev Chronic Dis. Jan 9 2020;17:E04. 10.5888/pcd17.190210.
- Kicinski L. Characteristics of short and long-term food pantry users. Michigan Sociol Rev. 2012;26:58–74.
- Jacknowitz A, Amirkhanyan A, Crumbaugh A, Hatch M. Exploring the challenges and coping strategies in households relying on SNAP and food pantries. J Hunger Environ Nutr. 2019;14(1–2):281–295. doi:10.1080/19320248.2018.1555073.
- Wood DK, Shultz JA, Edlefsen M, Butkus SN. Food coping strategies used by food pantry clients at different levels of household food security status. J Hunger Environ Nutr. 2007;1(3):45–68. doi:10.1300/J477v01n03_04.
- Grier-Welch A, Marquis J, Spence M, Kavanagh K, Anderson Steeves ET. Food acquisition behaviors and perceptions of food pantry use among food pantry clients in rural appalachia. Ecol Food Nutr. Jul 20 2020;60(1):1–20. doi:10.1080/03670244.2020.1793138.
- Roncarolo F, Perez E, Mercille G, et al. Engaging with community organizations to recruit and retain vulnerable adults: The pathways study. SSM-Population Health. 2022;18:101088. doi:10.1016/j.ssmph.2022.101088.
- Roncarolo F, Mercille G, Riva M, et al. The pathways study: a cohort study of new food-aid users in rural, semi urban, and urban areas of Quebec, Canada. BMC Public Health. Aug 24 2023;23(1):1607. doi:10.1186/s12889-023-16393-1.
- McIntyre L, Dutton DJ, Kwok C, Emery JCH. Reduction of food insecurity among low-income Canadian seniors as a likely impact of a guaranteed annual income. Can Public Policy. 2016;42(3):274–286. doi:10.3138/cpp.2015-069.
- Ticala R. Efficacité organisationnelle d’organismes communautaires en sécurité alimentaire situés en milieux ruraux, semi-urbains et urbains au Québec. Montreal, Canada: Université de Montréal; 2020.
- Tarasuk V, Dachner N, Hamelin A, et al. A survey of food bank operations in five Canadian cities. BMC Public Health. 2014;14(1):1–11. doi:10.1186/1471-2458-14-1234.
- Statistics Canada. Canadian Community Health Survey (CCHS). https://www23.statcan.gc.ca/imdb/p2SV.pl?Function=getSurvey&Id=1314175. January 20, 2022. Accessed January 20.
- Santé Canada. 2007. Enquête sur la santé dans les collectivités canadiennes, cycle 2.2, Nutrition (2004) : Sécurité alimentaire liée au revenu dans les ménages canadiens. Ottawa, Canada: Santé Canada.
- Eid M, Langeheine R, Diener E. Comparing typological structures across cultures by multigroup latent class analysis. J Cross Cult Psychol. 2016;34(2):195–210. doi:10.1177/0022022102250427.
- Kankaraš M, Moors G, Vermunt JK. Testing for measurement invariance with latent class analysis. In Cross-Cultural Analysis, edited by Second Davidov, E., Schmidt, P., Billiet, J., Meuleman, B. New York, USA: Routledge; 2018: 393–419.
- Nylund K, Asparouhov T, Muthén B. Deciding on the number of classes in latent class analysis and growth mixture modeling: A Monte Carlo simulation study. Struct Equ Modeling. 2007;23(4):535–569. doi:10.1080/10705510701575396.
- Geiser C. Latent class analysis. In: Geiser C, ed. Data Analysis with Mplus. New York, NY: Guilford; 2013: 232–268.
- Bartlett J, Seaman S, White I, Carpenter J. Multiple imputation of covariates by fully conditional specification: accommodating the substantive model. Stat Methods Med Res. 2015;24(4):462–487. doi:10.1177/0962280214521348.
- Muthén LK, Muthén BO, Muthén LK, and Muthén BO, eds. Mplus User’s Guide. Editioned. Los Angeles, CA: Muthén & Muthén; 2017.
- Pérez E, Roncarolo F, Potvin L. Associations between the local food environment and the severity of food insecurity among new families using community food security interventions in Montreal. Can J Public Health. Apr 20 2017;108(1):e49–e55. doi:10.17269/cjph.108.5651.
- Michalski J. The economic status and coping strategies of food bank users in the greater Toronto area. CJUR. http://www.jstor.org/stable/44320774. 2003. Accessed December 16, 2022.
- Starkey LJ, Kuhnlein HV, Gray-Donald K. Food bank users: sociodemographic and nutritional characteristics. CMAJ. 1998;158:1143–1149.
- Long CR, Narcisse M-R, Rowland B, et al. Food pantry usage patterns are associated with client sociodemographics and health. Hunger Environ Nutr. 2021;17(3):408–424. doi:10.1080/19320248.2021.2001404.
- Coveney J, O’Dwyer LA. Effects of mobility and location on food access. Health Place. 2009 Mar;15(1):45–55. doi:10.1016/j.healthplace.2008.01.010.
- Daponte B. Private versus public relief: Utilization of Food pantries versus food stamps among poor households in Allegheny County, Pennsylvania. Madison: Institute for Research on Poverty, University Wisconsin; 1996.
- Daponte BO, Lewis GH, Sanders S, Taylor L. Food pantry use among low-income households in Allegheny County, Pennsylvania. J Nutr Educ. 1998;30(1):50–57. doi:10.1016/s0022-3182(98)70275-4.
- Larsen K, Gilliland J. Mapping the evolution of food deserts in a Canadian city: Supermarket accessibility in London, Ontario, 1961–2005. Int J Health Geogr. Apr 18 2008;7(1):16. doi:10.1186/1476-072X-7-16.
- Kirkpatrick SI, Tarasuk V. Assessing the relevance of neighbourhood characteristics to the household food security of low-income Toronto families. Public Health Nutr. 2010 Jul;13(7):1139–1148. doi:10.1017/S1368980010000339.
- Haugen K. The advantage of’near’: Which accessibilities matter to whom? EJTIR. 2011;11(4):368–388. doi:10.18757/EJTIR.2011.11.4.2941.
- Mondor L, Watson T, Kornas K, Bornbaum C, Wodchis WP, Rosella LC. Direct and indirect pathways between low income status and becoming a high-cost health care user in Ontario, Canada: a mediation analysis of health risk behaviors. Ann Epidemiol. 2020 Nov;51:28–34 e4. doi:10.1016/j.annepidem.2020.07.006.