
 ?Mathematical formulae have been encoded as MathML and are displayed in this HTML version using MathJax in order to improve their display. Uncheck the box to turn MathJax off. This feature requires Javascript. Click on a formula to zoom.
ABSTRACT
Studies of online campaigning have consistently demonstrated a positive impact on electoral success, but it remains unclear how this occurs. Some find the content and style of post matter, while others have pointed to overall activity as the key driver, promoting a “broadcast” effect model. Still, others have argued for indirect effects whereby candidates rely on followers to share content within their networks. This paper develops a “joined-up” model to test these arguments that includes new measures to capture the responsiveness of candidate tweets and the extent of user engagement. We apply the model to the 2017 UK General Election Twitter campaign. Our findings confirm a digital campaign effect, but in a two-step rather than direct manner. Specifically, candidates that attract more engagement with their tweets (likes and retweets) enjoy more electoral success. We expand on our findings to argue for a “network” rather than “broadcast” model of digital campaign effects.
Introduction
Evidence showing that digital campaigning boosts candidates’ electoral support has increased over time, although how and why this occurs remains subject to debate. Early work suggested that simply having a web page was sufficient to attract more votes; however, later studies have shown that how candidates use the medium, and particularly how interactive they are, is critical for mobilizing support. Questions have also been raised about whether it is direct exposure to online campaign content (broadcast or “one-step” effect) that matters or impact is generated indirectly by followers re-posting candidates’ content in a networked or “two-step” manner. This study addresses these competing claims in the context of the United Kingdom 2017 General Election using an original dataset that combines candidate Twitter messages with aggregated constituency survey data and electoral results. We highlight here the obvious caveat that our analysis was conducted prior to the purchase of Twitter by Elon Musk. Given that the takeover has led to widespread calls for an exodus from the medium (Massie, Citation2023), however, this makes the time-period of our study arguably more likely to capture the “real” usage and impact of this type of micro-blogging activity.
Digital campaigning and political mobilization
Early studies of web campaigning demonstrated a surprisingly strong relationship with candidates’ performance. D’Alessio’s (Citation1997) analysis of the 1996 US Congressional elections reported that candidates with a website enjoyed 9,300 more votes than those without. Low rates of internet access among the US voters prompted some skepticism about these findings, but subsequent, more rigorous, studies reported similarly significant, albeit smaller effects (Gibson & McAllister, Citation2006; Wagner & Gainous, Citation2009). Analyses using evidence from the voters’ perspective proved more ambivalent, suggesting that any effects were small and likely conditional. Bimber and Davis (Citation2003) found no significant impact on turnout or vote choice, although those visiting websites were more likely to be undecided on whom to vote for, indicating that web campaigns might offer a small but strategic advantage in marginal contests. Studies using field experiments to test the impact of online campaigns reached similarly mixed conclusions (Dale & Strauss, Citation2009; Green & Gerber, Citation2004; Malhortra et al., Citation2012). Overall, online appeals did not appear to mobilize those who would otherwise not have turned out, but did exert a priming effect, or serve as a “noticeable reminder” for those who were already likely to go to the polls.
As campaigns migrated to social media platforms, findings about the impact continued to point to a small but significant positive relationship, particularly when measured through candidates’ aggregate vote share (Gibson & McAllister, Citation2011; Gilmore, Citation2012). In probing how these effects were occurring, scholars identified several factors ranging from the simple volume of tweets (Bright et al., Citation2020) to their level of interactivity (Kruikemeier, Citation2014; Tromble, Citation2018) and policy responsiveness (Ceron & d’Adda, Citation2016; Stier et al., Citation2018). While these studies did not develop extensive theoretical arguments to support why those variables mattered, they all broadly assumed a direct effects model. Regarding the tweet volume, the basic idea was that a higher rate of tweets amplified a candidate’s voice and allowed them to “broadcast” their parties’ national message to a wider range of voters at the local level. For tweet interactivity and policy responsiveness, the reasoning centered on this being more appealing to voters and thus more likely to generate support.
Indirect or two-step mobilization
In addition to models testing the direct effects of candidates’ online communication on vote choice, scholars have also drawn attention to more indirect pathways to influence. Studies of mediated effects of campaign messages on voter behavior pre-date the Internet era, starting from Lazarsfeld et al. (Citation1944) seminal work on the “two-step” flow model of communication. The model has since been revived, initially by Norris and Curtice (Citation2008) and Hooghe and Vissers (Citation2009), with evidence showing that visitors to party websites in the UK and Belgium were significantly more interested and engaged in politics than the average voter. Any effects attributed to online campaigns, they argued, were thus likely due to the technology allowing candidates to reach, and “preach through,” the converted. Nielsen and Vaccari (Citation2013) in their analysis of the 2010 US Congressional election also suggested any effects of social media on electoral outcomes should be indirect. Starting from the observation that candidates’ average followership was typically very small (less than 0.5% of their electorate), they argued it was wholly improbable that direct exposure to their posts led to any significant electoral gain. Instead, any increased support was likely to be generated in an indirect two-step manner whereby bloggers and other influential actors shared campaign content with a wider pool of persuadable voters.
Subsequent work on the growth of a new genre of online political actors – micro-influencers – has developed this argument further, with several recent studies pointing to the importance of non-official but highly networked individuals in promoting certain candidates or issues in national elections (Riedl et al., Citation2023). Some scholars have explicitly linked this to the Lazarsfeld et al. (Citation1944) “two-step flow” model, with online influencers representing a new type of digitally enhanced “opinion leaders” (Dubois & Gaffney, Citation2014). Whether local parliamentary candidates in the UK 2017 election enjoyed this “booster” effect is open to question. Karlsen (Citation2015) concluded that a large majority (70%) of the social media followers of Norwegian politicians met the criteria for “opinion leaders,” suggesting that the medium can provide a useful platform for political actors to extend their reach. Arguably, the UK’s reliance on single member districts (SMD) may help to further enhance the opportunities for two-step flow, given the more local and personalized focus it brings to candidates’ campaigns (Carey & Shugart, Citation1995; Fenno, Citation1978)
Even a large following of ordinary users could serve to boost candidates’ electoral support simply by virtue of providing a multiplier effect for informal contact and endorsement. Based on the idea that political information and messages received via personal connections are given more attention and credence than content from unfamiliar sources (Diehl et al., Citation2016; Turcotte et al., Citation2015), there is a case for candidates with bigger networks of average or non-influential voices generating more support simply from the added persuasiveness that this attaches to their messages. Research by Bond et al. (Citation2017) on Facebook users during the 2010 and 2012 U.S. Congressional and Presidential elections, for example, found a small but significant increase in users’ likelihood to vote, if they were exposed to “I voted” messages from friends in their networks. By contrast, exposure to non-personalized prompts had no effect. Similarly, an analysis of the US and UK election survey data by Aldrich et al. (Citation2016) found that younger voters were especially more likely to be mobilized by political contact from friends and family compared to direct contact by parties. Whether such online mediation of messages can help to mobilize voters in support of candidates is a question that this study seeks to explore.
Hypotheses
We build on previous work by providing a more nuanced and detailed understanding of the mechanisms through which social media campaigns may garner votes, using a novel dataset. We begin by specifying several hypotheses from the extant literature that could explain how candidates’ social media use helps to increase their electoral support. Most recently, Bright et al. (Citation2020) found support for the “more tweets more votes” logic in the UK elections, concluding that it showed Twitter campaigns worked in a “broadcast” manner, whereby tweets amplified and intensified national campaign messages at the local level:
H1:
Frequency: Candidates that make more use of Twitter will achieve higher levels of electoral support.
Our next two hypotheses focus on interactivity and content. Considering that previous research has shown that users value interactivity online, we expect a more interactive style of posting to boost support:
H2:
Interactivity: Candidates that make more interactive use of Twitter will achieve higher levels of electoral support.
We also expect that candidates who post messages that are more congruent with the issues their voters most care about will enjoy greater support, based on two studies of candidates’ and politicians’ use of Twitter in Germany and Italy showing a “delegate” style of social media representation, with elites following voters’ issue concerns on Twitter (Ceron & d’Adda, Citation2013; Stier et al., Citation2018). Here, we are interested in whether posting in line with constituents’ policy concerns garners an electoral advantage; thus, we offer the following hypothesis:
H3:
Issue Congruence: Candidates that post content on Twitter that is more closely aligned with the issues that are of most concern to their constituents will achieve higher levels of electoral support.
The next set of hypotheses tests whether voters are influenced primarily by directly being exposed to candidate posts (broadcast or “one-step” flow), or indirectly, by candidates’ followers’ sharing such posts, thereby extending campaigns’ reach to a larger secondary audience (network, or “two-step” flow).
Posts can directly reach users who chose to follow candidates. However, candidates’ followers can increase their audience by spreading campaign messages to their own followers. Here, we specify a more active and precise understanding of the two-step effect by measuring the extent to which candidates’ online audiences redistribute and endorse their campaign content via “retweeting” and “liking” their posts. We expect that higher levels of engagement will increase post reach, and thus, potentially, vote share.
H4:
Engagement: Candidates whose tweets generate higher levels of engagement will achieve higher levels of electoral support.
Finally, we develop our understanding of a two-step effect by assessing whether the effects of engagement are contingent on the content and form of a candidate’s tweets. To capture this “booster” effect we combine H1–H3 with H4 to generate three new hypotheses:
H5:
Frequency-Plus: Candidates who make more frequent use of Twitter and whose tweets generate higher levels of engagement will achieve higher levels of electoral support.
H6:
Interactivity-Plus: Candidates that make more interactive use of Twitter and whose tweets generate higher levels of engagement will achieve higher levels of electoral support.
H7:
Issue Congruence-Plus: Candidates who post content that is more closely aligned with the issues that are of most concern to their constituents and whose tweets generate higher levels of engagement will achieve higher levels of electoral support.
Data and variable construction
To test these hypotheses, we examined the impact of candidate Twitter campaigns in the 2017 UK General Election. Twitter was the leading platform for elite political communication and campaigning in the UK at the time (Southern & Lee, Citation2019). The vast majority of MPs had Twitter accounts by 2017 and follower levels were robust, approximating 15 million in total.Footnote1 Twitter uptake among the UK public was also very high in global terms, particularly for political purposes and news consumption (Mellon & Prosser, Citation2017).Footnote2 While it is recognized that the analysis and findings are somewhat time-bound, a study of Twitter’s campaign effects in 2017 is arguably more valuable in terms of providing a more “normalized” understanding of its electoral role. We anticipate the methodology and findings discussed here will have continuing relevance and applicability for understanding the impact of micro-blogging sites in elections, even as politicians may pivot away from Twitter.
We tested our hypotheses using data from four main sources: (a) the crowd-sourced, Democracy Club 2017 candidate database; (b) a database of candidate campaign tweets constructed by the authors; (c) the British Election Study (BES) Combined Waves 1–13 Internet Panel open-ended response data (Fieldhouse et al., Citation2017); (d) UK Electoral Commission data reporting the number of votes received by each candidate in the election.Footnote3 The process of data preparation and variable construction occurred in three stages. First, candidate Twitter accounts and individual characteristics (party, gender) were extracted from database (a) and all tweets posted during the General Election campaign were collected and cleaned to create database (b). Second, the measures of candidate Twitter use – frequency, interactivity, issue congruence, and engagement – were constructed and added to database (b). Construction of the congruence measure required matching candidate tweet data with measures of constituency-level opinion, sourced from database (c). The design of this measure is explained in greater detail below. Third, database (b) was augmented with additional candidate and constituency-level variables expected to be linked with candidates’ Twitter use and/or levels of electoral support. This included candidate prominence (Cabinet or Shadow minister), campaign spending, constituency broadband speed, and marginality. The dependent variable – votes received in the 2017 election – was added from database (d).
Compilation of twitter accounts, tweet collection, and cleaning
A list of candidate Twitter IDs was obtained from Democracy Club (DC), an independent, nonprofit organization that coordinates thousands of online volunteers to provide information to the public.Footnote4 For this election, DC crowd-sourced a database of all candidates for the 650 UK constituenciesFootnote5 which included gender, birth date, party, and social media IDs.Footnote6 The list was retrieved on May 21st, shortly after the deadline for the presentation of candidacies. A total of 3,304 candidates stood for election in 2017Footnote7 averaging around 5 per constituency. The dataset we retrieved included a total of 3,303 candidates and provided Twitter usernames for 2,312 (70%).
A Python script was used to query the Twitter public Search API for the last 3,200 tweetsFootnote8 posted by all these 2,312 accounts in 2017.Footnote9 To minimize the risk of data loss and ensure coverage of the whole campaign, we repeated data collection six times during the campaign, with the last tweets being collected on June 15, 2017. Subsequently, in 2022, we took advantage of the new Twitter Academic API that at the time allowed unlimited access to historical tweets and, importantly, measures of engagement with them: “retweets” and “likes.” All tweet batches were imported to MongoDB. Any candidate usernames that were changed during the campaign were identified and attributed to the originals. We consolidated all tweets and removed duplicates and non-Unicode characters. We filtered the tweets to include only those posted during the official campaign (April 17th–June 8th), retaining a total of 1,852 of the 2,312 Twitter accounts included in the Democracy Club list (80.1%).Footnote10
Twitter variable construction
To test our hypotheses, we constructed five measures of candidate Twitter use: frequency, interactivity, issue congruence, and engagement.
Frequency measures the total number of tweets posted by the candidates during the campaign.
Interactivity was measured as the proportion of candidates’ overall tweets that were replies to other users. To ensure we captured replies to “regular” voters we excluded all replies that were to other “elite” accounts, i.e., other candidates, parties, media organizations, and journalists. A full list of the excluded non-candidate accounts is reported in Appendix 1. The percentage measure was standardized as a zero-to-one range.
Issue Congruence was measured as the correspondence between the issues mentioned by candidates and voters in their constituency. Construction of this variable occurred in three main stages. First, we identified the issues of importance by constituency in the lead up to the election. To do so, we used the British Election Study Combined Waves 1–13 Internet Panel Most Important Issue data.Footnote11 Respondents are asked, “As far as you’re concerned, what is the SINGLE MOST important issue facing the country at the present time?” The responses are recorded as free text and were concatenated across the available waves and grouped by constituencies. After the removal of frequent stopwords, a simple frequency count was conducted, with the words themselves acting as “issues.” We allowed here for common spelling mistakes like “imigration.” Based on the frequency, we produced a ranking of the top five issues among respondents in each constituency. Appendices 2 and 3 show full details.
Second, we matched the constituency level ordering of issues against those mentioned in candidates’ tweets. To do this, we aggregated each candidate’s tweets and extracted up to five topics using the Latent Dirichlet Allocation (LDA) model (Blei et al., Citation2003). The topics were ranked by relevance. Given that, like other algorithmic approaches for topic modeling, LDA returns only relevant keywords for each topic, we needed to assign names to each topic. To do so, we took the full list of issues extracted from the BES panel analysis and ranked them by the number of respondents, assuming the priority of a topic increases with the number of respondents that identify it as relevant. The relevant words for each topic were then collected automatically onlineFootnote12 and the resulting “bag-of-words” were treated as training data. This data was used to train a Multinomial Naive-Bayes (MNB) classifier and topics from the LDA model were classified using this model. This process was performed until five unique topics were discovered.Footnote13 After five topics were discovered, we then calculated a congruence score between topics from the LDA model and topics from BES survey data. summarizes the process.
Figure 1. Method for deriving topic congruence.
Finally, we calculated the cosine similarity scores between the two topic lists (t’ and t’”) to indicate congruence in the structure of the rank ordering or salience given to those topics by candidates and voters.Footnote14 To do so, a list of all topics T is compiled and two vectors of size 2n, ‘and’,” are prepared. For each vector:
where is the number of topics in
. For each topic
in
,
is a binary variable that marks whether topic
occurred in the list
and
marks the position of that topic in the list
.
represents the topics from the LDA model and
represents the topics from BES survey data. Then, the cosine similarity of vectors
and
is calculated:
If the value is 1, this means topics and their positions, i.e., priority, from the LDA model and BES survey data are the same. As priorities diverge or the number of common topics decrease, this value lowers until it reaches 0, meaning that candidates and voters have no topics in common. This number gives us the similarity between the two lists and thus provides a measure of congruence between the topics mentioned by the candidates in their tweets and by their constituents in the survey, as well as the ordering of those topics.
Our measure follows and augments the pioneering work of Stier et al. (Citation2018) who used machine learning techniques to match the policy content of candidate tweets in the 2013 German Federal election against the “most important problem” measured by the German Longitudinal Election Study (GLES). We adapted Stier and colleagues’ measure in three ways. First, we measured congruence at the constituency rather than at the national level (as here we focus on candidates in single-member districts where responsiveness to local concerns is more relevant). Second, whereas Stier et al. (Citation2018) took an open-ended approach to measuring congruence and correlated the ranks of all 18 topics derived from the GLES data against candidate posts, we only retained topics that appear in both the LDA models and those resulting from the BES data. Finally, we imposed a stricter criterion for congruence in using cosine similarity scores. These scores are computed based on congruence in the rank ordering of topics by candidates and voters.Footnote15 Stier et al. (Citation2018) used correlation in rank ordering (Spearman’s rho) which focuses on the relative salience of all topics covered.
Engagement was measured by the sum of likes and retweetsFootnote16 that candidates' tweets received during the campaign. Although we recognize that there is likely a stronger effect if those likes and retweets originate from a highly followed political influencer rather than an “average” user, we do not have data that might allow us to develop a more precise weighting system to account for this. Given that this is a count variable and highly skewed with a small number of candidates garnering an exponentially high volume of engagement (skewness = 36.97), we smoothed the data by recoding it into deciles.Footnote17 Turning this numeric variable into a nominal one also allowed us to avoid one of the pitfalls of multivariate interaction models as highlighted by Hainmueller et al. (Citation2019), i.e., making an untested assumption that the relationship between our independent variables of interest and the dependent variable is moderated by engagement in a linear way. Thus, we tested H5–7 by adding three interaction terms to our models: engagement x frequency, engagement x interactivity, and engagement x issue congruence.
The dependent variable – raw number of votes cast for a candidate – and a range of controls specified in prior studies (Bright et al., Citation2020) were drawn from secondary sources. These included candidates’ gender and party (Democracy Club dataset), electoral spending, and likelihood of winning or notional marginality (Electoral Commission), derived using the candidate or party’s performance in the constituency at the previous election. Candidates requiring a swing of 10% or more to win were classified as “no-hopers,” those needing a 10% swing to be ousted were “safe,” and all others were classified as “at risk.” We also included a measure of candidate prominence based on whether they were a cabinet or shadow cabinet member within their party at the time the election was called, or if they had occupied such roles in the previous year. For smaller parties, we considered leaders and deputy leaders as prominent. Aggregate measures of total votes cast in the constituency at the last election were added as a control for variance in the swing in party support since 2015, along with votes cast for the party in the 2015 General Election (sourced from the Electoral Commission). In the absence of an up-to-date and consistent measure of constituency Twitter use, we included a measure of the percentage of people in each constituency that were reported as unable to receive “decent” broadband service according to a recent report from House of Commons Library.Footnote18 This provides an indicator of citizens’ ability to access social media. We also included a measure of online popularity based on the number of followers candidates had on the last day of the campaign for which this information was available.Footnote19 This variable served as a control on candidates’ existing or prior support levels. Finally, dummy variables were added to account for regional differences in voting behavior.
Modelling strategy
A series of multivariate models were constructed to test our hypotheses. The dependent variable is the number of valid votes received by a candidate. As it is non-normally distributed (skewness of 0.68), it was log-transformed. The independent variables include our measures of candidates’ Twitter use (frequency, interactivity, and issue congruence), users’ engagement with candidates’ tweets, plus the three interaction terms and controls. Twitter use variables, broadband availability, number of valid votes in 2017, number of votes for the candidate’s party in 2015, and number of Twitter followers were standardized by subtracting the mean and dividing the result by the standard deviation. We used ordinary least-squares regression to test the models. Furthermore, since candidates are geographically clustered, we used multilevel modeling with random constituency intercepts (assuming fixed slopes across constituencies) to control for shared variance among candidates in the same constituency and the consequent problems of inflated standard errors for parameter estimates.
Given the highly uneven distribution of candidates on our main independent variable of interest – Twitter engagement – we applied coarsened exact matching (CEM) techniques to balance the sample. As Negri (Citation2023) notes, CEM is a widely adopted method within social science for pre-processing raw data to produce a more balanced sample for analysis on key covariates.Footnote20 We matched candidates who were in the same decile for Twitter engagement with a host of relevant covariates: gender, party affiliation, (shadow) cabinet membership, number of followers, likelihood to win, and campaign expenditure. As the algorithm requires variables to be entered as nominal values, any numeric measures were transformed prior to analysis. Gender was entered as a binary variable. Party affiliation was reduced to two categories – major or minor. The binary indicator for cabinet or shadow cabinet membership was retained, as were the three categories of likelihood to win (“no-hopers,” “safe,” and “at risk”). Candidates were split based on their numbers of followers by the CEM algorithm into 12 groups.Footnote21 Levels of campaign spending were transformed into three categorical variables corresponding to expenditure of less than £1,600; between £1,601 and £7,500; and over £7,500. With these parameters, the CEM algorithm successfully matched 1,526 candidates (82% of the 1,852 units for which we had complete data). Despite the initial data loss resulting from CEM, the end result was a significantly more balanced distribution of candidates across levels of Twitter engagement.Footnote22 Notably, the number of matched units was larger in the lower than higher deciles,Footnote23 indicating that the matching procedure reduced the risk our findings may be skewed by those candidates with extremely high levels of engagement, and for whom the correlation between social media activity and votes was most likely to be confounded by factors that the model cannot account for. We used the weights generated by the CEM process in the multivariate analyses to adjust for the disparities of candidate numbers in the different matched strata.
Results
Prior to reporting the results of our hypothesis testing we profile candidates’ use of Twitter with some key descriptive statistics presented in .
Table 1. Twitter use overall and by party.
Twitter adoption rates are generally high, with 89% of candidates having an account at the time of the campaign. There was some variation among the parties, with the UK Independence Party (UKIP) reporting the lowest adoption rate among its candidates (79%) and Labour the highest (92.5%). Two hundred and thirty candidates (just under 10% overall) had an account but did not tweet during the campaign. Of those candidates that did tweet, the most active overall posted 4,330 tweets. During the campaign, a total of 363,791 tweets were posted, an average of 196 per candidate. Comparing parties, Conservatives emerge as the least frequent tweeters, while those standing for UKIP posted the most.
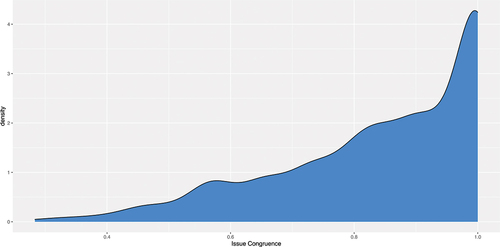
Levels of issue congruence and interactivity of candidate tweets showed less variation. The former was uniformly high across all parties (averaging around 0.85 out of a possible 1 on our standardized scale) while interactivity was, typically, quite low, around 0.30 on a similar 0–1 scale. Candidates from UKIP and the Liberal-Democrats featured the most interactive social media campaigns. Given that the cosine similarity score measuring congruence is less intuitive to interpret, we visualized the distribution of this variable in . As the measure gets closer to 1, this indicates that candidates are more congruent with their constituents in terms of tweeting about the issues that mattered for them. The chart shows that 28.5% of the candidates gained the top congruence score, meaning that more than a quarter of candidates were talking most about the top five issues that their constituents cared about.
Figure 2. Distribution of issue candidate-constituency issue congruence scores.
Candidates’ online popularity on Twitter varied significantly. Followership across all candidate accounts was 13,772,259, although this is likely to be an over-estimation of electorate attention, considering, e.g., bots, followers residing outside the UK, and duplication resulting from some users who followed multiple candidates. The average number of followers per candidate was just under 7,500 but the median is a much more modest 1,048, as only 15% of the candidates had 10,000 followers or more. Given the median following approximates to around 1.5% of the electorate in an average-sized constituency,Footnote24 prima facie, it seems unlikely that most candidates may be able to directly reach large enough audiences to make a difference electorally. Instead, expanding the campaign’s audience indirectly may be the most viable avenue to increased support for most campaigns.
In terms of engagement, the candidates typically received around 4,000 total likes and retweets across all their tweets. Given that, on average, candidates tweeted just under 200 times during the campaign, this means the average candidate tweet was liked or retweeted about 20 times – a rather modest number but consistent with the relatively low numbers of followers that most candidates had. There was, however, considerable variation across parties for this measure, with one Labour candidate gaining over a quarter of a million likes and retweets across the campaign.
So, although Twitter campaigning was widespread among UK candidates in the 2017 election, their levels of online popularity as measured by their follower numbers were low. These initial findings suggest that if any mobilizing effects occurred, this is more likely to be via an indirect two-step effect.
The relationship between twitter use and votes
shows the results of our multivariate OLS multilevel regression models with constituency random effects, based on data pre-processed with CEM. The table only includes the coefficients for our key explanatory variables. Model 1 includes the controls and our key Twitter use measures – frequency, interactivity, and issue congruence (testing H1–H3). Model 2 adds online engagement (H4) and model 3 includes the interaction terms combining use and engagement (H5–H7).
Table 2. OLS regression predicting number of Candidate votes.
The results for the control variables are largely as expected. Candidates that spend more and have a greater chance of winning receive significantly higher numbers of votes. Candidates whose party had received more votes in the 2015 General Election received more votes in 2017, and candidates in constituencies that cast more votes in 2017 received more votes, all else being equal. These results were consistent across Models 1–3 (see Appendix 4).
Perhaps, the most surprising finding from Model 1 is that two of the three Twitter use variables are not significant and the relationship between frequency and vote outcomes is negative and significant, contrary to H1. While this may be due to an under-specified model, our analysis includes an extensive range of controls, comparable or greater to those used in prior studies. A more plausible interpretation is that, given this analysis employs a more multi-faceted measure of Twitter use than earlier studies, i.e. one that takes into account the quality as well as quantity of candidate tweets, we are able to more precisely test and dismiss the notion that “more tweets equal more votes.” Once we control for the content of posts, it seems that those candidates who talk the most on Twitter are among the weakest performers on Election Day. Whether this is because they are already struggling as “no hopers” and their unsophisticated use of Twitter serves as a symptom of generally poor campaign, or their “megaphone” approach to online communication actually turns voters off is not something we can conclude based on these data. The former explanation, however, has some face validity given the significantly lower costs of high Twitter usage compared to other communication channels, particularly offline. As the null findings for interactivity and issue congruence of candidates’ tweets reveal, however, better quality tweets are not in and of themselves sufficient to increase support. Thus, H1–H3 can be rejected.
Model 2 includes our engagement variable (testing H4), which splits candidates into deciles based on their total numbers of likes and retweets. Here, we do see an effect for Twitter use in that most of the coefficients – which compare candidates in higher deciles with candidates in the lowest decile – are significant and increase in size as we move from lower to higher deciles. Hence, candidates whose tweets achieved higher levels of engagement also obtained higher numbers of votes, thereby supporting H4. plots the predicted number of votes based on Model 2 for candidates with different levels of engagement. The fact that confidence intervals overlap across all groups of candidates suggest caution is necessary in interpreting this finding.
Figure 3. Predicted vote by levels of engagement (based on Model 2 in table 2).
To test H5-H7, we add interaction terms to explore whether the impact of engagement increased for candidates who tweet more frequently and adopt a more interactive or issue-congruent tweeting style (Model 3 in ). There is some evidence that higher levels of issue congruence compound the positive relationship between levels of engagement and vote totals, as the two interaction-term coefficients between congruence and engagement are positive and significant.
visualizes the interaction between engagement and issue congruence. Candidates in the ninth decile of engagement who tweeted with the most congruent style are predicted to achieve significantly higher vote totals than candidates in some of the lower deciles of engagement, particularly if those candidates tweeted with the least congruent style. However, for candidates with lower levels of engagement (from the eighth decile down), congruence does not explain vote outcomes.
Figure 4. Predicted vote by levels of engagement and issue congruence in tweets (based on Model 3 in table 2).
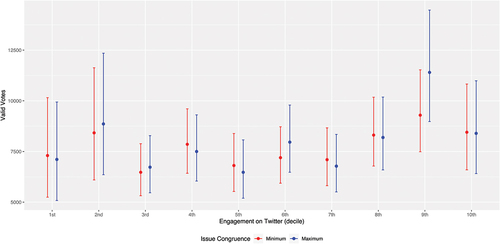
Based on these findings, therefore, H5 and H6 are rejected. However, H7 is partially supported, with respect to candidates with high levels of engagement. For candidates who achieved higher levels of engagement, higher levels of issue congruence in their tweets are associated with higher levels of electoral support.
Conclusions
While our study aligns with prior research in showing that campaigning on social media, and particularly Twitter, does appeal to some voters, in practical terms its effects on electoral outcomes are minimal to nil, and for most races it will make no difference. Furthermore, according to these results, for candidates to realize even a small return for their efforts, it is not enough to simply have a presence on Twitter: they need to generate user engagement with their content. Indeed, a high volume of tweets may be more of a hindrance than help in gaining an online profile. It is only when supporters like and share candidates’ posts that social media campaigning becomes electorally beneficial. That said, the impact is still very small. When it does occur, our findings suggest it happens in two main ways. First, by recruiting a set of key influencers in the political debate, candidates may increase the reach and persuasiveness of their messages. Second, as ordinary users’ share candidate tweets within their networks, they provide a more informal and personalized endorsement. In contrast to earlier studies that have argued for mobilizing effects being delivered directly, from candidates’ accounts to their followers; therefore, our study finds that, after controlling for a host of relevant factors, the primary means by which Twitter is likely to influence votes is via this two-step and socially networked or mediated effect. Furthermore, we find that the two-step mechanism is further enhanced when candidates post on issues that voters care about most. Of course, these conclusions come with the caveat that, while controlling for a host of “standard” explanatory variables for candidates’ electoral support, there are likely a range of localized and strategic factors that we did not measure. Additionally, the nature of our dataset means it is not possible to demonstrate that candidates’ Twitter use had a causal effect on votes.
In practical terms, however, our analysis is at least indicative that Twitter campaigning may have given a small but strategic advantage to the candidates that managed to attract the highest levels of engagement in the UK 2017 general election. Based on the estimates in and 4, we can infer that an average candidate whose tweets attracted more than 500 combined likes and shares during the campaign would obtain approximately 2,500 more votes than a comparable candidate whose tweets garnered less than 100 likes and shares. The advantage is noticeably bigger if the same average candidate tweeted on issues their constituents cared about: among politicians whose tweets garnered more than 500 likes and shares, posting about constituents’ priorities was predicted to gain further 2,500 votes. Given that 31 seats were won by a margin of 1% or less in the election,Footnote25 it appears plausible that attracting high volumes of engagement may have helped some candidates over the line – but once again, these conclusions only apply to those whose followers engaged with and amplified their messages. Our findings are thus significant in supporting the idea that social media campaigns can influence voters and in certain close races, may be worth a sustained investment of candidate and staffers time, particularly by posting content that attracts user engagement and echoes constituent concerns.
In reaching these conclusions, we raise several important new questions for future research to explore. Specifically, what comes first? Does a more responsive messaging style build-up user engagement, or do candidates who attract large volumes of engagement have a greater incentive to give their audiences content that is more responsive to their proprieties? How far does the two-step flow of communication rely largely on recruiting a small number of influential opinion leaders versus engaging a wider critical mass of “average” users and leveraging their networks? What is the ideal mix of these types of users to mobilize voters? Furthermore, to what extent do these findings carry across to other social media platforms? Does the more public and porous nature of Twitter networks make them particularly well suited to this rapidly scaling mode of indirect influence compared to other platforms like Facebook, which might have a larger user base but work in a more segmented and closed manner? Finally, to what extent does this two-step flow require follow-through in the offline environment to be truly effective? Have we identified the first two tiers of what is actually a three (or more)-step flow model of communication and mobilization, whereby candidates with the most engaging content attract a wider range of more “professional” and amateur opinion leaders that help spread their message to a wider audience and generate offline buzz that translates into electoral support? Unpacking these dynamics, although not a straightforward task, should lead us to a richer understanding of when and how social media campaigns matter.
Data access
Dataset (a) Democracy Club 2017 database is available as a csv file “CSV of all candidates for all elections on May 11th, 2017” at https://candidates.democracyclub.org.uk/api/docs/csv/#past.
Dataset (b) the database of candidate tweets cannot be made available publicly due to restrictions imposed by Twitter on the sharing of tweets for secondary analysis. Candidate Twitter IDs can be made available on reasonable request to the corresponding author.
Dataset (c) is available at https://www.britishelectionstudy.com/data-objects/panel-study-data. Dataset (d) is available at https://www.electoralcommission.org.uk/our-work/our-research/electoral-data/electoral-data-files-and-reports.
JIPT Gibson et al ALL_Apendices_R2.docx
Download MS Word (165.9 KB)Disclosure statement
No potential conflict of interest was reported by the author(s).
Supplementary material
Supplemental data for this article can be accessed online at https://doi.org/10.1080/19331681.2024.2387634
Additional information
Notes on contributors
Rachel Gibson
Rachel Gibson is Professor of Political Science at the University of Manchester. Her research focuses on the impact of new information and communication technologies on political parties, particularly with regard to their activities in the elections and campaigning sphere.
Rosalynd Southern
Dr. Rosalynd Southern is a Senior Lecturer in Political Communication at the University of Liverpool. Her work focuses on how digital and social media are used for political communication by politicians, parties and ordinary citizens.
Cristian Vaccari
Cristian Vaccari is a Professor in Future Governance, Public Policy and Technology at the University of Edinburgh. His research investigates how political parties, campaign organizations and citizens engage with one another on digital media, and how in the process they negotiate meanings, identities, resources, and, ultimately, power.
Peter Smyth
Peter Smyth is a Data Manager on the DiCED Project at the University of Manchester, based in the Cathie Marsh Institute.
Jahandar Musayev
Jahandar Musayev is a Software Engineer on the DiCED Project at the University of Manchester, based in the Cathie Marsh Institute.
Notes
1. Source MPs on Twitter (2018). https://www.mpsontwitter.co.uk/ and https://www.mpsontwitter.co.uk/list/followers. Accessed 30/06/2018. This aggregate figure does not consider duplication. A user following multiple politicians will be counted more than once. It does not differentiate between individual UK users and bots, organizational accounts, and those in foreign countries.
2. As of April 2018, the UK ranked third in the world in terms of Twitter users (18.6 million, following only the United States and Japan (Bonvillain, Citation2019, p. 161). According to the 2018 UK Office for Communications Report Adult’s Media Use and Attitudes. Available at https://www.ofcom.org.uk/__data/assets/pdf_file/0011/113222/Adults-Media-Use-and-Attitudes-Report-2018.pdf 24% of UK social media users use Twitter regularly. In 2018, the Reuters Institute reported that among internet users in 36 European countries, only Spanish respondents were more likely than British to use Twitter (39%) and use it for news (22%). Source: Reuters Digital News Report 2018 Available at http://media.digitalnewsreport.org/wp-content/uploads/2018/06/digital-news-report-2018.pdf
3. See Data Availability Statement for full details.
4. See https://democracyclub.org.uk/about/ (accessed 13 August 2018).
5. There are 650 constituencies across the UK.
6. The dataset can be retrieved at https://candidates.democracyclub.org.uk/help/api (accessed 13 August 2018).
8. The limit of 3,200 tweets is set by Twitter. Given that we repeated the data collection process multiple times, it is unlikely that we may have missed many tweets posted. Only three candidates posted more than 3,200 tweets during the campaign.
9. Any tweet deleted before our data collection began could not be included in our dataset. Conversely, tweets that candidates may have posted and deleted after our data collection ended are included in our dataset. Twitter also enables users to “protect” their accounts, in which case their tweets cannot be accessed via the public API, but this would be unlikely for candidates running for public office.
10. Manual checks on the accounts for which we could not collect any tweets suggest that the most common reason was that the account name provided in the Democracy Club dataset was incorrect.
11. Wave 13 has an N of 31,196 and combines respondents that have completed the survey over a time period 20th February 2014 (the first date of the sampling period of wave 1) and 23rd June 2017 (the final date of the sampling period of wave 13). 26669 of these 31, 1996 respondents also took wave 12, an overall wave on wave retention rate of 77.4%. 5,300 respondents took all of the first 13 waves of the survey, 17.5% of respondents who originally took wave 1 (https://www.britishelectionstudy.com/wp-content/uploads/2020/05/Bes_wave19Documentation_V2.pdf).
12. From http://www.conceptnet.io/.
13. Because our MNB classifier uses a word-count vectorizer, the number of keywords belonging to a topic that appear more frequently in the data indicates a higher probability of that data belonging to that topic. To measure the accuracy of the Multinomial Naive Bayes classifier, we generated test data by combining randomly selected words from https://www.mit.edu/~ecprice/wordlist.10000 [mit.edu] and randomly selected keywords belonging to randomly chosen topics. We mixed these words in different ratios, n representing the ratio of keywords known to belong to the topic, and measured the accuracy and F1 score of the MNB classifier. The results reported in Appendix 5 show, the more words from a topic that are included in the bag-of-words, the better the MNB classifier can classify the topic.
14. Cosine similarity is usually employed for purposes of information retrieval to calculate the similarity between two documents. For any two non-zero vectors, cosine similarity is the cosine of the angle between them. It normalizes two vectors to unit vectors and if these vectors are equal, i.e. have the same direction, the angle between them becomes 0° and the cosine value becomes 1. As the angle increases, cosine value decreases and for opposite vectors (180°), it becomes −1. When, as in our case, the vector space is positive, the value ranges from [0,1], which results in a normalized measure.
15. Cosine similarity is usually employed for purposes of information retrieval to calculate the similarity between two documents. For any two non-zero vectors, cosine similarity is the cosine of the angle between them. It normalizes two vectors to unit vectors and if these vectors are equal, i.e. have the same direction, the angle between them becomes 0° and the cosine value becomes 1. As the angle increases, cosine value decreases and for opposite vectors (180°), it becomes −1. When, as in our case, the vector space is positive, the value ranges from [0,1], which results in a normalized measure. Essentially, this meant we had a more accurate measure of the similarity in the order of importance of issues between candidates and the voters in their constituency.
16. The total number of likes and retweets each candidate received during the campaign were very strongly correlated with each other (Pearson’s R = 0.9974404, p = .000), so we added them together in an overall index of engagement.
17. The cutoff points for the deciles are as follows: 1) from 0–10 total engagement; 2) from 11–34; 3) from 35–68; 4) from 69–125; 5) from 126–208; 6) from 209–337; 7) from 338–14; 8) from 515–1,039; 9) from 1,040–3,092; 10) from 3,093–2,560,002.
18. Data were retrieved from the UK House of Commons “Data Dashboard” report on “Constituency data: broadband coverage and speeds” https://data.parliament.uk/resources/constituencystatistics/Broadband-speeds-2019.xlsx Unable to receive “decent” broadband access was defined in the report as the proportion of premises in a constituency as of May 2020 without access to a download speed of at least 10Mbit/s and an upload speed of 1Mbit/s, with a low of 0% lacking decent access (Aberavon) to a high of 22.7% (York Outer).
19. The 230 candidates who had accounts but did not tweet during the election were treated as having missing data here.
20. Use of CEM has gained ground during the past decade based on its evident simplicity, efficiency, and statistical power (Iacus et al., Citation2012). More recently, however, we do note the method has faced scrutiny and challenges regarding its capacity for optimizing both balance and matched sample size (King et al., Citation2017).
21. The cutoff points for these groups, calculated by the CEM algorithm, were as follows: 3; 114,350; 228,698; 343,045; 457,392; 571,740; 686,087; 800,435; 914,782; 1,029,129; 1,143,477; and 1,25,7824.
22. As reported by the CEM package in R, before the matching, the Multivariate Imbalance Measure was 0.294 and the Percentage of local common support was 5.2%. After the matching, these values were 0.165 and 11% respectively. These measures were calculated based on all the variables included in our multivariate models.
23. CEM excluded 33 candidates in the seventh decile, 30 in the eighth decile, 33 in the ninth decile, and 52 in the tenth decile of candidates with the highest levels of engagement; originally, each decile was composed of 157 candidates.
24. According to the Office of National Statistics, in 2017 the average size of a constituency ranged from 56,000 to 72,200. https://www.ons.gov.uk/peoplepopulationandcommunity/elections/electoralregistration/bulletins/electoralstatisticsforuk/2017
25. This translated into a range of 2 votes in the Scottish constituency of North East Fife, and up to 441 votes in Ashfield, in the East Midlands. See https://commonslibrary.parliament.uk/insights/ge2017-marginal-seats-and-turnout/ (accessed 24th August 2018)
References
- Aldrich, J. H., Gibson, R. K., Cantijoch, M., & Konitzer, T. (2016). Getting out the vote in the social media era: Are digital tools changing the extent, nature and impact of party contacting in elections? Party Politics, 22(2), 165–178. https://doi.org/10.1177/1354068815605304
- Bimber, B., & Davis, R. (2003). Campaigning online: The internet and US elections. Oxford University Press.
- Blei, D. M., Ng, A. Y., & Jordan, M. I. (2003). Latent dirichlet allocation. Journal of Machine Learning Research, 3(Jan), 993–1022.
- Bond, R. M., Settle, J. E., Fariss, C. J., Jones, J. J., & Fowler, J. H. (2017). Social endorsement cues and political participation. Political Communication, 34(2), 261–281. https://doi.org/10.1080/10584609.2016.1226223
- Bonvillain, N. (2019). Language, culture, and communication: The meaning of messages. Rowman & Littlefield.
- Bright, J., Hale, S., Ganesh, B., Bulovsky, A., Margetts, H., & Howard, P. (2020). Does campaigning on social media make a difference? Evidence from candidate use of twitter during the 2015 and 2017 UK elections. Communication Research, 47(7), 988–1009. https://doi.org/10.1177/0093650219872394
- Carey, J., & Shugart, M. (1995). Incentives to cultivate a personal vote: A rank ordering of electoral formulas. Electoral Studies, 14(4), 417–439. https://doi.org/10.1016/0261-3794(94)00035-2
- Ceron, A., & d’Adda, G. (2013). Enlightening the voters: The effectiveness of alternative electoral strategies in the 2013 Italian election monitored through (sentiment) analysis of twitter posts. European Consortium for Political Research, 1–25.
- Ceron, A., & d’Adda, G. (2016). E-campaigning on twitter: The effectiveness of distributive promises and negative campaign in the 2013 Italian election. New Media & Society, 18(9), 1935–1955. https://doi.org/10.1177/1461444815571915
- Dale, A., & Strauss, A. (2009). Don’t forget to vote: Text message reminders as a mobilization tool. American Journal of Political Science, 53(4), 787–804.
- D’Alessio, D. W. (1997). Use of the Web in the 1996 US election. Electoral Studies, 16(4), 489–500. https://doi.org/10.1016/S0261-3794(97)00044-9
- Diehl, T., Weeks, B. E., & Gil de Zúñiga, H. (2016). Political persuasion on social media: Tracing direct and indirect effects of news use and social interaction. New Media & Society, 18(9), 1875–1895. https://doi.org/10.1177/1461444815616224
- Dubois, E., & Gaffney, D. (2014). The multiple facets of influence: Identifying political influentials and opinion leaders on twitter. The American Behavioral Scientist, 58(10), 1260–1277. https://doi.org/10.1177/0002764214527088
- Fenno, R. (1978). Home style: House members in their districts. Little Brown.
- Fieldhouse, E., Green, J., Evans, G., Schmitt, H., van der Eijk, C., Mellon, J., & Prosser, C. (2017). British Election Study. Internet Panel Waves, 1–13. https://doi.org/10.15127/1.293723
- Gibson, R. K., & McAllister, I. (2006). Does cyber‐campaigning win votes? Online communication in the 2004 Australian election. Journal of Elections, Public Opinion and Parties, 16(3), 243–263. https://doi.org/10.1080/13689880600950527
- Gibson, R. K., & McAllister, I. (2011). Do online election campaigns win votes? The 2007 Australian “YouTube” election. Political Communication, 28(2), 227–244. https://doi.org/10.1080/10584609.2011.568042
- Gilmore, J. (2012). Ditching the pack: Digital media in the 2010 Brazilian congressional campaigns. New Media & Society, 14(4), 617–633.
- Green, D. P., & Gerber, A. S. (2004). Get out the vote! How to increase voter turnout. Brookings Institution Press.
- Hainmueller, J., Mummolo, J., & Xu, Y. (2019). How much should we trust estimates from multiplicative interaction models? Simple tools to improve empirical practice. Political Analysis, 27(2), 163–192. https://doi.org/10.1017/pan.2018.46
- Hooghe, M., & Vissers, S. (2009). Reaching out or reaching in? The use of party websites during the 2006 electoral campaign in Belgium. Information Communication & Society, 12(5), 691–714.
- Iacus, S. M., King, G., & Porro, G. (2012). Causal inference without balance checking: Coarsened exact matching. Political Analysis, 20(1), 1–24. https://doi.org/10.1093/pan/mpr013
- Karlsen, R. (2015). Followers are opinion leaders: The role of people in the flow of political communication on and beyond social networking sites. European Journal of Communication, 30(3), 301–318. https://doi.org/10.1177/0267323115577305
- King, G., Lucas, C., & Nielsen, R. A. (2017). The balance‐sample size frontier in matching methods for causal inference. American Journal of Political Science, 61(2), 473–489. https://doi.org/10.1111/ajps.12272
- Kruikemeier, S. (2014). How political candidates use twitter and the impact on votes. Computers in Human Behavior, 34, 131–139. https://doi.org/10.1016/j.chb.2014.01.025
- Lazarsfeld, P. F., Berelson, B., & Gaudet, H. (1944). The people’s choice. Columbia University Press.
- Malhotra, N., Michelson, M. R., & Valenzuela, A. A. (2012). Emails from official sources can increase turnout. Quarterly Journal of Political Science, 7(3), 321–332.
- Massie, G. (2023). ‘AOC threatens to leave twitter’. The Independent. Retrieved May , 2023. Accessed August 2023. https://www.independent.co.uk/news/world/americas/us-politics/aoc-twitter-musk-impersonation-account-b2348452.html
- Mellon, J., & Prosser, C. (2017). Twitter and facebook are not representative of the general population: Political attitudes and demographics of British social media users. Research & Politics, 4(3), 2053168017720008.
- Negri, F. (2023). ‘Correlation is not causation, yet … matching and weighting for better counterfactuals. In A. Damonte. and F. Negri (Eds.), Causality in policy studies: A pluralist toolbox (pp. 71–98). Springer International Publishing.
- Nielsen, R. K., & Vaccari, C. (2013). Do people “like” politicians on Facebook? Not really. Large-scale direct candidate-to-voter online communication as an outlier phenomenon. International Journal of Communication, 7, 24.
- Norris, P., & Curtice, J. (2008). Getting the message out: A two-step model of the role of the internet in campaign communication flows during the 2005 British general election. Journal of Information Technology & Politics, 4(4), 3–13. https://doi.org/10.1080/19331680801975359
- Riedl, M. J., Lukito, J., & Woolley, S. C. (2023). Political influencers on social Media: An introduction. Social Media+Society, 9(2), 205630512311779. https://doi.org/10.1177/20563051231177938
- Southern, R., & Lee, B. J. (2019). Politics as usual? Assessing the extent and content of candidate-level online campaigning at the 2015 UK general election. Journal of Elections, Public Opinion and Parties, 29(2), 179–198.
- Stier, S., Bleier, A., Lietz, H., & Strohmaier, M. (2018). Election campaigning on social media: Politicians, audiences, and the mediation of political communication on Facebook and Twitter. Political Communication, 35(1), 50–74. https://doi.org/10.1080/10584609.2017.1334728
- Tromble, R. (2018). Thanks for (actually) responding! How citizen demand shapes politicians’ interactive practices on Twitter. New Media & Society, 20(2), 676–697. https://doi.org/10.1177/1461444816669158
- Turcotte, J., York, C., Irving, J., Scholl, R. M., & Pingree, R. J. (2015). News recommendations from social media opinion leaders: Effects on media trust and information seeking. Journal of Computer-Mediated Communication, 20(5), 520–535. https://doi.org/10.1111/jcc4.12127
- Wagner, K. M., & Gainous, J. (2009). Electronic grassroots: Does online campaigning work? The Journal of Legislative Studies, 15(4), 502–520. https://doi.org/10.1080/13572330903302539