
ABSTRACT
Objective: To assess the relationship between clinical pattern and cerebral glucose metabolism on [18F]fluoro-2-deoxy-D-glucose positron emission tomography (FDG-PET) in Creutzfeldt-Jakob disease (CJD). Methods: Predefined clinical signs (ataxia, visual, pyramidal, myoclonus, limb apraxia, limb dystonia, sensory, parkinsonism, and corticobasal syndrome [CBS]) and FDG-PET data were assessed in consecutive CJD patients. Two types of statistical parametric mapping (SPM) analyses, using stringent level of significance p < 0.001 and extent threshold of 100 voxels, were performed: one comparing CJD patients presenting specific sign against CJD patients without this specific sign (inter-CJD analysis), and one comparing CJD patients with specific sign against 18 healthy controls (CJD-control analysis). Results: Fifteen CJD patients (11 probable and two histologically proven sporadic and two genetic CJD) were analyzed. CJD-control analysis of the entire CJD group showed lateralized frontal and parietal hypometabolism. When analyzing clinical CJD subgroups, inter-CJD analyses showed hypometabolism in more restricted areas than on CJD-control analyses. For CJD patients presenting with ataxia, visual signs and CBS (and CBS-associated signs), additional hypometabolic areas probably related to the specific signs were identified: pons and middle cerebellar peduncles in patients with ataxia; occipital cortex in patients with visual signs; and prerolandic and lateral parietal cortex in patients with CBS. For pyramidal signs, sensory loss, and parkinsonism, no abnormalities in brain areas typically involved in these signs were observed. Conclusion: In addition to lateralized frontal and parietal hypometabolism previously reported in CJD and observed here, hypometabolism in brain areas related to some specific signs (i.e. ataxia, visual signs, and CBS) is also seen.
INTRODUCTION
Our group previously reported a series of Creutzfeldt-Jakob disease (CJD) patients studied by [18F]fluoro-2-deoxy-D-glucose positron emission tomography (FDG-PET), analyzing nine CJD patients by statistical parametric mapping (SPM), showing lateralized FDG-PET hypometabolism in the medial and lateral parts of the frontal and parietal cortex (confirming earlier PET data in CJD patients).Citation1,2 In that study, FDG-PET proved more sensitive than MRI for detecting cortical abnormalities.Citation1 However, due to the high sensitivity and specificity of electroencephalogram abnormalities, MRI changes (typically showing high signal in the basal ganglia and/or the cortex on diffusion-weighted imaging and/or fluid-attenuated inversion recovery sequences), and 14-3-3 protein detection in the cerebrospinal fluid, the additional diagnostic value of FDG-PET for CJD diagnosis is probably limited. In our earlier CJD FDG-PET study, however, one of the most striking observations was the asymmetry of FDG-PET hypometabolism observed in each of the patients.Citation1
Signs frequently encountered in CJD include dementia, cerebellar ataxia, visual signs, pyramidal signs, extrapyramidal signs (rigidity, bradykinesia, and limb dystonia), akinetic mutism, myoclonus, ocular movement disorders, limb apraxia, sensory loss, and alien limb.Citation3 Sometimes, one or more of these clinical symptoms are predominant and considered as clinical CJD subtypes (e.g. the Heidenhain variant when prominent visual signs are present; or the corticobasal syndrome [CBS] subtype in the presence of higher cortical dysfunction [alien limb, apraxia, or cortical sensory loss] and movement disorder [rigid/akinetic syndrome, limb dystonia, and myoclonus]).Citation4,5 In these clinical CJD subtypes, case reports often show FDG-PET hypometabolism involving cortical areas related to the clinical signs. To the best of our knowledge, a systematical analysis of the relationship between clinical presentation and FDG-PET metabolism in CJD patients has never been reported. Our aim was to assess this relationship.
METHODS
Between December 2007 and February 2017, the diagnosis of CJD was established in 17 patients in our centre. Fifteen CJD patients were analyzed by FDG-PET, performed a median of 66 days after symptom onset. The remaining two patients (or their family) refused FDG-PET. All probable sporadic CJD patients had diagnosis based on the WHO criteria and the in 2009 updated clinical diagnostic criteria for CJD.Citation3 We predefined the following signs as present or absent in each patient based on standardized clinical examination: cerebellar ataxia, visual signs (impaired visual acuity, visual field loss, or visual hallucinations), pyramidal signs (muscle weakness, spasticity, or Babinski sign), myoclonus (spontaneous or reflex), limb apraxia, limb dystonia, sensory loss, parkinsonism (rigidity or hypokinesia), and corticobasal syndrome (alien limb, apraxia, or cortical sensory loss associated with rigid/akinetic syndrome, limb dystonia, or myoclonus).
Patients' demographic and clinical characteristics, codon 129 polymorphisms, disease duration at time of FDG-PET, and lateralization of PET hypometabolism were analyzed.
FDG-PET analyses were performed using the same methods and techniques as earlier described.Citation1
All brain FDG-PET scans were performed with a PET-CT GEMINI GXL (Philips Medical Systems). After fasting for at least 6 h, blood glucose level was check and less than 160 mg/dl. Patients were positioned comfortably in a quiet, dimly lit room before FDG administration and during the uptake phase of FDG (at least 20 minutes). They received intravenous injection of 185 to 250 MBq (5 to 6.7 mCi: according to the weight) of 18F-FDG by a canula inserted 10 minutes before. Patients were instructed not to speak, read or be otherwise active. For imaging, patients were in supine position, and the head immobilized in a masthead. Imaging began by CT surview (view angle 90, 120 kV, 30 mAs), then transmission CT scan for attenuation correction was done (120 kV, Mas/slice 200, Pitch 0.563, Rotation 1.5, thickness 3 mm, filter UB, collimation 16 × 1.5, FOV 600); static emission scan started 30 minutes after injection, in 3-D mode for 20 minutes, axial field of view 180 mm, 256 × 256 matrix, voxel size 2 mm3, and reconstruction was done with a three dimensional row-action maximum likehood algorithm LOR-RAMLA resulted in 90 transaxial slices.
Data were analyzed using statistical parametric mapping (SPM8, Wellcome Department of Cognitive Neurology, London, UK) implemented in Matlab R2012b (Mathworks, Natick, Massachusset, USA). Images have been globally normalized to 50 using proportional scaling to remove confounding effects to global cerebral glucose consumption changes, with a masking threshold of 0.8. The resulting statistical parametric maps, SPM[t], have been transformed into normal distribution (SPM[z]) unit. SPM t-maps have been set at p < 0.001, corrected for multiple comparisons with the False Discovery Rate option at voxel level. Only those clusters containing more than 100 contiguous voxels have been accepted as significant.
For SPM analysis, we used 18 healthy controls age-matched against the CJD patient group. We performed SPM analyses (false discovery rate, FDR) for each of the different clinical signs assessing brain areas showing decreased FDG-PET uptake using a stringent level of significance of p < 0.001 and an extent threshold of 100 voxels.
On SPM analysis, to better assess the brain areas involved in patients with specific clinical signs, we first compared the entire CJD group with controls. After this general analysis, we looked for hypometabolic brain areas for each of the clinical CJD subgroups presenting with a specific clinical sign. Two types of SPM analyses were performed: one comparing CJD patients presenting the specific sign against CJD patients without this specific clinical sign (inter-CJD analysis), and one comparing the CJD patients with the specific sign with the 18 healthy controls (CJD-control analysis). Two-sample t test design model were used for these analysis For visualization, the significant voxels were projected onto the 3D rendered brain or a standard MRI template allowing anatomic identification. Anatomical loci were also determined by converting cluster maxima to Talairach space (Talairach & Tournox, 1988; http://imaging.mrc-cbu.cam.ac.uk/imaging/MniTalairach). This output was cross-checked using the atlases of Talairach and Tournox (1988).
RESULTS
Patient Characteristics
Fifteen patients (10 women and five men; median age 69, range 52–86; including 11 patients with probable sporadic CJD, two with histologically proven sporadic CDJ, and two with genetic CJD [one with a E200K and one with a V210I missense PRNP mutation]) were studied. Codon 129 polymorphism was Met/Met in nine patients, Val/Val in three patients, and Met/Val in 1 patient, and was not performed in two patients. On MRI, basal ganglia and/or cortical MRI hyperintensities on DWI/FLAIR were observed in all patients. Periodic sharp wave complexes on electroencephalopgram were present in 11 out of 15 CJD patients, and CSF 14-3-3 protein present in all patients. Median time between symptom onset and FDG-PET was 66 days (range 18–247). Patient data is shown in . None of our patients experienced alien limb syndrome. Twelve CJD patients had left predominant and three right predominant brain hypometabolism. Eighteen healthy individuals, median age 69 (range 55–86), were included as controls. FDG-PET data for the entire CJD group and the different clinical CJD subgroups are shown in .
TABLE 1. Patient characteristics, codon 129 polymorphism, presence of periodic sharp wave complexes on electroencephalogram and CSF 14-3-3 protein, associated clinical signs/syndromes, time between symptom onset and PET, and lateralization of PET hypometabolism.
TABLE 2. FDG-PET data for the entire (global) CJD group and the different clinical CJD subgroups.
General Analysis: Entire CJD Group (n = 15) vs Controls (n = 18)
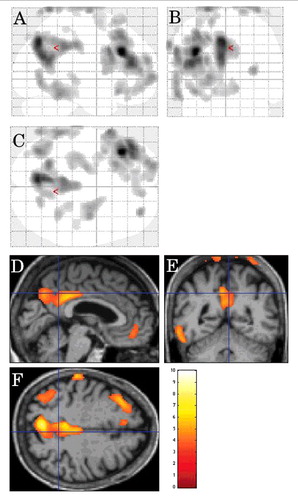
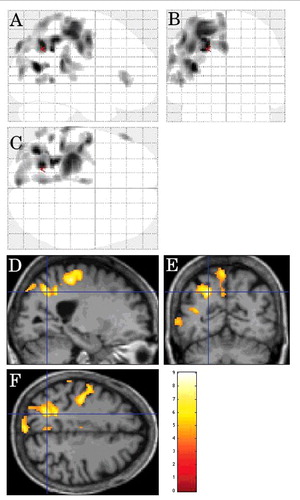
Decreased FDG-PET metabolism was observed in the left lateral frontal cortex and the left mesial parietal cortex, and to a lesser degree the right mesial parietal cortex and the left lateral posterior temporal cortex in CJD patients in comparison to controls ().
FIGURE 1. SPM showing decreased FDG-PET metabolism (using a stringent level of significance of p<0.001 and an extent threshold of 100 voxels) in the left lateral frontal cortex and the left mesial parietal cortex, and to a lesser degree the right mesial parietal cortex left lateral posterior temporal cortex in CJD patients in comparison to controls.
Cerebellar Ataxia
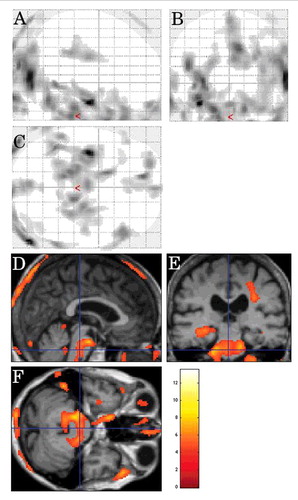
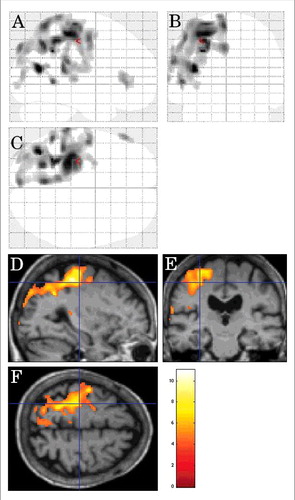
On inter-CJD analysis, in patients with cerebellar ataxia (n = 9), FDG-PET hypometabolism was observed in the pons, the bilateral (left-predominant) middle cerebellar peduncles, the right frontal subcortical lobe, and the left mesial temporal cortex ().
FIGURE 2. Inter-CJD SPM analysis, using a stringent level of significance of p<0.001 and an extent threshold of 100 voxels, in patients with cerebellar ataxia, showing FDG-PET hypometabolism in the pons, the bilateral (left-predominant) middle cerebellar peduncles, the right frontal subcortical lobe, and the left mesial temporal cortex.
On CJD-control analysis, hypometabolism was seen in the left lateral frontal cortex, the bilateral (left-predominant) mesial parietal cortex, and the left lateral posterior temporal cortex in the CJD group.
Visual Signs
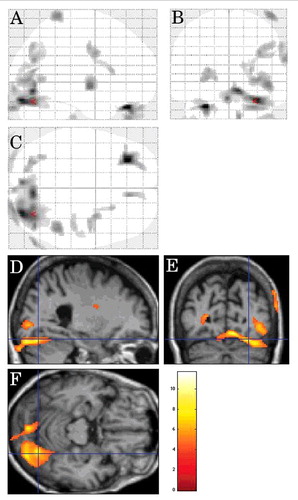
On inter-CJD analysis, decreased metabolism was seen in the bilateral (right-predominant) occipital cortex and the right frontal subcortical lobe in CJD patients with visual signs (n = 6) ().
FIGURE 3. Inter-CJD SPM analysis showing decreased metabolism (using a stringent level of significance of p<0.001 and an extent threshold of 100 voxels) in the bilateral (right-predomiant) occipital cortex and the right frontal subcortical lobe in CJD patients with visual signs.
On CJD-control analysis, hypometabolism was observed in the left occipital cortex, the left lateral frontal cortex, the left mesial parietal cortex, the right lateral posterior temporal cortex, and the left anterior deep grey matter in comparison to the controls.
Pyramidal Signs
On inter-CJD analysis, hypometabolism was observed in the left subcortical occipital lobe in patients with pyramidal signs (n = 5).
On CJD-control analysis, decreased metabolism was observed in the left lateral frontal cortex and the left mesial parietal cortex in comparison to the controls.
Myoclonus
On inter-CJD analysis, in CJD patients with myoclonus (n = 5), the left lateral parietal cortex showed hypometabolism ().
FIGURE 4. Inter-CJD SPM analysis (using a stringent level of significance of p<0.001 and an extent threshold of 100 voxels), in CJD patients with myoclonus, showing hypometabolism in the left lateral parietal cortex.
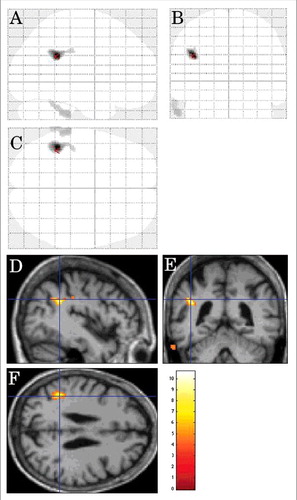
FIGURE 5. Inter-CJD SPM analysis, in the CJD patients with limb dystonia, showing left lateral parietal cortex and left lateral prerolandic frontal cortex hypometabolism (using a stringent level of significance of p<0.001 and an extent threshold of 100 voxels).
On CJD-control analysis, hypometabolism was seen in the left lateral parietal cortex, the bilateral (left-predominant) mesial parietal cortex, the left lateral frontal cortex, and the left lateral posterior temporal cortex in the CJD group.
Limb Apraxia
On inter-CJD analysis, hypometabolism was seen in the bilateral mesial parietal cortex, the bilateral mesial and left lateral frontal cortex, and the left mesial occipital cortex in CJD patients with limb apraxia (n = 8).
On CJD-control analysis, hypometabolism was seen in the left lateral parietal cortex, the left lateral frontal cortex, and the left occipital cortex in the CJD group.
Limb Dystonia
On inter-CJD analysis, in the CJD patients with limb dystonia (n = 7), the left lateral parietal cortex and the left lateral prerolandic frontal cortex showed hypometabolism ().
FIGURE 6. Inter-CJD SPM analysis showing hypometabolism in the left lateral prerolandic frontal cortex, the left -lateral more than mesial- parietal cortex, and the left lateral posterior temporal cortex in patients with corticobasal syndrome.
On CJD-control analysis, hypometabolism was seen in the left lateral and mesial parietal cortex, the left lateral frontal cortex, and the left lateral temporal-occipital cortex in the CJD group.
Sensory loss
In the patients with sensory loss (n = 2), no specific areas of hypometabolism were observed on inter-CJD analysis or CJD-control analysis.
Parkinsonism
On inter-CJD analysis, no areas of specific hypometabolism were observed in the patients with parkinsonism (n = 4).
On CJD-control analysis, hypometabolism was seen in the left lateral frontal cortex, the bilateral (left-predominant) orbitofrontal cortex, the bilateral (left predominant) mesial parietal cortex, and the left lateral posterior temporal cortex in the CJD group.
Corticobasal syndrome
On inter-CJD analysis, hypometabolism was seen in the left lateral prerolandic frontal cortex, the left -lateral more than mesial- parietal cortex, and the left lateral posterior temporal cortex in patients with CBS (n = 7) ().
On CJD-control analysis, hypometabolism was observed in the left lateral frontal cortex, the left lateral and mesial parietal cortex, and the left lateral posterior temporal cortex.
Complementary Analyses
In all clinical CJD subgroup analyses, inter-CJD analyses showed hypometabolism in more restricted areas than by CJD-control analyses. Inter-CJD analyses probably better reflect sign specific areas, since areas with hypometabolism generally-associated with CJD pathology were less visible as they were present in both compared clinical subgroups. For each clinical subgroup, we further looked for large hypometabolic areas on inter-CJD analyses other than those visible on analysis of the entire CJD group vs controls (i.e. lateral frontal, mesial parietal, and the lateral posterior temporal cortex), thus potentially related to the clinical sign. For CJD patients presenting with cerebellar ataxia, visual signs, myoclonus, apraxia, dystonia, and CBS, hypometabolic areas probably related to the specific sign were identified: hypometabolism in the pons and the middle cerebellar peduncles in CJD patients with cerebellar ataxia; hypometabolic occipital cortex in patients with visual signs; and prerolandic and parietal cortex hypometabolism in patients with CBS (and CBS-associated signs). For pyramidal signs, sensory loss, and parkinsonism, no brain areas typically involved in these clinical signs were observed on inter-CJD or CJD-controls analyses. Patients with genetic CJD (n = 2) did not show any specific FDG-PET metabolism modifications compared with sporadic CJD patients.
DISCUSSION
Although parkinsonism and pyramidal signs are often observed in CJD (“extrapyramidal or pyramidal signs” are one of the four main clinical signs required for probable CJD diagnosis according to the MRI-CJD Consortium criteria for sporadic CJD), basal ganglia hypometabolism was not observed in our study and prerolandic cortex involvement only observed in the dystonia and CBS subgroup but not in the pyramidal subgroup. In the subgroup with sensory signs, no specific hypometabolic area was identified. In contrast with the other clinical subgroups, subgroups with parkinsonism, pyramidal signs and sensory signs (i.e. the subgroup without hypometabolic areas corresponding to their clinical signs) has very small patient numbers (parkinsonism, n = 4; pyramidal signs, n = 5; sensory signs, n = 2), possibly explaining the lack of identifiable, statistically significant, corresponding hypometabolic brain areas. For the same reason, possibly, statistical differences lacked between genetic and sporadic CJD patients. For the subgroup with parkinsonism and pyramidal signs, another hypothesis may be that these signs might not be necessarily related to the specific brain structures classically explaining these signs (striatum and prerolandic cortex, respectively). For instance, parkinsonism and pyramidal signs might be related to widespread brain involvement, or possibly due to frontal lobe involvement (often associated with bradykinesia and hypertonia), or -in the case of parkinsonism- substantia nigra hypometabolism (difficult to assess due to the small volume of this structure).Citation6,7
The lateralized brain FDG-PET metabolism in CJD patients probably led to an underestimation of the involved brain areas assessed by SPM in our study since patients with the same clinical sign often had different lateralization of brain hypometabolism. Even with this limitation together with the small number of patients, the fact that we still identified hypometabolic brain areas corresponding to most of the clinical signs probably reflected genuine clinical-PET correlation.
The majority of our CJD patients had left lateralized brain hypometabolism, probably also explaining the left predominant brain areas involved in the clinical subgroup analyses.
In corticobasal degeneration, asymmetric FDG-PET hypometabolism is typically seen in the posterior frontal, inferior parietal, and lateral temporal cortex, and in the striatum and the thalamus.Citation8,9 In CJD patients presenting with CBS, based on our study, CBS seemed to be related to posterior frontal and parietal (and to a lesser degree lateral temporal) cortex involvement rather than to striatal or thalamic hypometabolism not observed in our patients.Citation9
In our analyses of both the entire CJD group and the clinical CDJ subgroups, deep grey matter did not show decreased metabolism. This is in contrast with the MRI abnormalities which typically also involve the basal ganglia, and the widespread (including basal ganglia) histological abnormalities characterized by diffuse and symmetrical involvement, suggesting (at least partially) different pathophysiological mechanisms leading to MRI, PET, and histological abnormalities.Citation10,11
FDG-PET data in our patients has to be interpreted with caution since volumetric MRI analyses and partial volume corrected-PET assessment were not performed in our study.
In general, MRI abnormalities (together with electroencephalogram and CSF changes) are typically seen in symptomatic CJD patients (and even can precede clinical symptoms), making FDG-PET non-essential in the diagnosis of CJD. However, in case of lack of complete (i.e. MRI, electroencephalogram, and/or CSF) work-up for CJD (e.g. when MRI is contraindicated [e.g. pace-maker] or difficult to interpret [e.g. due to motion artifact related to agitation; also making also electroencephalogram difficult to interpret and sometimes lumbar puncture difficult to perform]), FDG-PET (and the knowledge of expected FDG-PET abnormalities in CJD) might be useful in the diagnosis of CJD and its clinical subgroups. In particular, in addition to lateral frontal and mesial parietal hypometabolism generally found in CJD patients, hypometabolism can be observed in the pons and the middle cerebellar pedoncules in CJD patients with ataxia, in the occipital cortex in CJD patients with visual signs, or in the prerolandic and lateral parietal cortex in CJD patients with CBS (and CBS-associated signs).
Larger patient numbers are needed to further analyze the relationship between clinical presentation and FDG-PET metabolism.
DISCLOSURE OF POTENTIAL CONFLICTS OF INTEREST
We have no conflict of interest to declare.
ACKNOWLEDGMENTS
We would like to thank Dr. Sarah Kabani (Service de Biostatistique, Epidémiologie Clinique, Santé Publique et Information Médicale (BESPIM), Nîmes University Hospital, 4 Rue du Professeur Debré, 30029 Nîmes Cedex 09) for the excellent editing of our manuscript.
REFERENCES
- Renard D, Vandenberghe R, Collombier L, Kotzki PO, Pouget JP, Boudousq V. Glucose metabolism in nine patients with probable sporadic Creutzfeldt-Jakob disease: FDG-PET study using SPM and individual patient analysis. J Neurol. 2013;260:3055-64. doi:10.1007/s00415-013-7117-6. PMID:24068371
- Kim EJ, Cho SS, Jeong BH, Kim YS, Seo SW, Na DL, Geschwind MD, Jeong Y. Glucose metabolism in sporadic Creutzfeldt-Jakob disease: a statistical parametric mapping analysis of (18) F-FDG PET. Eur J Neurol. 2012;19:488-93. doi:10.1111/j.1468-1331.2011.03570.x. PMID:22050286
- Zerr I, Kallenberg K, Summers DM, Romero C, Taratuto A, Heinemann U, Breithaupt M, Varges D, Meissner B, Ladogana A, et al. Updated clinical diagnostic criteria for sporadic Creutzfeldt-Jakob disease. Brain. 2009;132:2659-68. doi:10.1093/brain/awp191. PMID:19773352
- Lee W, Simpson M, Ling H, Mclean C, Collins S, Williams DR. Characterising the uncommon corticobasal syndrome presentation of sporadic Creutzfeldt-Jakob disease. Parkinsonism Relat Disord. 2013;19:81-5. doi:10.1016/j.parkreldis.2012.07.010. PMID:22943965
- Cannard K, Galvez-Jimenez N, Watts R. Creutzfeldt-Jakob disease presenting and evolving as rapidly progressive corticobasal degeneration. Neurology. 1998;50(Suppl 4):A95
- Malone S, Miller I, Jakayar P, Resnick T, Bhatia S, Duchowny M. MRI-negative frontal lobe epilepsy with ipsilateral akinesia and reflex activation. Epileptic Disord. 2008;10:349-55. PMID:19017579
- Niedermeyer E. Akinesia and the frontal lobe. Clin EEG Neurosci. 2008;39:39-42. doi:10.1177/155005940803900112. PMID:18318418
- Lutte I, Laterre C, Bodart JM, De Volder A. Contribution of PET studies in diagnosis of corticobasal degeneration. Eur Neurol. 2000;44:12-21. doi:10.1159/000008187. PMID:10894990
- Coulier IM, de Vries JJ, Leenders KL. Is FDG-PET a useful tool in clinical practice for diagnosing corticobasal ganglionic degeneration? Mov Disord. 2003;18:1175-8. doi:10.1002/mds.10498. PMID:14534923
- Cali I, Castellani R, Yuan J, Al-Shekhlee A, Cohen ML, Xiao X, Moleres FJ, Parchi P, Zou WQ, Gambetti P. Classification of sporadic Creutzfeldt-Jakob disease revisited. Brain. 2006;129:2266-77. doi:10.1093/brain/awl224. PMID:16923954.
- Armstrong RA, Cairns NJ, Lantos PL. Quantification of the vacuolation (spongiform change) and prion protein deposition in 11 patients with sporadic Creutzfeldt-Jakob disease. Acta Neuropathol. 2001;102:591-6. doi:10.1007/s004010100412. PMID:11761719