
ABSTRACT
Managing and controlling the spread of diseases in wild animal populations is challenging, especially for social and mobile species. Effective management benefits from information about disease susceptibility, allowing limited resources to be focused on areas or populations with a higher risk of infection. Chronic wasting disease (CWD), a transmissible spongiform encephalopathy that affects cervids, was detected in Colorado in the late 1960s. CWD was detected in Illinois and Wisconsin in 2002 and has since spread through many counties. Specific nucleotide variations in the prion protein gene (PRNP) sequence have been associated with reduced susceptibility to CWD in white-tailed deer. Though genetic resistance is incomplete, the frequency of deer possessing these mutations in a population is an important factor in disease spread (i.e. herd immunity). In this study we sequenced 625 bp of the PRNP gene from a sampling of 2433 deer from Illinois and Wisconsin. In north-central Illinois where CWD was first detected, counties had a low frequency of protective haplotypes (frequency <0.20); whereas in northwestern Illinois counties, where CWD cases have only more recently been detected, the frequency of protective haplotypes (frequency >0.30) was much higher (p < 0.05). Protective haplotype frequencies varied significantly among infected and uninfected geographic areas. The frequency of protective PRNP haplotypes may contribute to population level susceptibility and may shape the way CWD has spread through Illinois. Analysis of PRNP haplotype distribution could be a useful tool to assess CWD risk and allocate resources to contain and reduce the spread of infection.
Introduction
Managing and controlling the spread of diseases in wild animal populations is challenging, especially for highly social and mobile species. Ideally, a disease will be detected early so that control measures can be implemented to prevent epidemics. Early detection often relies on widespread disease surveillance, which can be costly and labor intensive, but is necessary to detect rare events and prevent further spread. Unfortunately, surveillance methods may lead to management that is reactive to new disease cases rather than proactive. Wildlife managers would benefit from the ability to assess infection potential and thereby allow for the application of limited resources to areas or populations with the greatest risk of disease infection.
Chronic wasting disease (CWD) is a transmissible spongiform encephalopathy (TSE) or prion disease, which is a fatal neurological disorder caused by the misfolding of a common protein (PrPC) into an infectious conformation (PrPSc) [Citation1]. CWD was first detected in cervids in the late 1960s in Colorado [Citation2,Citation3] and has since spread to an increasing number of other US states and Canadian provinces [Citation4,Citation5]. The disease is transmitted horizontally by contact with pathogenic prions shed in bodily fluids [Citation6,Citation7] and vertically from mother to offspring [Citation8,Citation9]. Once shed, prions have been shown to persist in the environment, potentially remaining infectious and furthering disease spread long after affected deer have dispersed [Citation10–Citation12]. If left unchecked CWD prevalence will increase slowly over time [Citation13–Citation16] and deer population densities will decline [Citation17,Citation18], possibly to the point of extirpation [Citation19,Citation20]. Negative economic impacts are also expected due to decreased hunter confidence, decline in wildlife viewing, and increased regulation of the captive cervid industry [Citation21,Citation22].
Given the resilience of the infectious prion [Citation23], the relative ease of transmission [Citation24], and the uncertain interspecific barrier to transmission [Citation25–Citation27], a response plan is necessary as more is learned about the health and economic impacts of CWD. Therefore, management has primarily focused on containment utilizing various combinations of expanded surveillance, restrictions on movement or translocation of susceptible individuals, public hunting, and culling by government agencies [Citation4,Citation28–Citation31]. The Illinois Department of Natural Resources (IDNR) is one of the few management agencies currently using targeted culling to reduce deer densities in areas with CWD infected deer to prevent the further spread of CWD [Citation4,Citation32]. The program has been successful in that disease prevalence has remained relatively constant since first detection Citation[33]; however, the area with detected infected deer has steadily grown from three counties in the first year to 17 counties by fiscal year (FY; July 1 – June 30) 2017 [Citation32]. The role of culling in CWD management remains controversial and the efficacy may differ substantially if disease transmission is density or frequency dependent [Citation17]. Transmission dynamics are complex and studies assessing management techniques should incorporate additional parameters such as heterogeneity in disease susceptibility.
Studies of white-tailed deer (Odocoileus virginianus) genetics have identified variations in the PRNP gene correlated with reduced susceptibility to CWD. Specifically a single mutation at nucleotide (nt) 286 (G/A) produces an amino acid change (aaG96S – cervid protein coding sequence), and individuals with nt286A (aa96S) are less likely to be infected with CWD than individuals with nt286G (aa96G) [Citation34–Citation39]. Previously we examined PRNP sequences, finding 24 unique haplotypes involving 14 variable nucleotide sites [Citation34]. One of the haplotypes (designated haplotype ‘C’), which contained the nt286A mutation as well as a synonymous mutation (nt555T, aa185I), was found to be significantly less common among deer infected with CWD. The presence of this haplotype does not provide complete resistance at the individual level, and it may play an important role in reducing population-level susceptibility to CWD (i.e., herd immunity [Citation40]). In this study we examine from a broad geographic area the largest sampling of PRNP gene sequences to date. By examining the distribution of PRNP haplotypes across northern Illinois with regard to CWD infection and genetic resistance, we identified potential barriers to or corridors for the spread of disease.
Results
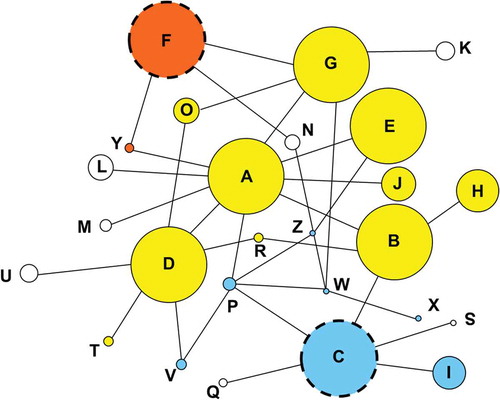
PRNP sequences were determined for 2433 deer harvested between FY2003 and FY2015, of which 251 tested positive for CWD, 2031 were negative, and 151 were not tested. Though deer were harvested over a 12 year period, samples were not collected evenly on a temporal scale. That is samples were collected in some areas only after CWD was detected (i.e. earliest sampling in McHenry FY2003 and JoDaviess FY2008). This study includes animals with nucleotide sequences previously described for examination of CWD susceptibility [Citation34]. The current study included sequence from 1730 new individuals from a broader sampling area that have not previously been reported. All 14 variable sites that have been previously identified within a 625 bp region of PRNP [Citation34,Citation35,Citation41] were detected. Twenty-six haplotypes were predicted from unphased sequences, of which two (Haplotype Y, with a single nonsynonymous polymorphic site at nt285C (aa95H) and Haplotype Z with two polymorphisms one nonsynonymous at nt286A/aa96S and one synonymous at nt438T/aa185I) are novel, while 24 have been previously reported[Citation34]. For analysis and interpretation, the protein coding sequences are considered; however, only nucleotide sequences are examined so as not to dismiss the role of synonymous mutations which may have a greater effect on protein expression and conformation than previously expected. [Citation42–Citation46] All haplotype sequences have been deposited in GenBank (accession numbers MG856905-MG856930). The relationships among haplotypes are shown in , with haplotypes sharing identical amino acid sequences (thus separated only by synonymous differences) shown in the same color. Interestingly, all of the major non-protective haplotypes (Haplotypes A, B, D, E and G) shared the same amino acid sequence, whereas the two protective haplotypes (Haplotype C and Haplotype F) each coded for an amino acid sequence distinctive from the other major haplotypes and from each other.
Figure 1. Network showing relationships among haplotypes of PRNP. Each circle represents a distinct haplotype sequence, designated A through Z, with circle sizes proportional to the frequency of the haplotypes among white-tailed deer. Each line indicates a single nucleotide difference separating two haplotypes (there were no cases where the line depicted represented more than a single nucleotide difference). Haplotypes that share the same color have the same inferred amino acid residues for the portion of the coding region sequenced (and thus are separated only by synonymous difference). The haplotypes protective against CWD are identified using a dashed circle. Interestingly, each of the two protective haplotypes (C in blue and F in orange) had a different amino acid sequence than the other major haplotypes (A through H, exclusive of C and F) and from each other. The haplotypes depicted in white each had a distinct amino acid sequence from every other haplotype.
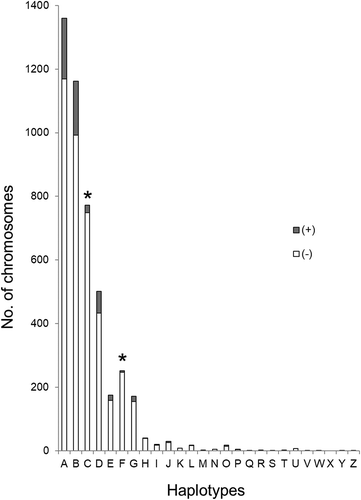
Susceptibility to CWD was assessed by logistic regression as previously described [Citation34]. Haplotype C was confirmed to be associated with reduced CWD susceptibility (). Haplotype F was significantly associated with reduced disease susceptibility although a significant effect had not been established by our previous study [Citation34]. Haplotype F possesses two nucleotide mutations, one synonymous at nt60T and one non-synonymous at nt285C, the latter of which has been previously linked to resistance [Citation38,Citation39]. With larger sampling in the current study, (n = 1972 after restricting the data to only positive and negative deer matched with respect to demographic data and from counties with at least five confirmed cases of CWD) haplotype F was found to be significantly associated with reduced CWD susceptibility (p < 0.05) (). When comparing CWD negative and positive status by PRNP haplotype, a lower frequency of CWD is evident for deer carrying haplotypes C and F ().
Table 1. PRNP haplotype frequencies and association with CWD infection.
Figure 2. CWD status in white-tailed deer by PRNP haplotype. Each haplotype is listed along the x-axis, while the y-axis indicates number of chromosomes. Within each bar, the shaded region represents CWD positive deer, while the unshaded region represents CWD negative deer. Asterisks indicate those haplotypes (C and F) associated with a statistically significant reduction in CWD cases when compared to Haplotype A. Unphased sequences of PRNP were generated for 2282 deer; for an alignment of these sequences, the software PHASE v2.1 was used to identify phased haplotype sequences (2N = 4564 chromosomes). For each homozygous deer, two was added to the chromosome number for the appropriate haplotype, while one was added to each relevant haplotype for heterozygous deer.
We examined the geographic distribution of haplotypes by comparing the ratio of protective haplotypes (C and F) to susceptible haplotypes in deer populations between FY2003 and FY2015. Haplotypes rather than diplotypes were examined as previous studies found one copy of the protective mutations sufficient to cause a measurable effect[Citation36]. Management of deer is typically coordinated by county; therefore, we grouped deer according to the county of harvest. Time, geography, habitat characteristics, and overall deer biology are factors influencing infection probability. We found a moderate correlation between how long a county has been infected with CWD and the average number of CWD cases detected per year in each county (Pearson Correlation Coefficient p = 0.014, R2 = 0.3855; ). In north-central Illinois where CWD was first detected in Boone County during FY2003, Boone and McHenry counties had a low ratio of protective to susceptible haplotypes (<0.20, ). In northwestern Illinois, JoDaviess, and Stephenson, and Carroll counties, where CWD cases were more recently detected (FY2011, FY2008, and FY2017 respectively), during the study period of FY2003 to FY2015, the ratio of protective to susceptible haplotypes was much higher (>0.30, ) for these counties. Unexpectedly, Winnebago (the Illinois County with one of the first and the most number of confirmed cases of CWD) had a slightly higher ratio of protective haplotypes (0.245) than either Boone or McHenry (0.186 and 0.178 respectively). Similarly, Lake County had a very low ratio (0.149) though CWD has been detected only recently in FY2014 (). Comparing the average number of CWD infected deer detected per county (between FY2003 and FY2015) to PRNP haplotypes revealed a pattern in which the ratio of protective haplotypes is inversely related to disease occurrence (with the exception of Winnebago County). This was most evident in JoDaviess, LaSalle, Ogle, and Stephenson counties during the study period; these had ratios of protective haplotypes between 0.24 and 0.33, and averaged between 1.4 and 2.6 cases of CWD per year (). For comparison, Boone and McHenry counties had protective haplotype ratios of 0.186 and 0.178 with an average of 10.6 and 12.8 cases of CWD per year ().
Table 2. Proportion of protective haplotypes by county FY2003-2015.
The protective haplotypes did not provide complete protection against CWD infection, yet resistance may play a role in herd immunity and thus affect how the disease spreads across the landscape. We examined infection occurrence at the 1.6 km x 1.6 km scale (township, range, section or TRS, according to the Public Lands Survey System) classifying each as infected (at least 1 confirmed case of CWD since 2002), adjacent (TRS with no confirmed cases of CWD, but in contact with or within 100 meters of an infected TRS), or outside the infected area (>100 meters from an infected TRS and no confirmed cases of CWD). Sample size for these analyses was reduced (n = 2047) to exclude deer without definitive sampling location (only known the county level) or well outside the Illinois infection area (e.g. deer from Piatt or Shelby Counties, and Wisconsin). To determine whether protective haplotypes contributed to this pattern, we compared the ratio of protective and susceptible haplotypes between each category of TRS (infected, adjacent, or outside) within each county, using Fisher’s exact tests (). When comparing the three TRS categories, significantly different proportions of protective haplotypes among the three categories were detected only in DeKalb, Kane, and Stephenson counties (p < 0.045, ). In Kane and Stephenson, the ratio of protective to susceptible haplotypes was lowest (0.13 and 0.16) in the positive TRS group and higher (≥0.33) in both the adjacent and outside TRS group (). DeKalb had a similar pattern in that the positive TRS group was lowest (0.19) and the adjacent TRS group higher (0.39); however, the outside TRS group was much lower (0.20) than in the other two counties ().
Table 3. Proportion of protective haplotypes by TRS category per county.
To more accurately reflect biological population structure, deer were also assigned to populations based on the genetic structuring of white-tailed deer previously determined by Kelly et al. (2014). Deer were assigned to one of four regions based on sampling location: North-central, northeast, northwest, and south-central (). Deer without definitive origin (i.e., sampling location only known to the county level) or outside of the Illinois infection area (e.g., deer sampled from Piatt and Shelby counties or Wisconsin) were excluded (n = 2047 after exclusion). The ratio of protective to susceptible haplotypes was examined within each region and a similar pattern was observed, albeit not as striking. The ratio was greatest in the northwestern region (0.2834) encompassing the counties where detection of CWD occurred more recently, and lowest in the northeastern region (0.1643; ). The ratio was not as low in the north-central region (0.2086), which encompasses the counties where CWD was first detected in Illinois, but it was lower than both the northwestern and south-central (0.2463) regions, which have not experienced infections as lengthy or sustained as the north-central region (). Infections first occurred in the northwest and southcentral regions in FY2008 (Stephenson) and FY2007 (LaSalle) respectively, the first CWD positive deer were detected in the north-central region in FY2003 (Winnebago, ). Pairwise comparisons of the ratio of protective to susceptible haplotypes between regions were only significantly different (Fisher’s exact test, α = 0.008 after Bonferroni correction) between the northwest versus northeast regions and northwest versus north-central regions (p < 0.001).
Table 4. Proportion of protective haplotypes by TRS category per region in Illinois.
Figure 3. Map of northern Illinois CWD infection distribution. (A) Orange lines indicate region boundaries guided by genetic population structure determined by Kelly et al. 2014. Each TRS tested for CWD between 2002 and 2015 is color coded based on the cumulative results from the Illinois Department of Natural Resources Chronic Wasting Disease Surveillance and Management program: (red, POS) at least one confirmed case of CWD, (blue, ADJ) no infected deer but a detection within a TRS less than 100 meters away, or (purple outline, OUT) no infected deer detected and more than 100 meters from an infected TRS. (B) Frequency of protective haplotypes within each region among TRS categories.
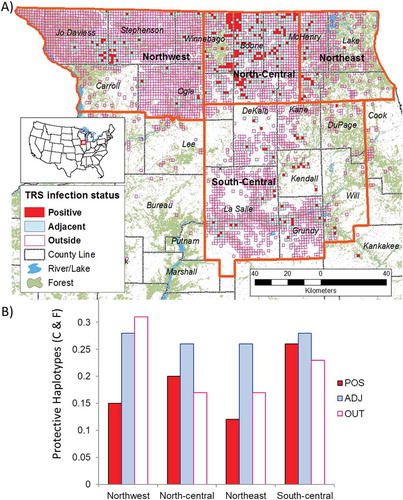
Within north-central and northwestern regions the infection follows a clustered pattern in that an infected TRS is typically adjacent to another infected TRS () during the study period. Comparatively, in the south-central region each infected TRS is scattered and rarely adjacent to another positive TRS. Only the north-central (p = 0.049) and northwestern (p = 0.011) regions were significantly different in the haplotype ratios between infected, positive, and outside TRS groups (). Both of these regions had a lower ratio of protective haplotypes within infected TRS group (≤0.20) and a higher ratio of protective haplotypes in adjacent TRS group (>0.26). The northwestern region had a higher ratio of protective haplotypes in the outside TRS group (0.31) whereas this ratio was much lower in the north-central region (0.17). The northeastern region follows a similar pattern as the north-central region in having a low (0.12), high (0.26), and low (0.17) ratio of protective haplotypes in the infected, adjacent, and outside TRS groups respectively (). The south-central region was also not significant (p = 0.33) in the haplotype ratios but presented a pattern of moderate ratios of protective haplotypes for all three TRS group categories (0.26, 0.28, and 0.23) compared to the northeastern region.
Discussion
The dynamics of disease spread are complex; understanding them involves many areas of research (e.g., biochemistry [Citation47] or landscape variables [Citation48]). We examined the genetic aspects of the spread of CWD, with the goal of contributing insights useful for containing and if possible eliminating (or at least reducing) chronic wasting disease among wild deer populations. Specifically, we examined the association between the frequency of protective PRNP haplotypes and chronic wasting disease prevalence across northern Illinois. Previous studies have focused on the impact of individual genotypes on susceptibility to CWD [Citation34–Citation39] finding that some genotypes were associated with reduced susceptibility, although not to the extent reported for some PRNP genotypes in other TSEs such as scrapie [Citation49,Citation50]. Previous studies with a population genetics approach have utilized neutral markers (i.e. microsatellites) to correlate patterns of genetic ancestry with potential for disease spread [Citation51,Citation52]. In areas such as northern Illinois, there are few barriers to dispersal and population genetic studies have found the deer population to be relatively homogenous [Citation52]. The neutral markers did not reveal genetic barriers to disease transmission. However, other markers examined at the population level may provide promising insights. Among caribou populations in Alberta, Canada, an increased frequency of the protective 138N PRNP allele was associated with reduced CWD susceptibility[Citation53]. The PRNP gene in white-tailed deer, in which certain mutations provide partial resistance to deer carrying them, is a promising marker for examining the spread of CWD.
We found two haplotypes (haplotypes C and F) to be significantly associated with reduced incidence of CWD (p < 0.001, ). When examining genetic susceptibility it is important to consider natural selection as a driver for the presence and distribution of protective alleles. Reduced incidence of CWD as a result of the protective haplotypes would be reasonable given there is a selective advantage over other non-protective haplotypes. However, due to the nature of CWD infection (i.e., lengthy incubation period allowing for reproduction while asymptomatic [Citation39]), combined with the recent appearance of CWD infection in Illinois, the selective impact of CWD on the PRNP gene in Illinois is likely to have been limited. The distribution of protective and non-protective haplotypes would be the result of factors other than CWD infection. Interestingly, the non-protective haplotypes A, B, D, and E shared the same amino acid sequence, whereas both of the protective haplotypes (C and F) had amino acid differences from these major haplotypes and from each other (). This may suggest that at least part of the effects of haplotypes C and F on CWD resistance may be mediated by differences in the amino acids coded for by the haplotypes.
Previous studies have examined the effect of the Q95H and G96S mutations (present in haplotypes F and C respectively) finding delayed incubation, with individuals ultimately still succumbing to the disease [Citation39]. While asymptomatic deer shedding infectious prions into the environment for longer periods of time is a great concern, these studies do not assess infectious dose as a factor in disease spread. While it is possible that a deer possessing the resistant mutation can still become infected with substantial and direct exposure, it is unclear how much of the prion an individual will naturally encounter and whether the dose of exposure would need to be greater for deer expressing protective haplotypes. In the current study, of the 22 deer that tested positive for CWD that carried at least one copy of the protective haplotype, 18 were sampled from the north-central region (of which 9 originated in Winnebago County), three from the south central region and one from Wisconsin (data not shown). Quantifying the amount of infectious prion in the environment is beyond the scope of this study. Nevertheless, due to greater occurrence of positive deer with protective haplotypes in the north-central region (particularly Winnebago County) and the longer time and intensity of infection, it does not seem unreasonable that an individual deer would encounter a sufficiently larger dose here than in other regions to overcome any benefit of genetic resistance (e.g. soil characteristics that increase availability of prions [Citation54]). Further research is necessary to determine the efficacy of the protective mutations against lower doses of infectious prion material. If at lower doses the protective haplotypes confer resistance and deer do not succumb to the disease or shed infectious prions while asymptomatic, then protective haplotypes could plan an important role in managing new or recent outbreaks.
Though neutral markers suggest that white-tailed deer in northern Illinois are fairly homogeneous in their genetic structure [Citation52], comparisons of the proportion of protective haplotypes at various geographic scales demonstrated that they are not evenly distributed throughout the population. It is possible that the geographic distribution of PRNP haplotypes may vary due to stochastic factors such as genetic drift. Using geopolitical boundaries, which are the typical population unit for management purposes, we found interesting patterns in the distribution of haplotypes C and F relative to CWD infection. Boone and Winnebago were among the first counties in which CWD had been initially detected, and have an average of more than ten positive deer detected annually (). These counties also have some of the lowest proportions of the protective haplotypes. By contrast, JoDaviess and Stephenson counties have a much higher proportion of the protective haplotypes, and on average fewer than three positive deer are detected annually (). It is important to note that the number of CWD positive deer detected each year are used to estimate disease prevalence. Given the extensive disease monitoring effort in Illinois [Citation32] this value is useful for comparative purposes. When populations are assigned using genetically determined partitions (, ), deer originating in the northwest have the greatest proportion of protective haplotypes and deer in the northeast and north-central regions have the lowest. Delayed infection in the northwest (Carrol, JoDaviess, and Stephenson; ) is particularly surprising because this region is in close proximity to the initial infection sites within both Illinois and Wisconsin (Boone, McHenry, and Winnebago; ) [Citation32,Citation55]. Establishment of a new outbreak or expansion from the outbreak in the north central region may have been delayed because the population of deer in the northwest carries a greater proportion of protective haplotypes than any of the other regions examined. This pattern suggests that PRNP variation contributes to population level susceptibility.
When the distribution of protective haplotypes is compared to clustering patterns among infected and uninfected areas at a finer scale (TRS), we found differences that likely contribute to the pattern of disease spread. Infections in the north-central and northwestern regions show clustering, with an infected TRS near or adjacent to another infected TRS. The south-central region has a sparse pattern of infection where an infected TRS tends to be solitary and rarely adjacent to another infected TRS (). Most infected areas in the north-central and northwestern regions consist of approximately five contiguous infected TRS blocks; whereas infected areas in the south-central region generally consist of a single discontinuous infected TRS (). In the south-central region a three TRS block is the only contiguous area of infection. In this comparison, we can discount temporal influences on the patterns because initial infections in both the northwestern and south-central counties were not asynchronous (i.e., LaSalle, southcentral region in FY2007; Stephenson, northwest region in FY2008, and both JoDaviess, northwest region and Grundy, south-central region in FY2011; ). Both regions are similar in disease outcomes when measured by average annual number of positive deer detected (), yet the infected TRSs in the northwest are clustered and the infected TRSs in the south-central region are dispersed (). Genetic samples from CWD positive and negative deer were matched with respect to demographic data (e.g., age, sex, geographic origin); in other regards, deer were selected randomly from the population through hunter harvest and government culling. Examination of available demographic data among deer originating in each region did not reveal any apparent differences (Fisher’s exact test, p > 0.05, data not shown). The differences in demographic categories, even if important in other ways, would not have influenced haplotype frequencies. Additionally the overall proportion of protective haplotypes C and F were not significantly different between northwestern and south-central regions (p = 0.012, α = 0.008 after Bonferroni correction, data not shown). Yet the distributions of the protective haplotypes were different within the northwestern and within the south-central regions (). The south-central region was relatively homogenous with a moderate proportion of protective haplotypes in both infected and uninfected TRS groups () and in the northwest the distribution of protective haplotypes is lowest in the infected TRS group and higher in the adjacent and outer TRS groups (). We cannot preclude sampling error as an explanation for the differences in haplotype distribution; however, this particular distribution of haplotypes could have contributed to the observed pattern by acting as a genetic barrier preventing the spread of CWD. The greater frequency of deer carrying the protective haplotypes could slow the geographic spread of CWD. The north-central region indicated a similar pattern as the northwest where the infected TRS group had a low proportion of protective haplotypes and the adjacent group was slightly higher (). The proportion of protective haplotypes dropped sharply in the outer TRS group (). The high frequency of protective haplotypes in the ADJ and OUT categories in the northwestern region () could help explain why the infection has progressed more to the east and south than in the northwest. Rather than there being a geographic feature acting as a barrier to the physical movement of deer [Citation56–Citation58] or distance from the outbreak origin [Citation51,Citation59,Citation60] affecting CWD spread, the barrier in this case could be the frequency of the protective PRNP haplotypes, with greater frequencies having a role analogous to those played by physical geographic features or by geographic distance.
Actively managing the spread of CWD is vital to the long-term persistence of healthy white-tailed deer [Citation33,Citation61]. It is unlikely that the disease will be completely eliminated from the landscape but as the area infected increases, so do the resources needed for containment and management. We find that the dynamics of chronic wasting disease spread may be shaped by the frequencies of PRNP haplotypes that provide protection against chronic wasting disease. Populations with a higher frequency of the protective haplotypes might lower the speed at which CWD spreads throughout the landscape than populations with a low frequency of protective haplotypes and close proximity to other infected areas. This suggests that managing the disease will be more difficult in areas with a greater frequency of susceptible haplotypes in the deer herd. Population genetic analysis of the PRNP gene may be a useful tool for management agencies to assess risk and best allocate increasingly limited resources.
Materials and methods
Deer sampling and CWD testing
Skeletal muscle for DNA isolation was collected only from wild free-ranging white-tailed deer between FY2003 and FY2015 in Illinois and Wisconsin from both public hunting and government culling. Obex and retropharyngeal lymph nodes were collected and tested for CWD using USDA approved immunohistochemical (IHC) procedures to detect protease-resistant prion protein (PrPSc) at the Illinois Department of Agriculture Diagnostic Laboratories in Galesburg or Centralia. At the time of sampling, detailed information including location (harvest county or if possible the 1.6x1.6 km area), sex, and age was recorded. Deer for this study were selected from a larger sampling based on harvest location to represent the distribution of deer across the study area. Samples from CWD positive deer were matched with CWD negative deer on the basis of age, sex, and geographic origin (TRS) to minimize any sampling bias.
PRNP amplification and sequencing
Genomic DNA was isolated using the Wizard Genomic DNA Purification Kit (Promega, Madison, WI) or Qiagen DNeasy Blood & Tissue Kit (Qiagen Inc., Valencia, CA) following the manufacturer’s recommended protocol. A 625 bp region of PRNP that codes amino acids 21 to 227 was amplified by polymerase chain reaction (PCR) using previously published primers CWD-13 and CWD-LA [Citation62] or primers 223 and 224 [Citation37]. Amplification was performed in 25 ul reaction volumes following previously published protocols [Citation34,Citation35,Citation62].
PCR amplicons were purified enzymatically [Citation63] or using the Wizard SV Gel and PCR Clean-Up System (Promega, Madison, WI). Products were then sequenced using the BigDye Terminator system (ABI), purified, and resolved on an ABI 3730XL DNA Sequencer at the University of Illinois Keck Center for Functional and Comparative Genomics. The software SEQUENCHER (Gene Codes Corporation, Ann Arbor, MI) was used to edit and align sequences. The identities of DNA sequences were confirmed using NCBI BLAST (http://www.ncbi.nlm.nih.gov/blast/Blast.cgi) and the positions of variable sites were identified by comparison to published DNA sequence. Open reading frames were confirmed and sequences were translated in MEGA v6.0 [Citation64]. Sequences were checked for the absence of the aa138N mutation to ensure that all sequences were PRNP and not the processed pseudogene. [Citation38] If aa138N was detected with primers CWD-13 and CWD-LA, then the sequence was verified with primers 223 and 224, which were specifically designed to only amplify the functional gene [Citation37] Though it is possible that this mutation could also occur in the functional gene, we did not observe aa138N in any deer when both primer sets were used.
Analysis
Haplotype analysis for disease association was restricted to deer with definitive CWD test results from infected counties with at least five confirmed cases of CWD. Haplotypes were estimated from unphased sequences using PHASE v2.1 [Citation65,Citation66]. Markov chain Monte Carlo (MCMC) samples were taken from a minimum of 100,000 steps, with a discarded burn-in of 10,000; samples were drawn every 100 MCMC steps. Five repetitions were performed and haplotype frequencies compared to verify consistent assignment. Disease status was binary, with infected deer as one and uninfected deer as zero. CWD susceptibility was determined by logistic regression as previously described [Citation34] with each haplotype treated as categorical data and haplotype A as the reference level. Odds ratios were calculated for significant haplotypes (alpha 0.05); ratios less than one were considered to have reduced CWD susceptibility. Population divisions were determined using county boundaries. Subsequently, regional differences were evaluated by combining counties guided by genetic population structure determined by Kelly et al. 2014, although the current range of the study area was larger than that of Kelly et al. Each 1.6 km x 1.6 km block (township, range, section or TRS according to the Public Lands Survey System) was classified as infected (at least 1 confirmed case of CWD since 2002), adjacent (TRS in contact with or within 100 meters of an infected TRS), or outside the infected area (>100 meters from an infected TRS and no confirmed cases of CWD). Each TRS tested for CWD between FY2003 and FY2015 is color coded based on the cumulative results from the Illinois Department of Natural Resources Chronic Wasting Disease Surveillance and Management program. Sample size for these analyses was reduced to exclude deer without definitive sampling location (only known the county level) or well outside the Illinois infection area (e.g. deer from Piatt or Shelby Counties or Wisconsin). All calculations were performed in R v3.0.0 [Citation67] with R Studio v0.98.10 [Citation68].
Acknowledgments
We thank the Illinois Department of Natural Resources for their efforts in collecting samples and the hunting community of Illinois and Wisconsin for their willingness to have deer tested for CWD. For technical assistance, we thank the students and technicians of the collaborative Novakofski and Mateus-Pinilla laboratories. This study was supported by the US Fish and Wildlife Service Federal Aid in Wildlife Restoration Project (W-146-R), the Illinois Natural History Survey, and the University of Illinois Office of the Vice Chancellor for Research.
Disclosure statement
No potential conflict of interest was reported by the authors.
Additional information
Funding
References
- Prusiner SB. Proceedings of the national academy of sciences of the United States of America. Prions. 1998;95(23):13363–13383.
- Williams ES, Young S. Chronic wasting disease of captive mule deer - spongiform encephalopathy. J Wildl Dis. 1980;16(1):89–98.
- Williams ES, Young S. Spongiform encephalopathy of Rocky-Mountain elk. J Wildl Dis. 1982;18(4):465–471.
- Illinois Department of Natural Resources. 2015 August 6. Chronic wasting disease: frequently asked questions. [ cited 2015 Aug 6]. Available from: <http://www.dnr.illinois.gov/programs/CWD/Pages/FAQs.aspx>.
- Richards BJ, Slota P 2015. Chronic wasting disease (CWD). USGS National Wildlife Health Center. [cited 2015 Apr 29]. Available from: <http://www.nwhc.usgs.gov/disease_information/chronic_wasting_disease/>.
- Gough KC, Maddison BC. Prion transmission prion excretion and occurrence in the environment. Prion. 2010;4(4):275–282.
- Haley NJ, Mathiason CK, Carver S, et al. Detection of chronic wasting disease prions in salivary, urinary, and intestinal tissues of deer: potential mechanisms of prion shedding and transmission. J Virol. 2011;85(13):6309–6318.
- Nalls AV, McNulty E, Powers J, et al. Mother to offspring transmission of chronic wasting disease in Reeves’ muntjac deer. Plos One. 2013;8(8).
- Selariu A, Powers JG, Nalls A, et al. In utero transmission and tissue distribution of chronic wasting disease-associated prions in free-ranging Rocky Mountain elk. J Gen Virol. 2015;96(11):3444–3455.
- Johnson CJ, Phillips KE, Schramm PT, et al. Prions adhere to soil minerals and remain infectious. PLoS Pathog. 2006;2(4):e32–e32.
- Nichols TA, Pulford B, Wyckoff AC, et al. Detection of protease-resistant cervid prion protein in water from a CWD-endemic area. Prion. 2009;3(3):171–183.
- Kuznetsova A, McKenzie D, Banser P, et al. Potential role of soil properties in the spread of CWD in western Canada. Prion. 2014;8(1):92–99.
- Miller MW, Williams ES, McCarty CW, et al. Epizootiology of chronic wasting disease in free-ranging cervids in Colorado and Wyoming. J Wildl Dis. 2000;36(4):676–690.
- Miller MW, Conner MM. Epidemiology of chronic wasting disease in free-ranging mule deer: spatial, temporal, and demographic influences on observed prevalence patterns. J Wildl Dis. 2005;41(2):275–290.
- Saunders SE, Bartelt-Hunt SL, Bartz JC. Occurrence, transmission, and zoonotic potential of chronic wasting disease. Emerg Infect Dis. 2012;18(3):369–376.
- Williams ES, Miller MW, Kreeger TJ, et al. Chronic wasting disease of deer and elk: a review with recommendations for management. J Wildl Manage. 2002;66:551–563.
- Wasserberg G, Osnas EE, Rolley RE, et al. Host culling as an adaptive management tool for chronic wasting disease in white-tailed deer: a modelling study. J Appl Ecol. 2009;46(2):457–466.
- Miller MW, Swanson HM, Wolfe LL, et al. Lions and prions and deer demise. Plos One. 2008;3:12.
- Gross JE, Miller MW. Chronic wasting disease in mule deer: disease dynamics and control. J Wildl Manag. 2001;65(2):205–215.
- Almberg ES, Cross PC, Johnson CJ, et al. Modeling routes of chronic wasting disease transmission: environmental prion persistence promotes deer population decline and extinction. Plos One. 2011;6:5.
- Seidl AF, Koontz SR. Potential economic impacts of chronic wasting disease in Colorado. Hum Dimensions Wildl. 2004;9(3):241–245.
- Bishop RC. The economic impacts of chronic wasting disease (CWD) in Wisconsin. Hum Dimensions Wildl. 2004;9(3):181–192.
- Novakofski J, Brewer MS, Mateus-Pinilla N, et al. Prion biology relevant to bovine spongiform encephalopathy. J Anim Sci. 2005;83(6):1455–1476.
- Aguilar-Calvo P, García C, Espinosa JC, et al. Prion and prion-like diseases in animals. Virus Res. 2015;207:82–93.
- Moore S, Kunkle R, Smith J, et al. Prion infectivity detected in swine challenged with chronic wasting disease via the intracerebral or oral route. Philadelphia (PA): Taylor & Francis; 2016. p. S117–S118.
- Mussil B, Motzkus D, Hesse G, et al. Transmission of CWD to non-human primates: interim results of a 6 year risk assessment study on the transmissibility to humans. Prion. 2015;9:S87–S87.
- Czub S, Schulz-Schaeffer W, Stahl-Hennig C, et al. Frist evidence of intracranial and peroral transmission of chronic wasting disease (CWD) into Cynomolgus macaques: a work in progress. In: International Conference Deciphering Neurodegenerative Disorders - Prion 2017. Edinburgh, Scotland: Prion; 2017. p. 23–26.
- Maryland Department of Natural Resources. Chronic wasting disease response plan 2015. Annapolis (MD): Maryland Department of Natural Resources; 2015. p. 1–11.
- Texas Parks and Wildlife Department, Texas Animal Health Commission. Chronic wasting disease management plan. Austin (TX): Texas Parks and Wildlife Department; March 2015. p. 1–17.
- Wyoming Game and Fish Department. Chronic wasting disease management plan. Cheyenne (Wyoming): Wyoming Game and Fish Department; 2006 Feb 17.
- Shelton P, McDonald P Illinois chronic wasting disease: 2014-2015 surveillance and management report; 2015 Sep 29. p. 1–17
- Shelton P, McDonald P Illinois chronic wasting disease: 2016-2017 surveillance and management report; 2017 Sep 5. p. 1–16.
- Manjerovic MB, Green ML, Mateus-Pinilla N, et al. The importance of localized culling in stabilizing chronic wasting disease prevalence in white-tailed deer populations. Prev Vet Med. 2014;113(1):139–145.
- Brandt AL, Kelly AC, Green ML, et al. Prion protein gene sequence and chronic wasting disease susceptibility in white-tailed deer (Odocoileus virginianus). Prion. 2015;9(6):449–462.
- Kelly AC, Mateus-Pinilla NE, Diffendorfer J, et al. Prion sequence polymorphisms and chronic wasting disease resistance in Illinois white-tailed deer (Odocoileus virginianus). Prion. 2008;2(1):28–36.
- Blanchong JA, Heisey DM, Scribner KT, et al. Genetic susceptibility to chronic wasting disease in free-ranging white-tailed deer: complement component C1q and Prnp polymorphisms. Infect Genet Evol. 2009;9(6):1329–1335.
- O’Rourke KI, Spraker TR, Hamburg LK, et al. Polymorphisms in the prion precursor functional gene but not the pseudogene are associated with susceptibility to chronic wasting disease in white-tailed deer. J Gen Virol. 2004;85(Pt 5):1339–1346.
- Johnson C, Johnson J, Vanderloo JP, et al. Prion protein polymorphisms in white-tailed deer influence susceptibility to chronic wasting disease. J Gen Virol. 2006;87:2109–2114.
- Johnson CJ, Herbst A, Duque-Velasquez C, et al. Prion protein polymorphisms affect chronic wasting disease progression. Plos One. 2011;6:3.
- Metcalf CJE, Ferrari M, Graham A, et al. Understanding herd immunity. Trends Immunol. 2015;36(12):753–755.
- Wilson GA, Nakada SM, Bollinger TK, et al. Polymorphisms at the PRNP gene influence susceptibility to chronic wasting disease in two species of deer (Odocoileus Spp.) in western Canada. J Toxicol Environ Health-Part a-Current Issues. 2009;72(17–18):1025–1029.
- Duan JB, Wainwright MS, Comeron JM, et al. Synonymous mutations in the human dopamine receptor D2 (DRD2) affect mRNA stability and synthesis of the receptor. Hum Mol Genet. 2003;12(3):205–216.
- Kudla G, Murray AW, Tollervey D, et al. Coding-sequence determinants of gene expression in Escherichia coli. Science. 2009;324(5924):255–258.
- Sauna ZE, Kimchi-Sarfaty C. Understanding the contribution of synonymous mutations to human disease. Nat Rev Genet. 2011;12(10):683–691.
- Biro JC. Coding nucleic acids are chaperons for protein folding: A novel theory of protein folding. Gene. 2013;515(2):249–257.
- Pereira RM, Mesquita P, Batista M, et al. Pereira MS and others. Doppel gene polymorphisms in Portuguese sheep breeds: insights on ram fertility. Anim Reprod Sci. 2009;114(1–3):157–166.
- Rivera NA, Novakofski J, Weng H-Y, et al. Metals in obex and retropharyngeal lymph nodes of Illinois white-tailed deer and their variations associated with CWD status. Prion. 2015;9(1):48–58.
- O’Hara Ruiz M, Kelly AC, Brown M, et al. Influence of landscape factors and management decisions on spatial and temporal patterns of the transmission of chronic wasting disease in white-tailed deer. Geospat Health. 2013;8(1):215–227.
- Baylis M, Goldmann W. The genetics of scrapie in sheep and goats. Curr Mol Med. 2004;4(4):385–396.
- Roden JA, Nieuwhof GJ, Bishop SC, et al. Breeding programmes for TSE resistance in British sheep - I. Assessing the impact on prion protein (PrP) genotype frequencies. Prev Vet Med. 2006;73(1):1–16.
- Green ML, Manjerovic MB, Mateus-Pinilla N, et al. Genetic assignment tests reveal dispersal of white-tailed deer: implications for chronic wasting disease. J Mammal. 2014;95(3):646–654.
- Kelly AC, Mateus-Pinilla NE, Brown W, et al. Genetic assessment of environmental features that influence deer dispersal: implications for prion-infected populations. Popul Ecol. 2014;56(2):327–340.
- Cheng YC, Musiani M, Cavedon M, et al. High prevalence of prion protein genotype associated with resistance to chronic wasting disease in one Alberta woodland caribou population. Prion. 2017;11(2):136–142.
- Dorak SJ, Green ML, Wander MM, et al. Clay content and pH: soil characteristic associations with the persistent presence of chronic wasting disease in northern Illinois. Sci Rep. 2017;7(1):18062.
- Joly DO, Ribic CA, Langenberg JA, et al. Chronic wasting disease in free-ranging Wisconsin white-tailed deer. Emerg Infect Dis. 2003;9(5):599–601.
- Blanchong JA, Samuel MD, Scribner KT, et al. Landscape genetics and the spatial distribution of chronic wasting disease. Biol Lett. 2008;4(1):130–133.
- Kelly AC, Mateus-Pinilla NE, Douglas M, et al. Utilizing disease surveillance to examine gene flow and dispersal in white-tailed deer. J Appl Ecol. 2010;47(6):1189–1198.
- Cullingham CI, Merrill EH, Pybus MJ, et al. Broad and fine‐scale genetic analysis of white‐tailed deer populations: estimating the relative risk of chronic wasting disease spread. Evol Appl. 2011;4(1):116–131.
- Joly DO, Samuel MD, Langenberg JA, et al. Spatial epidemiology of chronic wasting disease in Wisconsin white-tailed deer. J Wildl Dis. 2006;42(3):578–588.
- Osnas EE, Heisey DM, Rolley RE, et al. Spatial and temporal patterns of chronic wasting disease: fine-scale mapping of a wildlife epidemic in Wisconsin. Ecological Appl. 2009;19(5):1311–1322.
- Mateus-Pinilla N, Weng H-Y, Ruiz MO, et al. Evaluation of a wild white-tailed deer population management program for controlling chronic wasting disease in Illinois, 2003-2008. Prev Vet Med. 2013;110(3–4):541–548.
- Johnson C, Johnson J, Clayton M, et al. Prion protein gene heterogeneity in free-ranging white-tailed deer within the chronic wasting disease affected region of Wisconsin. J Wildl Dis. 2003;39(3):576–581.
- Hanke M, Direct WM. DNA sequencing of PCR-amplified vector inserts following enzymatic degradation of primer and dNTPs. BioTechniques. 1994;17(5):858.
- Tamura K, Stecher G, Peterson D, et al. MEGA6: molecular evolutionary genetics analysis version 6.0. Mol Biol Evol. 2013;30(12):2725–2729.
- Stephens M, Scheet P. Accounting for decay of linkage disequilibrium in haplotype inference and missing-data imputation. Am J Hum Genet. 2005;76(3):449–462.
- Stephens M, Smith NJ, Donnelly P. A new statistical method for haplotype reconstruction from population data. Am J Hum Genet. 2001;68(4):978–989.
- R Core Team. R: A Language and Environment for Statistical Computing. 3.0.0. Vienna (Austria): R Foundation for Statistical Computing; 2013.
- RStudio. RStudio: Integrated development environment for R 0.98.10832012.