
ABSTRACT
A rapid-acting insulin lispro and long-acting insulin glargine are commonly used for the treatment of diabetes. Clinical cases have described the formation of injectable amyloidosis with these insulin analogues, but their amyloid core regions of fibrils were unknown. To reveal these regions, we have analysed the hydrolyzates of insulin fibrils and its analogues using high-performance liquid chromatography and mass spectrometry methods and found that insulin and its analogues have almost identical amyloid core regions that intersect with the predicted amyloidogenic regions. The obtained results can be used to create new insulin analogues with a low ability to form fibrils.
Abbreviations
a.a., amino acid residues; HPLC-MS, high-performance liquid chromatography/mass spectrometry; m/z, mass-to-charge ratio; TEM, transmission electron microscopy.
Introduction
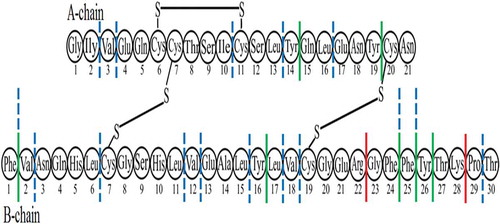
Insulin-derived amyloidosis is a disease characterized by the formation of amyloid fibril deposits in tissues and organs as a complication of diabetic therapy with insulin and its analogues [Citation1–Citation3]. The number of detected clinical cases has increased in recent years, and their prevalence may still be insufficiently diagnosed and underestimated [Citation4,Citation5]. Insulin amyloids have demonstrated toxicity in vivo [Citation6], and insulin-induced amyloidosis creates poor glycaemic control [Citation7,Citation8]. Many studies have proposed various structures of insulin amyloids and possible mechanisms of their formation [Citation9–Citation14]. As previously reported [Citation9,Citation15], changes in the insulin sequence by several amino acid residues (a.a) can lead to a significant difference in physicochemical properties, in particular, in the kinetics of the growth of amyloid fibrils. Therefore, considerable research efforts were aimed at identifying amyloidogenic sequences in the structure of insulin monomer [Citation16–Citation20]. The insulin monomer consists of two polypeptide chains (A and B) that are covalently linked by disulphide bonds. Insulin analogues are obtained by changing the amino acid composition of insulin to optimize the rate of action of hormones on blood glucose levels in patients with diabetes [Citation21,Citation22]. The effect of the amino acid sequence for the A and B insulin chains on amyloidogenesis can be compared with the data for the fast-acting insulin analogue lispro [Citation23] with inversion a.a. in the ProB28 LysB29 sequence and the long-acting insulin analogue glargine [Citation24] with two additional Arg residues at positions B31 and B32 and Gly residue instead of Asn at position A21. Lispro and glargine are increasingly used to treat of diabetes, as they are more effective than regular insulin [Citation25,Citation26]. At the same time, data on the amyloid core regions of lispro and glargine in comparison with such regions of insulin are not presented in the literature.
Today it is customary to distinguish classes of amyloid fibrils by their origin and importance for cell life, as well as human health [Citation27]. In addition, using several methods, for example, cryo-electron microscopy [Citation12], it was shown that there are polymorphic varieties of amyloid fibrils for the same protein, which also requires attention [Citation28–Citation32]. Different points of view on the amyloidogenic regions of insulin can be explained by fibril polymorphism and the lack of understanding of the individual stages of insulin amyloidogenesis. In this regard, it is of interest to identify amyloidogenic fragments that are responsible for the formation of the spine of insulin analogues fibrils.
Insulin is a useful model for studying the process of fibril formation due to the reproducibility of this process [Citation9,Citation12,Citation16]. It is known that insulin is a monomeric form in 20% acetic acid [Citation33], further exposure to acidic pH and increased temperature and ionic strength of the solution leads to aggregation and subsequent formation of fibrils [Citation34]. Since there are no methods for studying the process of insulin aggregation in vivo, the study of amyloid protein aggregation in vitro is an important scientific task. It is considered that short amino acid sequences in this protein, called amyloidogenic sites, are responsible for the tendency of a particular protein to form amyloids. As a rule, these sequences consist mainly of uncharged or polar a.a. To find such sites in any protein molecule, specialized computer programs were developed [Citation35].
Early, we used generally accepted bioinformatics approaches for predicting amyloidogenic sites in insulin and compared the obtained data with the limited proteolysis method in combination with tandem mass spectrometry [Citation20]. The aim of this work is to identify amyloid core regions for insulin analogues fibrils (lispro and glargine) and to compare with the data found for insulin. For this purpose, we used bioinformatics software to predict amyloidogenic regions in the protein chain along with experimental identification of regions in insulin fibrils and its analogues that are resistant to proteases. Amyloids are characterized by high resistance to chemical and physical influences, such as changes in pH, temperature, pressure, and protease treatment [Citation36–Citation40]. The latter property can be used in mass spectrometry analysis of amyloidogenic regions in insulin fibrils and its analogues using the method developed previously for this purpose [Citation41–Citation43]. Targeted action to the identified amyloidogenic sequences can significantly slow down or prevent amyloidogenesis [Citation44]. It should be noted that non-amyloidogenic protein sequences can also have a modulating effect on the rate of amyloid formation. For insulin and its analogues, changes in parameters such as the lag-time and the rate of exponential growth of fibrils can be monitored by the fluorescence of thioflavin T (ThT) [Citation45,Citation46]. Accordingly, analysing the kinetics of binding of thioflavin T to fibrils and electron microscopic images, we can draw conclusions about how changes in the sequence of insulin analogues are associated with changes in the kinetics of amyloid formation and the morphology of the obtained aggregates [Citation47].
Results
Bioinformatics analysis
Insulin analogues have only slight differences from insulin in the amino acid sequences. As described above, the inversion of a.a. was performed for lispro in positions B28 and B29. Glargine has two a.a. arginine at the C-terminus of the B-chain (B31, B32) and the asparagine residue (A21) is replaced by glycine in the A-chain. Therefore, it was important to take into account the possible small contribution of amino acid modifications of insulin analogues to their amyloidogenicity. For this reason, we used several bioinformatics tools (FoldAmyloid [Citation48], ArchCandy [Citation49], PASTA 2.0 [Citation50], Waltz [Citation51], AGGRESCAN [Citation52], and ZipperDB [Citation53,Citation54]) to predict amyloidogenic sequences in the structure of proteins. The results of predictions of amyloidogenic regions for the A and B chains of insulin and its analogues by various methods are shown in .
Table 1. Characteristics of the software used for identification of amyloidogenic regions and results of prediction for A and B chains of insulin, lispro, and glargine.
As can be seen from , there are no differences in the predictions of the amyloidogenic regions of the three proteins. This result can be explained by the fact that mutations in the insulin analogues were introduced outside the amyloidogenic regions, with the exception of the A10-A21 region (where asparagine at position A21 was substituted for glycine in glargine) predicted by the Waltz software.
Insulin, lispro, and glargine can form amyloids when these drugs are injected (injectable amyloidosis) [Citation55–Citation57]. However, the ArchCandy software did not identify amyloidogenic regions in the A and B chains, because the corresponding values of the scoring function of Si (0.408 and 0.564) are less than the threshold value, 0.578, which distinguishes between non-amyloidogenic and amyloidogenic sequences [Citation49]. Moreover, the insulin B chain can form fibrils [Citation58], but the PASTA 2.0 software did not predict amyloidogenic regions in the B chain of insulin and its analogues.
Therefore, amyloidogenic regions identified by any software as amyloidogenic ones are predicted within one amino acid residue, but there are no completely similar predictions between FoldAmyloid, ArchCandy, PASTA 2.0, Waltz, AGGRESCAN, and ZipperDB. However, the multiple alignments of amyloidogenic sequences help to identify the results predicted by at least two bioinformatics programs for the A chain (region A2-A16) and B chain (regions B1-B5, B7-B19 and B23-B27) in insulin and its analogues.
Thus, the results of bioinformatics analysis show that the predictions of the programs do not differ for the amyloidogenic amino acid sequences of insulin, lispro, and glargine. At the same time, most programs predict the presence of amyloidogenic regions for insulin and its analogues, and therefore, the ability to form amyloid fibrils for these proteins. In the future, before conducting an experimental verification of amyloidogenic regions in the structure of the fibril, we investigate the possibility of obtaining amyloid fibrils and their morphological features using thioflavin T fluorescence kinetics and transmission electron microscopy.
Insulin, lispro, and glargine fibrils have a similar morphology, but different lag-time fibril formation
The ThT fluorescence as a function of incubation time is presented in for samples of insulin, lispro and glargine [Citation9,Citation47]. The plot indicates that the increase in ThT fluorescence intensity for insulin and its analogues, follows the sigmoid pattern and look like a classical three-step graph – showing the lag-time (a delay before amyloid formation), elongation (exponential growth), and maturation phases of fibrillation (plateau stage). However, the lag-times for lispro and glargine are longer than for insulin samples. At the same time insulin analogues samples invariably form long unbranched smooth fibrils that widely laterally associate and have the same morphology in the images using transmission electron microscopy (TEM) (). Insulin analogues fibrils formed quiescently at pH 2.0, a period of 48 hours, and TEM showed that all the obtained fibrils were morphologically identical.
Figure 1. Normalized ThT fluorescence data for lag-time of the initial stage of insulin, lispro and glargine aggregation at a concentration of 2 mg/ml (a). Results are averages of three replicates per insulin type. Electron microscopic images obtained fibrils after 2880 min (48 hours) of incubation at 37°C (b). Preparations of insulin and its analogues were solved in 140 mM NaCl containing 20% (v/v) acetic acid (рН 2.0).
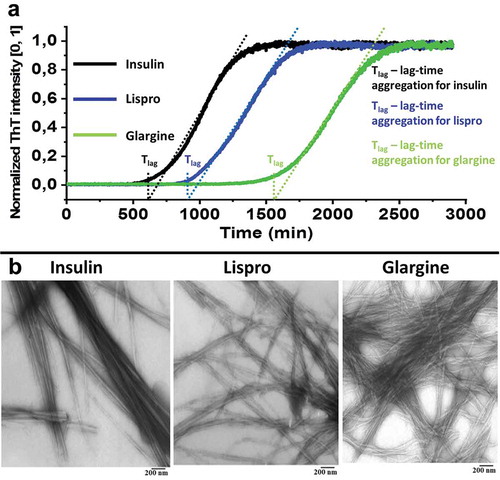
Thus, using electron microscopy, data were obtained showing that the differences between analogues and insulin are insignificant in morphological characteristics. Electron microscopy is one of the main direct methods for visualization of fibrils. However, this method does not allow the detection of amyloidogenic sequences in the structure of fibrils. Later, we used limited proteolysis and mass spectrometry to identify the amyloid core regions in the structure of insulin and its analogues fibrils.
Results of limited proteolysis and mass spectrometry
In order to determine amyloid core regions, that form the spine of fibrils, we hydrolysed fibrils with a mixture of proteases. After an 8-hour incubation of insulin fibrils and its analogues with a mixture of proteases, the cleaved regions of the protein chains were removed after centrifugation, and the pellet of protected regions of fibrils was prepared for analysis by HPLC-MS. This experimental procedure reliably separated fibrils and their fragments from fragments of non-aggregated proteins released into solution, and identified protein sequences that remained integrated into the spine of fibril.
The fibril hydrolyzates thus obtained were dissolved in concentrated formic acid. Formic acid was used to dissociate proteolysis-protected aggregates of protein monomeric fragments [Citation20]. The formylation reaction, the addition of formic acid residue to the N-terminus of protein fragments, was taken into account in the further analysis of ions in the mass spectra. Obtained protein fragments were analysed by LC-MS. Mass spectra were obtained every 1.2 s for all peptides released from the column. Mass chromatograms and some mass spectra are presented on . Mass spectra (from ) correspond to 68.44 min. of chromatogram.
Figure 2. Chromatograms (left) and panoramic mass spectra (right) of hydrolyzates of insulin (a), lispro (b), and glargine (c) fibrils obtained at the proteases to protein ratio 1:25, w/w. The retention time for the mass spectra of fibrils hydrolyzates is 68.44 min.
Ions 968.95 (+6), 1162.34 (+5), 1452.67 (+4) in the mass spectrum of insulin () correspond to a non-hydrolysed monomer with 5806.7 Da. For the spectra of lispro ions, 968.78 (+6), 1162.34 (+5), 1452.92 (+4) correspond to molecular masses of 5806.7 Da. Ions 758.74 (+8), 867.13 (+7), 1011.31 (+6), 1213.57 (+5), 1516.71 (+4) correspond to the whole glargine monomer sequence with 6062.4 Da (, on the right). It should be noted that peaks with m/z values corresponding to dimers of a non-hydrolysed protein were detected. These ions for insulin 1660.19 (+7), 1936.55 (+6), lispro 1660.33 (+7), 1936.89 (+6) and glargine 1733.39 (+7) are significantly inferior in relative intensity to protein monomers, which is also shown on . In general, the main contribution to the total ion current in all panoramic mass spectra was made by ions corresponding to non-hydrolysed protein monomers. The contribution of other peaks was one or two orders of magnitude lower, including for those ions that corresponded to shorter sequences of insulin and its analogues.
In the obtained mass chromatograms, no reliable peaks corresponding to protein fragments with molecular weight of 1.5–4.5 kDa were found. Multiply charged ions corresponding to non-hydrolysed protein sequences were predominant in the total ion current in the mass spectra, and only fragments with a molecular mass higher than 4.5 kDa and less than 1.5 kDa were reliably identified.
Non-hydrolysed monomers and some fragments (with mass from 4.5 and higher) of insulin, lispro, and glargine were found only in the spectra for hydrolysed fibrils described above. At the same time control experiments with monomeric proteins () contain small fragments (up to 2000 Da) predominantly.
Figure 3. Chromatograms (left) and panoramic mass spectra (right) of hydrolyzates containing no fibrils of insulin (a), lispro (b), and glargine (c) solutions obtained at the proteinases to protein ratio 1:25, w/w. The retention time for the mass spectra of proteins hydrolyzates is 68.44 min.
Significant ions (with ion intensity greater than 106) present in the fragmentation spectra of either fibril hydrolyzates or monomer hydrolyzates are listed in Table S1. Measured molecular weight can be reliably assigned to a single peptide fragment in most cases.
Double-stranded sequences were calculated; a minimal sequence has been proposed as the spine of fibrils for insulin, lispro, and glargine. As can be seen from Table S1, together with non-hydrolysed protein sequences, shorter double-stranded sequences for insulin, lispro, and glargine were identified. The resulting fragments have differences in the length between the proteins, which may be due to some variability in the action of proteases and structural features of fibrils. Peptide bonds in the insulin sequence (and its analogues) restricted by interchain disulphide S-S bonds are not hydrolysed in fibrils, and S-S bonds holding the A and B chains are preserved. In fact, the molecular weights of double-chain regions restricted by S-S bonds (3 kDa), as well as fragments of the A chain (2.4 kDa) and the B chain (3.4 kDa) were not identified in the products of hydrolysis of fibrils. In addition, dithiothreitol or 2-mercaptoethanol reducing agent was not used to break the S-S bonds when the fibrils and protein monomers were prepared for analysis by HPLC-MS. S-S bonds did not interfere with protease hydrolysis by peptide bonds in regions А6-А20 and В7-В19 for non-aggregated insulin and its analogues.
Discussions
Previous studies have not focused on whether there are significant differences in the ability of widely used rapid-acting and long-acting insulin analogues to form amyloids. In the present work, we showed using theoretical and experimental methods, that there can be no significant differences in the amyloidogenic regions between insulin, lispro, and glargine.
It is well known that an amino acid sequence of a protein largely determines its amyloidogenicity [Citation59]. Bioinformatics programs that use this principle to predict amyloidogenic regions work differently, so the results of their prediction are often different, but using these tools can help develop new peptides and proteins that are resistant to aggregation [Citation60]. On the other hand, it should be kept in mind that programs have their limitations and predictions may not always coincide with experimental data. Thus, the ArchCandy program, as the authors point out, cannot determine the amyloidogenicity of the human β2-microglobulin fragment, semen-derived enhancer of viral infection peptide, and calcitonin [Citation49]. On the other hand, the glulisine rapid-acting insulin analogue [Citation61] has a substitution at position B3, which leads to the fact that ZipperDB predicts the difference in the B-chain amyloidogenicity for glulisine (B7-B20) and insulin (B1-B20). That is, according to the predictions of the program, lower amyloidogenicity for this analogue can be expected. Indeed, there are currently no reported cases of injectable amyloidosis caused by glulisine [Citation2]. However, it should be noted that this analogue is able to form fibrils and is relatively recently launched into production [Citation62].
Insulin analogues differ in kinetic characteristics of aggregation from insulin that is shown in our paper and other works. Woods et al. studied lispro, aspart, glulisine and showed that glulisine and lispro aggregate more slowly than aspart in PBS and 3 mg/ml of each analogue with constant shaking at 37 or 45°C [Citation62]. Unfortunately, often the experimental conditions differ significantly from different authors, which creates certain difficulties in interpreting the results. In another study, Zhou et al. showed that lispro aggregates faster than glulisine and aspart without stirring at the same temperature of 37°C, but different buffer conditions were used for each analogue [Citation63]. Our data show that the insulin analogues form fibrils more slowly than insulin. This result can be explained by the fact that the stage of formation of oligomers is necessary for the formation of fibrils [Citation14,Citation42,Citation43]. How quickly such oligomers will form depends on both the conditions in the solution and the amino acid sequence of the protein monomer. The tendency to form amyloids will depend on the presence of amyloidogenic sites. At the same time, as we showed, for insulin, lispro, and glargine, no significant differences in the amyloidogenic sequence were revealed. Apparently, the slower rate of lispro fibrillation is due to the fact that this analogue has inversion of amino acids at positions B28 and B29, which destabilizes protein dimers and slows down the formation of oligomers [Citation14,Citation23,Citation47]. For glargine, amino acid modifications could also play a role in slowing fibrillation. Moreover, one substitution in glargine was made at position A21, which is vital for contacts of dimers. At the same time, the addition of two arginine residues to the C-terminus of the B chain could lead to inhibition of the aggregation process [Citation24,Citation64].
At the same time, the most reliable means of determining whether a peptide or protein forms amyloid fibrils is to use direct methods for visualizing fibrils, such as electron microscopy and atomic force microscopy [Citation14,Citation15,Citation47]. For example, for bovine insulin, Thr at position A8 is replaced with Ala, and there is another difference in the A chain, too – Ile at A10 is replaced with Val. The chain B contains differences at position B30: Thr is replaced by Ala [Citation15]. Morphological differences between human and bovine insulin are much more significant compared to the differences that we obtained for insulin analogues. Among the programs we use, none predicts significant differences in bovine insulin compared to human insulin. Meanwhile, there are a number of works in which it is noted that bovine insulin forms fibrils faster. Moreover, the replacement is at A8 that is responsible for this, and not at A10 or B30 [Citation9]. Thus, we see that protein sequence plays a key role in the tendency to form amyloids. Therefore, when developing new insulin analogues, it is necessary to take into account the effect of amino acid substitutions on the ability of the insulin analogue to form fibrils. Amyloidogenic regions can be detected using limited proteolysis and mass spectrometry of the resulting proteases resistant fragments.
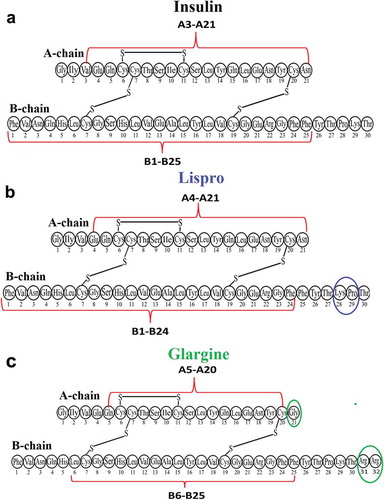
Based on the foregoing, comparing the results of HPLC-MS of two experiments with fibrils and non-aggregated forms of insulin and its analogues, we came to the conclusion that there should be double-stranded sequences with a molecular weight of at least 3 kDa and minimal sequences in the spine of fibrils protected from proteases A6-A20 and B7-B19 are limited to S-S bonds. As described above, non-hydrolysed sequences were predominant among the products of enzymatic hydrolysis of fibrils. According to electron microscopy images [Citation14,Citation47], insulin fibrils and its analogues are prone to the formation of associates, namely bundles and clusters consisting of separate thin fibrils. Therefore, it can be assumed that thin fibrils and their constituent monomers, which are located inside fibril associates, will be completely protected from the action of proteases and, therefore, not hydrolysed. However, building units of thin fibrils located separately or lying on the associated surface, although they will be exposed to proteases, they will retain the spine of the fibril, that is, the regions of monomer in contact with each other and containing amyloidogenic sequences. When associates of fibrils dominate over single fibrils, resistance to proteolysis sequences will prevail in the results of HPLC-MS analysis, as was observed in our experiments. On the other hand, the minimum protein fragments that are less common among fibril hydrolysis products containing sequences limited by interchain disulphide bonds will contain the proposed spine of the fibril. We found such double-chain fragments in fibrils of insulin (А3-А21, В1-В25), lispro (А4-А21, В1-В24), and glargine (А5-А20, В6-В25) in the mass spectra of fibril hydrolyzates. Some differences between the hydrolysis sites and the really obtained sequences can be explained by the non-specific activity of proteinase K. The common amyloid core regions for the three proteins protected from proteolysis are А5-А20 and В6-В24.
In general, we can say that despite the small differences in the spine of fibrils that we offer for insulin and its analogues, using mass spectrometry it was not possible to identify sequences that can be interpreted as amyloidogenic in the local sites of the amino acid modifications of lispro and glargine. Some polymorphism in the sequences can be explained by the non-specificity of the action of proteases, which was already noted in other works [Citation65,Citation66].
It should be emphasized that the sequences forming the spine of fibril and amyloidogenic fragments can be different. Amyloid aggregation can only be supported by part of a.a. located inside the identified double-chain sequences, corresponding to the spine of insulin and its analogues fibrils (see ).
Figure 4. Scheme plotted using the results of identification of amyloidogenic regions in the spine of insulin (a), lispro (b), and glargine (c) fibrils. The putative spine of fibril is shown by dashed lines. Coloured ovals show a.a. modifications of lispro and glargine.
Therefore, we compared the data obtained using both the bioinformatics and proteolysis analysis. The FoldAmyloid, PASTA 2.0, Waltz, AGGRESCAN, and ZipperDB programs predict the amyloidogenic regions in the A-chain (A2-A16) and B chain (B1-B5, B7-B19, and B23-B27). Two fragments, А5-А16 and В7-В19, are common ones for theoretical and experimental analysis. It can be assumed that the interactions of these sequences trigger amyloidogenic aggregation and formation of insulin fibrils and its analogues. Accordingly, upon aggregation of these regions, S-S bonds become inaccessible for proteolysis, which explains the results of fibril proteolysis.
The consensus sequences obtained in this study, which represent collaborative bioinformatics and limited proteolysis data, represent promising goals for the further development of insulin analogues. Modification of the amino acid composition of insulin within the framework of sequences A5-A20, B6-B24 is of great interest. Therefore, in a recent work, the replacement of A-chain cysteines with selenocysteines has reduced the tendency to aggregation of the insulin A chain [Citation67].
It should be noted that for the different bioinformatics programs there are no identical predictions, and for the mass spectrometric method of analysis there can be no identical data for different proteins, since it is obvious that it is difficult to choose the conditions when the proteases work in exactly the same way. Our data are only partially consistent with the results of other researchers. For example, this was reported in the paper of Ivanova et al. [Citation16] the minimal segment with sequence LVEALYL (B11-B17) that can alter the rate of insulin fibril formation, both nucleates and inhibits the fibrillation of full-length insulin.This fragment is well compatible with one of the predicted amyloidogenic regions – B7-B19. Our data show that an integrated approach combining theoretical and experimental methods for studying the formation of fibrils can be effective for revealing the structural properties of fibrils [Citation68]. These results do not contradict the fibrillogenesis model proposed in [Citation14,Citation22].
To control amyloid formation and inhibit the growth of fibrils, on the one hand, various low-molecular substances are used, for example, urea [Citation69] and vanillin [Citation70], and on the other hand, cyclodextrins [Citation71], chaperons, and proteins with chaperon-like activity [Citation72]. But the mechanism of such inhibition remains unclear, as do the amino acid sequences involved in intermolecular interactions. Information about the amyloidogenic regions in the structure of amyloid fibril will allow direct selection of low molecular weight drugs that prevent the formation of amyloid oligomers and fibrils. The identification of amyloidogenic regions for insulin and its analogues will help to clarify the fibril formation model and develop new pharmacological preparations resistant to amyloid aggregation over a long period of time, which is vital for the treatment of insulin-dependent diabetes mellitus.
Studying the process of insulin fibrillation in the 1940–50ss, first Waugh et al. [Citation73] and then Koltun et al. [Citation74] suggested that fibrils are constructed from slightly modified native insulin molecules. However, based on measurements of infrared dichroism, Ambrose and Eliott [Citation75] decided that fibrils are assembled from polypeptide chains that are in the β-conformation and extend across the axis of the fibrils (i.e., cross-β structure). However, the different structure of fibrils and possible mechanisms of their formation were unknown and were proposed later [Citation9–Citation14]. In 1997, Brange et al. revealed that desoctapeptide insulin (B23-B30) is able to form fibrils and, at the same time, residues A2, A3, B11, and B15 are important in the fibrillation process [Citation76]. Subsequently, Sawaya et al. identified and crystallized two fibril-forming insulin sequences A13–A18 and B12–B17 [Citation77]. Structural polymorphism probably leads to various surface patterns having different intra- or inter-residue arrangements [Citation78]. Chiang et al. suggested that, in addition to the B11–B17 fragment, the B22-B27 sequence can also modulate fibril growth [Citation79]. In terms of finding the smallest amyloidogenic sequence, Swiontek et al. showed that the shortest components of A13-A19, B12-B17 fragments, which contained the amino acid residues H-LeuTyr-OH (A13-A14) and H-TyrLeu-OH (B16-B17), were able to form fibrils [Citation19]. Thus, there is no consensus on the number of amyloidogenic fragments of insulin and their amino acid sequences. Different viewpoints on the amyloidogenic regions of insulin can be explained by fibril polymorphism and the lack of understanding of the individual stages of the insulin amyloidogenesis. However, the methods used in the previous studies do not generate information about the amino acid sequences of an insulin molecule that are involved in the intermolecular interactions during the formation of fibrils. Using the mass spectrometry analysis, we are the first to determine the regions of insulin and its analogous protected from the action of proteases. It turns out that most of the insulin sequence and its analogous are protected inside the fibrils: A5-A20 and B6-B24. Thus, it is difficult to talk about a defined amyloid core, which is usually regarded as a shorter spine. A5-A20 and B6-B24 are those regions that correspond to sequences located within the double-stranded fragments. This sequence can be suggested as the minimum double-stranded sequence responsible for the aggregation of full-sized insulin and its analogues. The fragments common to the theoretical and experimental analysis: A6-A16 and B7-B19 are likely to form fibrils. It should be noted that the entire peptide/protein and short amyloidogenic peptides behave differently, forming different morphological structures, as we showed by the example of the Aβ peptide and its amyloidogenic fragments [Citation42,Citation43,Citation80].
The identified amyloidogenic regions (А5-А20 and В6-В24) can be used as target sites for controlling aggregation in the creation of new insulin analogues. It is logical to use those amino acid residues that are not important for interaction with the insulin receptor for the purpose of modifying and acting of inhibitors. It was previously shown that Gly A1–Glu A4, Tyr A19, Asn A21, Gly B8, Ser B9, Leu B11, Val B12, Tyr B16, Phe B24, Phe B25, and Tyr B26 are important amino acid residues for interaction with the insulin receptor [Citation81]. In order to increase the lag-time of amyloid formation, it is necessary to take into account not only amyloidogenic regions, but also regions that do not form the core of fibrils.
Materials and methods
Software for prediction of amyloidogenic regions in protein chains
To predict the amyloidogenic regions in insulin, we used the A and B chains available in the FASTA format in the UniProt database (www.uniprot.org) as P01308 (INS_HUMAN) (www.uniprot.org/uniprot/P01308). The amino acid sequences of lispro and glargine, designated as DB00046 and DB00047, were taken from the DrugBank database (www.drugbank.ca).
We used the default software setting recommended by FoldAmyloid [Citation48], ArchCandy [Citation49], PASTA 2.0 [Citation50], Waltz [Citation51], AGGRESCAN [Citation52], and ZipperDB [Citation53,Citation54] for theoretical identification of amyloidogenic regions in the structure of insulin and its analogues.
The expected packing density of a.a. and the probability of hydrogen bond formation are used as the basis for predicting amyloidogenic regions in FoldAmyloid. Amino acid residues having a threshold value above 21.4 for five consecutive residues are considered as hits [Citation48].
ArchCandy is a bioinformatics approach based on the assumptions that most parts of amyloid fibrils contain common structural elements β-arches [Citation49]. To assess the probability that a certain sequence will fold in the β-arch, the authors created the scoring function Si, which reflects specific interactions during the formation of β-arches. The results of software testing on amyloidogenic/non-amyloidogenic regions and the comparison with other software allowed the authors to determine the threshold value of 0.578 for the scoring function, above which the sequence can be considered as amyloidogenic [Citation49].
PASTA is other software based on the idea that the mechanisms and basic molecular interactions that control the formation of β-sheets in native proteins are also preserved during self-assembly of β-sheets in amyloid aggregates, for example, the cross-β structure. PASTA 2.0 is based on the same principles as PASTA, but on a more experimental database [Citation82]. Peptide sequences are identified as ‘hot spots’ if their energy value is below the default threshold of −5 [Citation50].
The Waltz software allows the user to distinguish true amyloids from amorphous aggregates. A comparison of the hexapeptide database made it possible to establish a relationship between the sequence and tendency of individual peptides to form amyloids. Amyloidogenic regions with threshold values above 0 are considered hits [Citation51].
The authors of the AGGRESCAN software also used an approach based on their experimental data to develop an algorithm for identifying the aggregation properties of individual a.a. Amyloidogenic regions with average values of the amino-acid tendency to aggregate in excess of −0.02 are considered as hot spots [Citation52].
ZipperDB is a program that calculates the tendency to fibrillate using the structural algorithm originally described by Thompson et al. [Citation53]. This program uses an algorithm to insert a hexapeptide into the structure of NNQQNY fibrils from the sup35 prion protein Saccharomyces cerevisiae [Citation83]. Peptide compliance was evaluated using the RosettaDesign program [Citation84]. It should be noted that cysteines, such a.a. involved in the formation of disulphide bonds, have been replaced by serines to simplify the modelling. In addition, the quality of the ‘steriс zipper’ interface is compared in terms of complementarity of shape and surface area with other amyloid-like peptides reported by Sawaya et al. [Citation77]. Hexapeptides from the analysed sequence with a threshold energy value of less than −23 kcal/mol are considered to be highly prone to fibrillation.
Preparation of samples of insulin and its analogues
Researchers from Joint-Stock Company ‘BIORAN Scientific Production Corporation’ and M. M. Shemyakin and Yu. A. Ovchinnikov Institute of Bioorganic Chemistry, Russian Federation, purified and kindly gifted zinc-free preparations of insulin, lispro, and glargine to us. Proteins were dissolved in a buffer solution containing 20% acetic acid and 140 mM NaCl, pH 2.0 for the subsequent formation of fibrils, centrifuged at 10°C for 5 min and filtered through a 0.22 μm Millex-GP syringe filter (Merck Millipore, USA). The buffer of 100 mM NH4HCO3, pH 7.5, was used to work with trypsin and chymotrypsin proteases (Sigma-Aldrich, Germany). For proteinase K (AppliChem, USA), 5 mM CaCl2 was included in the buffer solution. A Cary 100 spectrophotometer (Varian, USA) was used to determine the concentrations of insulin preparations and its analogues. Protein concentration was estimated by absorption at 280 nm and an extinction coefficient of Ɛ280 nm = 1.0 ml·mg−1·cm−1 [Citation85]. Amyloid fibrils were formed by incubation of proteins (insulin, lispro, and glargine) at a concentration of 2 mg/ml at a temperature of 37°C after 48 hours.
Thioflavine T fluorescence assay
Fibrils growth was monitored on the basis of thioflavine T (ThT) fluorescence. The kinetics of aggregation of insulin and its analogues was studied by us using the method of fluorescence spectroscopy as described previously [Citation47]. Each assay was done in triplicate. The plot of each kinetic was obtained as the average of multiple results measured at different time intervals.
Transmission electron microscopy
The presence of amyloid fibrils in the test samples was monitored by transmission electron microscopy (TEM). Negatively stained sample grids were prepared by adding 5 μl of sample solution (2 mg/ml concentration) to copper grids with a Formvar film by precipitation and contrast with a 1% uranyl acetate solution. Photomicrographs were obtained on a JEM-100 C (JEOL, Japan) transmission electron microscope at an accelerating voltage of 80 kV.
Proteolytic hydrolysis of proteins
To identify areas of the spine of fibrils that are protected from the action of proteases, the preparations were separately prepared for the proteolysis of fibrils and non-aggregated proteins (insulin, lispro, and glargine). Amyloid fibrils were obtained by incubation of proteins at a concentration 2 mg/ml at 37°C for 48 hours in a buffer solution containing 140 mM NaCl, 20% (v/v) acetic acid (рН 2.0). The aggregates were precipitated by centrifugation for 20 min at 10,000 rpm in an Eppendorf 5418 R centrifuge (Eppendorf, Germany), and the fibrils were washed twice with the buffer solution containing 100 mM NH4HCO3, pH 7.5. Trypsin, chymotrypsin, and proteinase K preparations were dissolved in the buffer (100 mM NH4HCO3, pH 7.5, 5 mM CaCl2) with fibrils to concentrations of 0.0267 mg/ml for each protease, the total ratio of proteases to protein was 1:25 (w/w). Fibrils with the solution of proteases were incubated for 8 h at 37°C. Proteolysis was stopped by adding concentrated formic acid to the solution (1:50, v/v). The fibrils were centrifuged for 20 min at 10,000 rpm in an Eppendorf 5418 R centrifuge (Eppendorf, Germany), and washed twice with a buffer solution containing 100 mM NH4HCO3, pH 7.5. The pellets were dissolved in concentrated formic acid (0.2 ml) and dried using an Eppendorf 5301 vacuum concentrator (Eppendorf, Germany). The proteins are hydrolysed to short peptides or individual amino acids upon hours-long incubation with trypsin, chymotrypsin, and proteinase K under operating conditions (see ).
Figure 5. Potential sites of hydrolysis of peptide bonds in the lispro monomer with three proteases. Red lines show bonds specifically hydrolysed with trypsin. Green lines indicate the bonds specifically hydrolysed with chymotrypsin. Blue dash-and-dot lines show sites of predominant peptide bond cleavage with proteinase K.
To control the results obtained for proteolysis of fibrils, the proteins at a concentration of 2 mg/ml were immediately dissolved in a buffer solution containing 100 mM NH4HCO3, pH 7.5. The concentration of proteases and incubation conditions were the same as described above for fibrils. After stopping the proteolysis reaction, the hydrolyzates of non-aggregated proteins were dried, dissolved in concentrated formic acid (0.2 ml), and again dried in a vacuum concentrator Eppendorf 5301 (Eppendorf, Germany). The lyophilized hydrolyzates were used for reversed-phase liquid chromatography and mass spectrometry analysis.
HPLC-MS
To purify the samples treated with proteases filtration was carried out through ZipTips (Millipore, USA). Protein hydrolyzates were concentrated on a pre-column Acclaim PepMap 100 C18 LC (5 μm particle size, 100 Å pore size, 300 μm inner diameter x 5 mm length) and separated on an analytical column Acclaim PepMap RSLC (2 μm particle size, 100 Å pore size, 75 μm inner diameter x 150 mm length) (Thermo Scientific, USA) using nanoflow liquid chromatograph EASY nLC 1000 (Thermo Scientific, USA). A high-performance mass spectrometer an Orbitrap Elite (Thermo Scientific, Germany) was used as a detector. Panoramic spectra were recorded in the mass range m/z 300–2000 at resolution 60,000; ion fragmentation was performed in an HCD cell; the fragmentation spectra were recorded at resolution 15,000. Statistical analysis and processing of the obtained data were performed using the Xcalibur software (Thermo Scientific, USA) and PEAKS Studio 7.5 (Bioinformatics Solution Inc., Canada). Ions for which the automatically measured intensity exceeded 106 were analysed. The PeptideMass [Citation86] and FindPept [Citation87] (ExPASy) tools were used additionally to determine the identity of protein fragment by comparing predicted and actual masses.
Disclosure of potential conflicts of interest
No potential conflicts of interest were disclosed.
Supplemental Material
Download MS Word (28.2 KB)Acknowledgments
This work was carried out as part of the state task “Bioinformatics and proteomics studies of proteins and their complexes” № 0115-2019-004. Mass spectrometry measurements were carried out by facilities of the Center for Collective Employment for mass spectrometry of IPR RAS (584307). We thank O.M. Selivanova for assistance in the electron microscopic images for the manuscript preparation ().
Disclosure statement
No potential conflict of interest was reported by the authors.
Supplementary material
Supplemental data for this article can be accessed here.
References
- D’Souza A, Theis JD, Vrana JA, et al. Pharmaceutical amyloidosis associated with subcutaneous insulin and enfuvirtide administration. Amyloid. 2014;21(2):71–75. .
- Nilsson MR. Insulin amyloid at injection sites of patients with diabetes. Amyloid. 2016;23(3):139–147.
- Mayhew JM, Alan T, Kalidindi V, et al. Isolated insulin-derived amyloidoma of the breast. BMJ Case Rep. 2017;2017:219491.
- Nagase T, Iwaya K, Zako T, et al. Clinical and MRI characteristics and follow-up studies of insulin-derived amyloidosis. Amyloid. 2019;26:156–157.
- Ansari AM, Osmani L, Matsangos AE, et al. Current insight in the localized insulin-derived amyloidosis (LIDA): clinico-pathological characteristics and differential diagnosis. Pathol - Res Pract. 2017;213:1237–1241.
- Iwaya K, Zako T, Fukunaga J, et al. Toxicity of insulin-derived amyloidosis: a case report. BMC Endocr Disord. 2019;19:61.
- Nakamura M, Misumi Y, Nomura T, et al. Extreme adhesion activity of amyloid fibrils induces subcutaneous insulin resistance. Diabetes. 2019;68:609–616.
- Gupta Y, Singla G, Singla R. Insulin-derived amyloidosis. Indian J Endocrinol Metab. 2015;19:174–177.
- Nielsen L, Frokjaer S, Brange J, et al. Probing the mechanism of insulin fibril formation with insulin mutants. Biochemistry. 2001;40:8397–8409.
- Ahmad A, Millett IS, Doniach S, et al. Partially folded intermediates in insulin fibrillation. Biochemistry. 2003;42:11404–11416.
- Vestergaard B, Groenning M, Roessle M, et al. A helical structural nucleus is the primary elongating unit of insulin amyloid fibrils. PLoS Biol. 2007;5:e134.
- Jiménez JL, Nettleton EJ, Bouchard M, et al. The protofilament structure of insulin amyloid fibrils. Proc Natl Acad Sci USA. 2002;99:9196–9201.
- Kajava AV, Baxa U, Steven AC. β arcades: recurring motifs in naturally occurring and disease-related amyloid fibrils. Faseb J. 2010;24:1311–1319.
- Selivanova OM, Suvorina MY, Surin AK, et al. Insulin and lispro insulin: what is common and different in their behavior? Curr Protein Pept Sci. 2017;18:57–64.
- McBride SA, Tilger CF, Sanford SP, et al. Comparison of human and bovine insulin amyloidogenesis under uniform shear. J Phys Chem B. 2015;119:10426–10433.
- Ivanova MI, Sievers SA, Sawaya MR, et al. Molecular basis for insulin fibril assembly. Proc Natl Acad Sci. 2009;106:18990–18995.
- Kurouski D, Washington J, Ozbil M, et al. Disulfide bridges remain intact while native insulin converts into amyloid fibrils. PLoS One. 2012;7:e36989.
- Berhanu WM, Masunov AE. Controlling the aggregation and rate of release in order to improve insulin formulation: molecular dynamics study of full-length insulin amyloid oligomer models. J Mol Model. 2012;18:1129–1142.
- Swiontek M, Rozniakowski K, Fraczyk J, et al. The quest for the shortest fragments of A (13-19) and B (12-17) responsible for the aggregation of human insulin. Nanomedicine (Lond). 2016;11:2083–2101.
- Surin AK, Grishin SY, Galzitskaya OV. Identification of amyloidogenic regions in the spine of insulin fibrils. Biochemistry (Mosc). 2019;84:47–55.
- Home PD. The pharmacokinetics and pharmacodynamics of rapid-acting insulin analogues and their clinical consequences. Diabetes Obes Metab. 2012;14:780–788.
- Selivanova OM, Grishin SY, A V G, et al. Analysis of insulin analogs and the strategy of their further development. Biochemistry (Mosc). 2018;83:146–162.
- Howey DC, Bowsher RR, Brunelle RL, et al. [Lys(B28), Pro(B29)]-human insulin. A rapidly absorbed analogue of human insulin. Diabetes. 1994;43:396–402.
- Barnett AH. Insulin glargine in the treatment of type 1 and type 2 diabetes. Vasc Health Risk Manag. 2006;2:59–67.
- Ashwell SG, Amiel SA, Bilous RW, et al. Improved glycaemic control with insulin glargine plus insulin lispro: a multicentre, randomized, cross-over trial in people with Type 1 diabetes. Diabet Med. 2006;23:285–292.
- Candido R, Wyne K, Romoli E. A review of basal-bolus therapy using insulin glargine and insulin lispro in the management of diabetes mellitus. Diabetes Ther. 2018;9:927–949.
- Benson MD, Buxbaum JN, Eisenberg DS, et al. Amyloid nomenclature 2018: recommendations by the International Society of Amyloidosis (ISA) nomenclature committee. Amyloid. 2018;25:215–219.
- Makin OS, Serpell LC. Structures for amyloid fibrils. Febs J. 2005;272:5950–5961.
- Maji SK, Wang L, Greenwald J, et al. Structure-activity relationship of amyloid fibrils. FEBS Lett. 2009;583:2610–2617.
- Tycko R. Physical and structural basis for polymorphism in amyloid fibrils. Protein Sci. 2014;23:1528–1539.
- Selivanova OM, Galzitskaya OV. Structural polymorphism and possible pathways of amyloid fibril formation on the example of insulin protein. Biochemistry (Mosc). 2012;77:1237–1247.
- Sneideris T, Darguzis D, Botyriute A, et al. pH-driven polymorphism of insulin amyloid-like fibrils. PLoS One. 2015;10:e0136602.
- Ahmad A, Uversky VN, Hong D, et al. Early events in the fibrillation of monomeric insulin. J Biol Chem. 2005;280:42669–42675.
- Hua QX, Weiss MA. Mechanism of insulin fibrillation: the structure of insulin under amyloidogenic conditions resembles a protein-folding intermediate. J Biol Chem. 2004;279:21449–21460.
- Meric G, Robinson AS, Roberts CJ. Driving forces for nonnative protein aggregation and approaches to predict aggregation-prone regions. Annu Rev Chem Biomol Eng. 2017;8:139–159.
- Iconomidou VA, Vriend G, Hamodrakas SJ. Amyloids protect the silkmoth oocyte and embryo. FEBS Lett. 2000;479:141–145.
- Meersman F, Dobson CM. Probing the pressure–temperature stability of amyloid fibrils provides new insights into their molecular properties. Biochim Biophys Acta - Proteins Proteomics. 2006;1764:452–460.
- Malisauskas M, Weise C, Yanamandra K, et al. Lability landscape and protease resistance of human insulin amyloid: a new insight into its molecular properties. J Mol Biol. 2010;396:60–74.
- Piejko M, Dec R, Babenko V, et al. Highly amyloidogenic two-chain peptide fragments are released upon partial digestion of insulin with pepsin. J Biol Chem. 2015;290:5947–5958.
- Surin AK, Grigorashvili EI, Suvorina MY, et al. Determination of Regions Involved in Amyloid Fibril Formation for Aβ(1-40) Peptide. Biochemistry (Mosc). 2016;81:762–769.
- Grigorashvili EI, Selivanova OM, Dovidchenko NV, et al. Determination of size of folding nuclei of fibrils formed from recombinant Aβ(1-40) peptide. Biochemistry (Mosc). 2016;81:538–547.
- Selivanova OM, Surin AK, Marchenkov VV, et al. The mechanism underlying amyloid polymorphism is opened for Alzheimer’s disease amyloid-β peptide. J Alzheimers Dis. 2016;54:821–830.
- Galzitskaya OV, Selivanova OM. Rosetta Stone for Amyloid Fibrils: the key role of ring-like oligomers in amyloidogenesis. J Alzheimer’s Dis. 2017;59:785–795.
- Pastor MT, Esteras-Chopo A, Serrano L. Hacking the code of amyloid formation. Prion. 2007;1:9–14.
- Galzitskaya OV, Dovidchenko NV, Selivanova OM. Kinetics of amyloid formation by different proteins and peptides: polymorphism and sizes of folding nuclei of fibrils. InTech. 2016;5:145–166.
- Knowles TPJ, Waudby CA, Devlin GL, et al. An analytical solution to the kinetics of breakable filament assembly. Science. 2009;326:1533–1537.
- Selivanova OM, Suvorina MY, Dovidchenko NV, et al. How to determine the size of folding nuclei of protofibrils from the concentration dependence of the rate and lag-time of aggregation. II. Experimental application for insulin and LysPro insulin: aggregation morphology, kinetics, and sizes of nuclei. J Phys Chem B. 2014;118:1198–1206.
- Garbuzynskiy SO, Lobanov MY, Galzitskaya OV. FoldAmyloid: a method of prediction of amyloidogenic regions from protein sequence. Bioinformatics. 2010;26:326–332.
- Ahmed AB, Znassi N, M-T C, et al. A structure-based approach to predict predisposition to amyloidosis. Alzheimer’s Dement. 2015;11:681–690.
- Trovato A, Seno F, Tosatto SCE. The PASTA server for protein aggregation prediction. Protein Eng Des Sel. 2007;20:521–523.
- Maurer-Stroh S, Debulpaep M, Kuemmerer N, et al. Exploring the sequence determinants of amyloid structure using position-specific scoring matrices. Nat Methods. 2010;7:237–242.
- Conchillo-Solé O, de Groot NS, Avilés FX, et al. AGGRESCAN: a server for the prediction and evaluation of “hot spots” of aggregation in polypeptides. BMC Bioinformatics. 2007;8:65.
- Thompson MJ, Sievers SA, Karanicolas J, et al. The 3D profile method for identifying fibril-forming segments of proteins. Proc Natl Acad Sci. 2006;103:4074–4078.
- Goldschmidt L, Teng PK, Riek R, et al. Identifying the amylome, proteins capable of forming amyloid-like fibrils. Proc Natl Acad Sci. 2010;107:3487–3492.
- Nagase T, Iwaya K, Iwaki Y, et al. Insulin-derived amyloidosis and poor glycemic control: A Case Series. Am J Med. 2014;127:450–454.
- Hagiwara S, Taneda S, Fukumoto T, et al. Localized subcutaneous insulin-derived amyloidosis excised after evaluation using ultrasonography in a patient with type 2 diabetes mellitus. Case Rep Endocrinol. 2017;2017:3985214.
- Nakamura M, Misumi Y, Nomura T, et al. Extreme adhesion activity of amyloid fibrils induces subcutaneous insulin resistance. Diabetes. 2018;db180846.
- Devlin GL, Knowles TPJ, Squires A, et al. The component polypeptide chains of bovine insulin nucleate or inhibit aggregation of the parent protein in a conformation-dependent manner. J Mol Biol. 2006;360:497–509.
- DuBay KF, Pawar AP, Chiti F, et al. Prediction of the absolute aggregation rates of amyloidogenic polypeptide chains. J Mol Biol. 2004;341:1317–1326.
- Gil-Garcia M, Bañó-Polo M, Varejão N, et al. Combining structural aggregation propensity and stability predictions to redesign protein solubility. Mol Pharm. 2018;15:3846–3859.
- Rakatzi I, Seipke G, Eckel J. [LysB3, GluB29] insulin: a novel insulin analog with enhanced β-cell protective action. Biochem Biophys Res Commun. 2003;310:852–859.
- Woods RJ, Alarcón J, McVey E, et al. Intrinsic fibrillation of fast-acting insulin analogs. J Diabetes Sci Technol. 2012;6:265–276.
- Zhou C, Qi W, Lewis EN, et al. Characterization of sizes of aggregates of insulin analogs and the conformations of the constituent protein molecules: a concomitant dynamic light scattering and raman spectroscopy study. J Pharm Sci. 2016;105:551–558.
- Haghighi-Poodeh S, Kurganov B, Navidpour L, et al. Characterization of arginine preventive effect on heat-induced aggregation of insulin. Int J Biol Macromol. 2020;145:1039–1048.
- Katina NS, Suvorina MY, Grigorashvili EI, et al. Identification of regions in apomyoglobin that form intermolecular interactions in amyloid aggregates using high-performance mass spectrometry. J Anal Chem. 2017;72:1271–1279.
- Davis PJ, Holmes D, Waltho JP, et al. Limited proteolysis reveals that amyloids from the 3d domain-swapping cystatin b have a non-native β-sheet topology. J Mol Biol. 2015;427:2418–2434.
- Weil‐Ktorza O, Rege N, Lansky S, et al. Substitution of an internal disulfide bridge with a diselenide enhances both foldability and stability of human insulin. Chem - A Eur J. 2019;201900892.
- Yao ZP, Zeng ZH, Li HM, et al. Structure of an insulin dimer in an orthorhombic crystal: the structure analysis of a human insulin mutant (B9 Ser→Glu). Acta Crystallogr Sect D Biol Crystallogr. 1999;55:1524–1532.
- Nielsen L, Khurana R, Coats A, et al. Effect of environmental factors on the kinetics of insulin fibril formation: elucidation of the molecular mechanism. Biochemistry. 2001;40:6036–6046.
- Iannuzzi C, Borriello M, Irace G, et al. Vanillin affects amyloid aggregation and non-enzymatic glycation in human insulin. Sci Rep. 2017;7:15086.
- Kitagawa K, Misumi Y, Ueda M, et al. Inhibition of insulin amyloid fibril formation by cyclodextrins. Amyloid. 2015;22:181–186.
- Librizzi F, Carrotta R, Spigolon D, et al. α-casein inhibits insulin amyloid formation by preventing the onset of secondary nucleation processes. J Phys Chem Lett. 2014;5:3043–3048.
- Waugh DF, Wilhelmson DF, Commerford SL, et al. Studies of the nucleation and growth reactions of selected types of insulin fibrils. J Am Chem Soc. 1953;75:2592–2600.
- Koltun WL, Waugh DF, Bear RS. An X-Ray diffraction investigation of selected types of insulin fibrils. J Am Chem Soc. 1954;76:413–417.
- Ambrose EJ, Elliott A. Infra-red spectroscopic studies of globular protein structure. Proc R Soc London Ser A Math Phys Sci. 1951;208:75–90.
- Brange J, Andersen L, Laursen ED, et al. Toward understanding insulin fibrillation. J Pharm Sci. 1997;86:517–525.
- Sawaya MR, Sambashivan S, Nelson R, et al. Atomic structures of amyloid cross-beta spines reveal varied steric zippers. Nature. 2007;447:453–457.
- Sereda V, Sawaya MR, Lednev IK. Structural organization of insulin fibrils based on polarized raman spectroscopy: evaluation of existing models. J Am Chem Soc. 2015;137:11312–11320.
- Chiang H-L, Ngo ST, Chen C-J, et al. Oligomerization of peptides LVEALYL and RGFFYT and their binding affinity to insulin. PLoS One. 2013;8:e65358.
- Selivanova OM, Surin AK, Ryzhykau YL, et al. To be fibrils or to be nanofilms? Oligomers are building blocks for fibril and nanofilm formation of fragments of Aβ peptide. Langmuir. 2018;34(6):2332–2343.
- Gutmann T, Schäfer IB, Poojari C, et al. Cryo-EM structure of the complete and ligand-saturated insulin receptor ectodomain. J Cell Biol. 2020;219:e201907210.
- Walsh I, Seno F, Tosatto SCE, et al. PASTA 2.0: an improved server for protein aggregation prediction. Nucleic Acids Res. 2014;42:W301–7.
- Nelson R, Sawaya MR, Balbirnie M, et al. Structure of the cross-β spine of amyloid-like fibrils. Nature. 2005;435:773–778.
- Kuhlman B, Baker D. Native protein sequences are close to optimal for their structures. Proc Natl Acad Sci. 2000;97:10383–10388.
- Porter RR. Partition chromatography of insulin and other proteins. Biochem J. 1953;53:320–328.
- Wilkins MR, Lindskog I, Gasteiger E, et al. Detailed peptide characterization using PEPTIDEMASS - a World-Wide-Web-accessible tool. Electrophoresis. 1997;18:403–408.
- Artimo P, Jonnalagedda M, Arnold K, et al. ExPASy: SIB bioinformatics resource portal. Nucleic Acids Res. 2012;40:597–603.