
 ?Mathematical formulae have been encoded as MathML and are displayed in this HTML version using MathJax in order to improve their display. Uncheck the box to turn MathJax off. This feature requires Javascript. Click on a formula to zoom.
ABSTRACT
Additive manufacturing, also called 3D printing, is an effective method for preparing scaffolds with defined structure and porosity. The disadvantage of the technique is the excessive smoothness of the printed fibers, which does not support cell adhesion. In the present study, a 3D printed scaffold was combined with electrospun classic or structured nanofibers to promote cell adhesion. Structured nanofibers were used to improve the infiltration of cells into the scaffold. Electrospun layers were connected to 3D printed fibers by gluing, thus enabling the fabrication of scaffolds with unlimited thickness. The composite 3D printed/nanofibrous scaffolds were seeded with primary chondrocytes and tested in vitro for cell adhesion, proliferation and differentiation. The experiment showed excellent cell infiltration, viability, and good cell proliferation. On the other hand, partial chondrocyte dedifferentiation was shown. Other materials supporting chondrogenic differentiation will be investigated in future studies.
Introduction
Three-dimensional (3D) constructs with high porosity and interconnected pores are crucial for skeletal tissue engineering applications. The porous structure of the scaffold enables cells to migrate into the construct, and also facilitates the proliferation and production of specific proteins of the extracellular matrix (ECM). Moreover, the scaffold should degrade and be replaced by natural tissue, which would then integrate into the surrounding tissue. In addition, the functional scaffold should possess adequate viscoelasticity and stiffness to withstand the high mechanical loading in the target organ.
Recently, additive manufacturing, also called 3D printing, changed the way how scaffolds are manufactured. Classical scaffold formation is based on the fabrication of a bulk scaffold structure with random organization followed by cutting of the scaffold to the desired shape. 3D printing enables the formation of scaffold morphology based on a computer aided design. The scaffold is built layer-by-layer with the shape of each layer precisely controlled. 3D printing allows scaffolds to be prepared from diverse materials. The scaffolds for tissue engineering applications are mostly prepared from degradable polymers, e.g. polylactic acid (PLA),Citation1,Citation2 polylactide-co-glycolide (PLGA),Citation3 poly-ϵ-caprolactone (PCL),Citation4 and calcium phosphate.Citation5 The mechanisms of the 3D printing methods highly differ in principle. While fused deposition modeling (FDM), also called solid free form fabrication (FFF), is based on the extrusion of a molten polymeric filament by a thin nozzle, photolitographic technology is based on crosslinking polymeric resin using laser light of an appropriate wavelength. In addition, the sintering methods are based on a process in which solid powder is melted (i.e. laser light and metal powder) or solubilized (i.e. H3PO4 and ceramic powder).Citation5 Nevertheless, ink-jet printing is based on depositing polymers dissolved in appropriate solvents. 3D bioprinting technology combines ink jet printing of polymers dissolved in an aqueous buffer with living cells and other biological substances, resulting in the formation of cell seeded scaffolds mimicking the complex architecture of natural tissues.Citation6 For this purpose, several natural polymers, e.g. collagen, fibronectin, hyaluronic acid, and alginate have already been 3D printed. However, their printing requires adequate conditions to avoid the risk of cellular damage (i.e. high temperature, osmolarity, shear stess).Citation4,Citation6–Citation9 Recently, Organovo introduced a commercial platform for development of liver and kidney model with close-to-native properties.Citation10
3D printing is a unique bottom-up technology enabling customization of the implant morphology. 3D printed scaffolds have large interconnected pores and can be designed to an exact shape and with optimized mechanical properties. 3D printed scaffolds have been tested in the regeneration of knee cartilage,Citation2 laryngotracheal cartilage,Citation1 bone,Citation5 vessels,Citation11 tendons,Citation4 liver,Citation12 nerves,Citation13 or as an ureteral stent.Citation14 On the other hand, the micrometer resolution of the 3D printing results in the formation of smooth fibers with a size of hundreds of micrometers. Such structure does not mimic the native extracellular matrix (ECM) and does not enable proper cell adhesion due to the low number of contact points.Citation7 Several approaches have been tested to improve the adhesion of cells to the 3D printed scaffolds. For instance, a cell carrying hydrogelCitation15 has been used to enhance cell adhesion and proliferation.
In the present study we focus on the development of solid 3D printed scaffolds using a free form fabrication (FFF) process in combination with electrospun nanofibers to improve the cell adhesion and biological suitability. Several studies have dealt with a combination of 3D printing and nanofibers.Citation11,Citation16–Citation18 The advantage of 3D printing combination with electrospinning is based on improvement of shortcommings of both methods. Electrospun nanofibers show excellent biological properties. With the size of fibers being similar to the ECM and a huge surface to volume ratio, nanofibers support cell adhesion and proliferation.Citation19 Nanofibers therefore serve as a biomimicking part responsible for improved cell adhesion on composite scaffolds. It has been shown that a 3D printed PCL scaffold in combination with PCL electrospun nanofibers supports cell adhesion.Citation16 On the other hand, the 3D printed part of scaffolds enables improvement of mechanical properties and formation of complex shaped 3D objects on macroscale. For instance, the combination of PCL-chitosan nanofibers with 3D printed PCL structures increased the biomechanical properties of a tissue engineered scaffold for cardiovascular prosthesis.Citation20
Despite their excellent properties, electrospun nanofibers also have some limitations. Classical nanofibrous layers have poor biomechanical properties and a small pore size, which prevents cell migration through the nanofibrous layer.Citation21–Citation23 The effect is caused by the compacted depositing of fibers on the collector resulting in a 2D-like deposit and small pores. In our previous study, structured nanofibrous layers were prepared using a specially designed collector.Citation24 The patterned collector showed an inhomogenous distribution of the electric field due to the structure being made of conductive and non-conductive elements. The fibers were deposited on a conductive element with higher density and on non-conductive spaces with lower density. Structured PCL nanofibers prepared using this technology contained larger pores, which enabled the penetration of mesenchymal stem cells (MSCs) through the layer, and moreover, they enhanced cell proliferation.
In the present study, we aimed to develop a 3D printed construct from PCL combined with electrospun nanofibers. In order to overcome the low pore size of classical nanofibers, structured PCL nanofibers that showed improved cell penetration were employed.Citation24 In addition, the method for fabricating large constructs was optimized. The manufacturing process consisted of 2 separate steps. First, the microfibrous grid was fabricated using 3D printing and the structured nanofiber mesh via electrospinning. As a second step, a composite scaffold was produced by combining both systems together with glue. By stacking such 3D printed grid/electrospun nanofiber composites, scaffolds with unlimited dimensions may be fabricated. In order to verify the scaffold potential for cartilage tissue engineering, the composite scaffolds were seeded with primary chondrocytes and tested in vitro.
Methods
Preparation of scaffolds
An innovative technique, which combines electrospinning and 3D printing, was used to prepare the scaffolds using a two-step process. In the first step, the PCL nanofibers were prepared as described earlier.Citation24 Briefly, the PCL with a molecular weight of 45.000 (Sigma Aldrich), were dissolved in a chloroform/ethanol mixture (9:1 w/w). The polymer concentration in the solution was 16 w/w%. The polymer solution was prepared using a Nanospider™ device with a needleless wire electrode. Classical nanofibers were deposited on a plain collector. In the case of structured nanofibers, the scaffold was formed on a collector consisting of conductive metal wires (). The pattern of the produced scaffold corresponded to the structure of the collector surface (). Thus, the structured scaffold was characterized by spots of different surface mass density, and it resembled a knitted structure (, ). The classical nanofibers were deposited on a spunbond non-woven textile; the structured nanofibers were deposited directly on the metal collector. Nanofibrous layers were removed from the deposited substrates prior to further processing.
Figure 1. Scheme of the composite 3D printed grid/electrospun nanofiber scaffold formation. The process is a two-step method. The first step involves producing the classical electrospun fibers using a non-patterned collector (a), structured nanofibers using patterned collector (b) and 3D printing of microfibrous grid (c). The second step involves combining the electrospun fibers with the 3D printed microfibrous grid using glue (d).
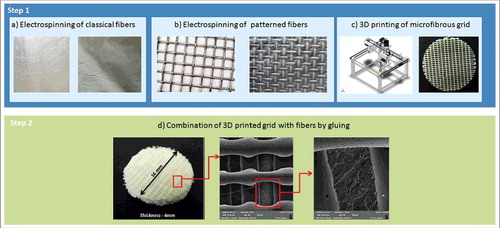
Figure 2. Morphology of structured electrospun fibers (St). (a) Thick dense parts of fibrous mesh show compacted fibers with small pores. Dense parts are formed on the conductive elements of the collector. (b) Thin part of fibrous mesh with loose fiber packing and large pores. The loose parts are formed in the non-conductive region of the collector.
The microfibrous construct was prepared using a 3D printer working on the principle of free-form fabrication (FFF) (Reprap Printer made by the Technical University in Liberec; ). The same PCL polymer was used for 3D printing (45.000 Mw, Sigma Aldrich) in the form of self-made filament. The single 3D printed layer had a height of 0.4 mm. The microfibers in a single layer had a width of 0.3 mm and formed a grid with pre-defined pore shape and organization. The distance between the two neighboring fibers was 0.6 mm.
The composite scaffolds were prepared by gluing the nanofiber layers to the 3D printed single layer grids (). PCL (45.000 Mw, Sigma Aldrich) solution in chlorophorm/ethanol in ratio 9:1 (30 wt%) was used as a glue. The solution was uniformly distributed on the 3D printed single layer grid facing the nanofibers in a density of 20 spots per cm2. The PCL nanofibers were then positioned on the grid containing glue. After the solvents evaporated, the PCL nanofibers were attached to the surface of the grid. By repetition of the process multilayered scaffolds were fabricated.
Five different scaffold types were prepared for in vitro testing. The composite scaffolds combined the 3D printed microfibers with the classic electrospun nanofibers (3D Cl) and the structured electrospun nanofibers (3D St). The composite scaffolds were compared to samples composed of classic (C1) and structured (St) electrospun nanofibers without the 3D printed grids. In addition, the 3D printed single layer grids (3D) were tested as control samples.
Scaffold visualization using scanning electron microscopy and characterization
Scanning electron microscopy (SEM) was used to detect the samples' morphology. Samples were sputtered with gold (5 nm layer) and analyzed using a scanning electron microscope (Tescan, VEGA3 SB easy probe). The diameters of the 3D printed microfibers and electrospun nanofibers were measured in the Image J program.
The porosity of the 3D printed construct was calculated from the 3D model used for printing. The dimensions of the printed grid are shown in (b,c). The theoretical porosity of the 3D printed grid was calculated using the following formula:
Va – the total volume of air in the scaffold
Vt – the total volume of scaffold
The pore distribution of the nanofiberous part of the composite scaffold was calculated in ImageJ software from SEM images. The methodology was based on calculating the pore area between fibers. The pore area defined by fiber boundaries was calculated and pore distribution was represented as the area of pores in μm2. Three images were used to calculate each scaffold. The methodology is consistent with previously reported measurements.Citation25–Citation31
Isolation and cultivation of chondrocytes
Chondrocytes were isolated from the condyle of a pig's femur. The cartilage was cut into small pieces (1 × 1 mm), and incubated in a collagenase solution (9.12 µl/ml, collagenase NB 4 G Serva Proved Grade) in a humidified incubator (37°C, 5% CO2) for 14 h. Then the cells were centrifuged at 300 g for 5 min and seeded into culture flasks. The chondrocytes were cultivated in a chondrogenic medium (Iscove's Modified Dulbecco's Medium supplemented with 12% fetal bovine serum (FBS) (Sigma-Aldrich), penicillin/streptomycin (100 I.U./ml and 100 µg/ml, respectively), 400 mM L-glutamine, 100 nM dexamethasone (Dexamed; Medochemie, CR), 20 µg/ml ascorbic acid-2-phosphate (Sigma-Aldrich) and ITS – X (10 µg/ml insulin, 5.5 mg/l transferrin, 6.7 µg/l sodium selenite, 2 mg/l ethanolamine, GIBCO). The medium was changed every 3 days.
Seeding of scaffolds
Scaffolds with a diameter of 6 mm and a thickness of approximately 2 mm (consisting of two 3D printed grids with one nanofibrous layer in the middle) were sterilized using ethylene oxide. The chondrocytes of passage 3 were seeded on scaffolds at a density of 2.5 × 10⁴ per well in a 96-well plate (approximately 8 × 10⁴/cm2). Scaffolds with seeded chondrocytes were cultivated in a chondrogenic medium (see above). The medium was changed every 3 days.
Cell proliferation analysis
The proliferation of chondrocytes on the scaffold was measured from the amount of DNA (Quant-iT™ dsDNA Assay Kit; Life Technologies). The proliferation of chondrocytes on scaffolds was tested on days 1, 3, 7, 14, 21, and 28. The scaffolds were put into a vial with 500 μL of cell lysis solution (0.2% v/v Triton X-100, 10 mM Tris (pH 7.0), and 1 mM EDTA) and processed through 3 freeze/thaw cycles; the scaffold sample was first frozen at −70°C and thawed at room temperature. Between each freeze/thaw cycle, the scaffolds were roughly vortexed. Sample (10 µl) was mixed with 200 μL of reagent solution measured on a multiplate fluorescence reader (Synergy HT, λex = 485 nm, λem = 525 nm). The results were evaluated from the calibration curve using the standards in the kit.
Cell metabolic activity and viability analysis
The metabolic activity of the cells was measured using an MTS assay (CellTiter 96® AQueous One Solution Cell Proliferation Assay; Promega). Twenty microliters of MTS solution were added to 100 μL of the sample medium and incubated for 2 h at 37°C. Subsequently, 100 μL of the cultivated solution was transferred to a new clean well. The absorbance of the media was detected using spectrophotometry at 490 nm (reference wavelength, 690 nm). The acquired data were related to the measured concentration of DNA synthetized on the respective scaffolds. The calculated values correspond to the viability of the cells.
Visualization of cell adhesion and proliferation on scaffolds
DiOC6(3) staining was used to detect cell adhesion on the scaffolds on days 1, 7, 14, 21, and 28. DiOC6(3) was used to visualize the internal membranes in cell cytoplasm (green color) and propidium iodide (PI) to visualize the cell nuclei (red color). Samples were fixed with frozen methylalcohol (−20°C) for 10 min. Subsequently, the fluorescent probe 3,3′-diethyloxacarbocyanine iodide (DiOC6(3), D273, Invitrogen, Molecular Probes 1 μg/mL in phosphate buffered saline (PBS); pH 7.4) was added and incubated with the samples for 45 min at room temperature. The samples were rinsed with PBS, and propidium iodide (PI; 5 μg/mL in PBS) was added for 10 min, followed by rinsing with PBS, and visualized using a ZEISS LSM 5 DUO confocal microscope (PI: λexc = 561 nm, λem = 630–700 nm; DiOC6(3): λexc = 488 nm, λem = 505–550 nm).
The figures obtained from confocal microscopy were subsequently processed to detect the cell proliferation and distribution in the scaffolds. The acquired fluorescence signal from PI (stained cell nuclei) was evaluated using the LSM Image Browser program (Zeiss) and artificial color was assigned to each figure from different depths. Subsequently, figures from different depths were processed together into a folded projection. This resulted in pictures with a color range, where different colors referred to different depths of the scaffold. The color-coding of the particular depth is displayed on a color scale. Cell proliferation was determined from signal of propidium iodide staining using ImageJ software. Three images from different sites of the scaffolds were used for evaluation.
Chondrocyte penetration through nanofiber layers
The penetration of the cells through the classic and patterned nanofiber layers was investigated. Sheets of nanofibers were cut and fixed in 24-well plate inserts (Scaffdex, Finland). The bottom of the 24-well plate was covered by a microscopic glass, and inserts with nanofibers were placed inside the wells. Cells at a density of 8 × 104 cm−2 were seeded on the nanofiber layers inside the inserts to prevent the leakage of cells to the surrounding areas. On days 1, 3, and 7, chondrocytes were visualized using fluorescence staining. Inserts with fibers were removed, and glasses from the bottom of the 24-well plate were stained with DiOC6(3) and propidium iodide as mentioned previously and visualized using confocal microscopy. The visualized cells were counted using Ellipse software (ViDiTo, Košice, Slovakia) and the data were statistically evaluated.
RNA isolation and qRT-PCR analysis
The total RNA was isolated using the Qiagen RNA mini-kit (Qiagen, Hilden, Germany) according to the protocol provided by the manufacturer. Reverse transcription (RT) was performed using the RevertAid H Minus First Strand cDNA Synthesis Kit (Thermo Scientific, Waltham, MA, USA) with 80 ng of total RNA. Transcript levels were evaluated using quantitative real-time RT-PCR. QRT-PCR was performed using the Light Cycler 480 II real-time PCR system (Roche, Basel, Switzerland) with LC 480 TaqMan Master and TaqMan probes (Universal Probe Library, Roche) following the protocols from the manufacturer. The genes whose expression was analyzed using qRT-PCR are listed in . All samples were run in triplicates. The thermo cycling parameters were 95°C for 10 min; 95°C for 10 s, 60°C for 10 s (45 cycles); and 40°C for 1 min. All samples were scaled relative to the median of the GAPDH expression level, which was used as an endogenous control gene.
Table 1. List of probes and primers used in qRT-PCR.
Detection of chondrogenic marker using indirect immunofluorescence staining
The presence of type II collagen, a typical marker of chondrogenic differentiation, was confirmed using indirect immunofluorescence staining on days 7, 14, 21, and 28. Samples were fixed with 4% formaldehyde for 10 min, washed with PBS and incubated in 3% FBS in PBS/0.1% Triton for 30 min at room temperature. A primary monoclonal antibody against type II procollagen, clone II-II6B3 was obtained from the Developmental Studies Hybridoma Bank, created by the NICHD of the NIH and maintained at the Department of Biology, University of Iowa, Iowa City, IA 52242. (dilution 1:20) and incubated overnight at 2–8°C. After three washes with PBS/0.05% Tween, the samples were incubated with the secondary antibody, Alexa Fluor 488 conjugated anti-mouse antibody, for 45 min. Subsequently, a solution of PI was added for 10 min (5 μg/mL in PBS) for the visualization of the cells' nuclei. The samples were washed three-times in PBS/0.05% Tween again and were then examined with a ZEISS LSM 5 DUO confocal microscope (Alexa Fluor 488: λexc = 488 nm, λem = 505–550 nm PI: λexc = 561 nm, λem = 630–700 nm). The images were further quantified using ImigeJ software. The images were converted to black-white intensity images and the intensity was quantified with respect to the background. The cell number was quantified using automated counting of nuclei (PI signal).
Statistical analysis
Quantitative data are presented as mean ± standard deviation (SD). Average values were determined from at least 3 independently prepared samples. Results were evaluated statistically using the One-Way Analysis of Variance and Student-Newman-Keuls test (SigmaStat 12.0, Systat Software Inc., San Jose, California).
Results
Characterization of the prepared scaffolds
The first step in the fabrication process resulted in electrospinning 2 types of fibers – structured (St) and classical (Cl). In addition, a microfibrous PCL grid was prepared using 3D printing. The analysis of the fibers visualized using SEM was completed in the Image J program. The data from analysis are summarized in . The preparation of nanofibers using different collectors resulted in nanofiber layers of differing morphologies. In the case of classic nanofibers, the layer was homogenous with an average fiber diameter of 278 ± 68 nm. The scaffold also contained a minor fraction of microfibers and a few non-fibrous defects. The fibrous layer showed more compact morphology. The porosity of the construct was 52.3%. The mean pore size was 2.47 ± 1.86 μm2 and the largest pores showed 12 μm2 in diameter. The number of pores bigger than 5 μm2 was only 8% of all pores. Nanofibers prepared using a structured collector showed a patterned structure, with a significantly smaller fiber diameter of 221 ± 54 nm. The layer in the dense part of scaffold showed low porosity (40.2%) and the mean pore size was 1.95 ± 1.02 μm2. The sample did not show pores bigger than 8 μm2 and pores bigger than 5 μm comprised only 3% of all pores. On the other hand, the structure of the fibrous mesh in less dense areas had a higher mean pore size (5.58 ± 4.62 μm2). The maximum pore size was 40 μm2 and pores bigger than 5 μm2 comprised 38% of all pores. The sample also showed the highest porosity reaching 65.7%. The difference was visible from analysis using SEM. illustrates the morphology of the thick compacted parts and thin porous parts of the structured scaffold. Nevertheless, the average diameter of microfibers prepared using 3D printing was 441 ± 53 µm. The grid fibers showed smooth morphology with minor grooves from the extrusion process.
Table 2. Characterization of classic and structured nanofibers.
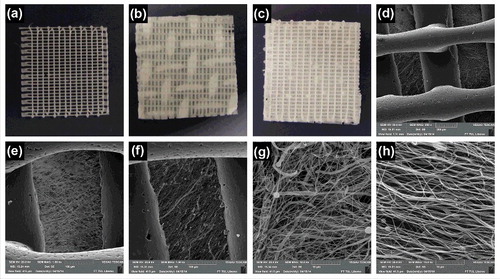
The second step in preparing the scaffold was based on gluing the 3D printed grid with electrospun fibers to produce a composite scaffold. Two different composite scaffolds were prepared – 3D printed microfibrous grids were combined with structured (3D St, , ) and classical (3D Cl, , ) nanofibers. In addition, control samples based on pure structured nanofibers (St, ), classical nanofibers (Cl, ) and 3D printed microfibrous grid (3D, ) were prepared for in vitro testing. Samples were visualized macroscopically () and using SEM (). Gluing the electrospun fibers to the 3D printed microfibrous grid using 30 wt% PCL was shown to be sufficient to maintain the integrity during the whole experimental period. The bonding of scaffolds did not result in the nanofibers' dissolution and the system's morphology remained the same (). We observed no defects in the fibrous structure caused by the dissolution of the fibers in the glue solvents. The composite scaffold showed that the pores in the microfibrous grid were covered by an electrospun fibrous mesh. Therefore the adhesion surface for cells was significantly increased.
Figure 3. A visualization of the prepared scaffolds. A macroscopic visualization of 3D (a), 3D St (b) and 3D Cl (c), sample size 1.5 × 1.5cm. A scanning electron microscopy visualization of 3D St (d, e), 3D Cl (f), St (g) and Cl (h).
Chondrocytes adhesion and proliferation on scaffolds
Five different scaffolds were tested in the experiment: a 3D printed scaffold (3D), a scaffold from a classic (Cl) and structured (St) nanofibrous layer, and composite scaffolds, which were prepared as a sandwich of three 3D printed layers and two either classic (3D Cl) or structured (3D St) nanofibers.
The extent of chondrocyte adhesion and proliferation on the scaffolds was measured as a change in the DNA concentration. Cell adhesion, measured 24 hours after seeding, was similar on all scaffolds. A significant difference was shown only between the 3D St and 3D scaffold, where lower cell adhesion was seen on the 3D scaffold.
The proliferation of chondrocytes on the scaffolds was detected throughout the 28 day experiment (). The amount of cells on the 3D scaffolds was at the same level throughout the whole experiment. Similar results were shown on the composite scaffolds 3D Cl and 3D St; a significant increase in DNA content was observed on day 28 (). On the contrary, a gradual cell increase was detected on the Cl and St nanofiber layers. Both the Cl and St nanofiber scaffolds improved chondrocyte proliferation compared to both of the composite scaffolds 3D Cl and 3D St on days 14 and 21. On day 28, statistically the same results were shown for the 3D St, St and Cl scaffolds, where the DNA amount was significantly higher than on the 3D Cl and 3D. The results indicated that the 3D printed and composite 3D printed scaffolds showed prolonged colonization times compared to the electrospun nanofibers. The combination of 3D printed grid with nanofibers resulted in increased proliferation of the cells after 28 days and improved the scaffold colonization by cells.
Figure 4. Chondrocyte proliferation and metabolic activity. Chondrocyte proliferation on the polycaprolactone composite 3D printed scaffolds with nanofibers (3D st, 3D Cl); the control 3D scaffold (3D), classical (Cl), and structured (St) nanofibers were evaluated by DNA measurement (a). Chondrocyte metabolic activity was evaluated using an MTS assay (b). The values of metabolic activity obtained using the MTS test were divided by the amount of DNA measured using DNA quantification. This means that the metabolic activity was related to the amount of cells (c). Numbers of cells were also determined from confocal microscopy images (d) (*p<0.05, **p<0.001).
Cell metabolic activity and viability
Chondrocyte viability and metabolic activity was measured using an MTS assay (). On the first day, significantly higher metabolic activity was detected on the 3D St compared to the St and on the 3D Cl composite scaffolds compared to the St and 3D scaffolds. On day 7, absorbance was comparable on the 3D St, 3D Cl, and Cl scaffolds and was statistically higher than absorbance on the St and 3D scaffolds. On days 14 and 21, a significantly higher metabolic activity was detected on the Cl and St nanofibrous scaffold compared to other scaffolds. By the end of the experiment on day 28, the highest metabolic activity was measured on the Cl and St nanofibers and was statistically higher than on other scaffolds. The lowest metabolic activity was shown on the 3D scaffold throughout the whole experiment. The results are consistent with the cell proliferation assay. The cells on the nanofiber containing scaffolds showed higher metabolic activity and proliferation rates.
The values of metabolic activity were related to the quantified DNA content to get the relative cell viability (). The highest viability was measured on 3D Cl during the 21 days of the experiment. A considerable decrease was detected on day 28, when the highest cell viability was measured on 3D samples. Comparable results to 3D Cl were measured on 3D St and Cl on day 7. The relative viability was highest on the composite scaffolds. The cells on 3D St and 3D Cl showed higher metabolic activity per unit of DNA compared to the plain nanofibrous sample. Such difference may be related to the higher consumption of energy for cell spreading and migration on the composite scaffolds (3D St and 3D Cl). The cells on St and Cl samples showed a continuous increase in cell number indicating that the majority of metabolic activity was connected with the proliferation.
Chondrocyte visualization using confocal microscopy
To confirm the results obtained from the metabolic and proliferation assays, cells on scaffolds were stained with fluorescent probes, visualized with a confocal microscope and subsequently, the images were used for cell number quantification (). Adhesion of individual cells or cells in small groups was visible on the 3D printed scaffolds. The morphology indicated poor cell adhesion to the smooth surface of the 3D printed scaffolds. Quantitative analysis of confocal micrographs showed 176 ± 110 cells/mm2. Only a slight increase of cell numbers was visible in the following days on these scaffolds parts. The cell number on days 7 and 14 was 142 ± 75 cells/mm2 and 130 ± 89 cells/mm2, respectively. During the later days of culture, the cell number increased only slowly to 611 ± 554 cells/mm2 on day 21 and 623 ± 648 cells/mm2 on day 28. The mean cell count strongly depended on the part of the scaffold analysed and thus, the standard deviation was high. Interestingly, more cells were visible on the 3D fibers of the composite 3D St and 3D Cl scaffolds compared to the 3D scaffold. The cell number obtained from the micrographs for the 3D Cl goup was 202 ± 41 cells/mm2 on day 1, 478 ± 46 cells/mm2 on day 7, 688 ± 31 cells/mm2 on day 14, 1079 ± 29 cells/mm2 on day 21, and 1114 ± 90 cells/mm2 on day 28. The 3D St group showed even greater number of cells. The cell number on day 1 was 337 ± 116 cells/mm2, 1120 ± 319 cells/mm2 on day 7, 939 ± 131 cells/mm2 on day 14, 1056 ± 263 cells/mm2 on day 21, and 1889 ± 193 cells/mm2 on day 28. These results confirm our hypothesis that the combination of the 3D printed microfibrous scaffolds with the electrospun fibrous mesh improves the scaffold colonization ().
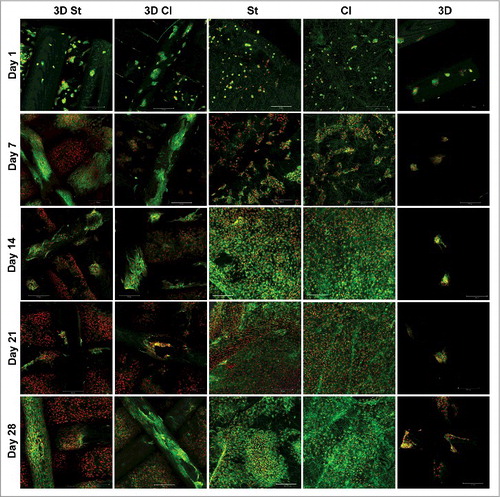
Figure 5. A visualization of cells on scaffolds by confocal microscopy. Cells' internal membranes were stained with DiOC6(3) (green color) and cell nuclei using PI (red color) and visualized using a confocal microscope on days 1, 7, 14, 21, and 28. Cells adhered in small groups on all scaffolds. It is clearly visible that cells preferably proliferate on nanofiber layers (St and Cl) and the nanofibrous parts of the composite scaffolds (3D St, 3D Cl). Only a small amount of cells was visible on the 3D printed scaffold. Scale 100 µm, objective 10 ×.
By contrast, cells grew well on the nanofibrous parts of the scaffolds. Chondrocytes adhered in small groups and proliferated and spread themselves over all of the nanofibrous parts of the composite scaffolds, until they reached a confluence on day 21. The same observation was found on nanofibrous scaffolds Cl and St. Chondrocytes adhered individually or in small groups and started to proliferate and spread immediately. On day 1, we have observed 121 ± 62 cells/mm2 on the Cl scaffolds and 256 ± 56 cells/mm2 on the St scaffolds. The cell number on day 7 increased to 530 ± 188 cells/mm2 on the Cl scaffolds and 602 ± 70 cells/mm2 on the St scaffolds. A confluence of cells was visible from day 14 until day 21 (). The cell number increased to 1765 ± 201 cells/mm2 on the Cl scaffolds and 2162 ± 445 cells/mm2 on the St scaffolds on day 14 and remained at similar on day 21 (Cl – 1362 ± 63 cells/mm2, St – 2418 ± 612 cells/mm2) and 28 (Cl – 1330 ± 86 cells/mm2, St- 2059 ± 214 cells/mm2).
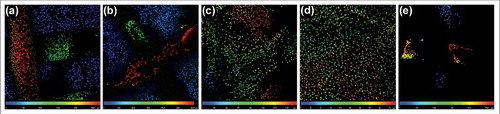
For a visualized distribution of the cells in scaffolds, fluorescently labeled cell nuclei (PI) were sorted according to the depth of the scaffold (for details see methods). Nuclei colors correspond with the color on the scale. Red colored cells are on the top of scaffold; blue are in the deepest layer. From , it is clearly visible that chondrocytes adhered and proliferated up to a 600 µm depth on the composite scaffolds. No difference was shown between the 3D Cl and 3D St groups.
Figure 6. A color depth projection of confocal microscopy images from day 28. Images from particular imaging levels were color labeled and put together. The color of the cell nuclei (stained by propidium iodide) on the final image corresponds to its location in the scaffold; the red color is at the top and the blue is at the bottom of the scaffolds. Cells penetrated to a depth of 550 µm in the 3D St (a) and 600 µm in the 3D Cl (b). The penetration of cells on the St (c) was 160 µm, which was significantly deeper than on the Cl (47 µm; d). The 3D cells were detected to a depth of 270 µm in 3D (e).
Penetration of chondrocytes through nanofiber layers
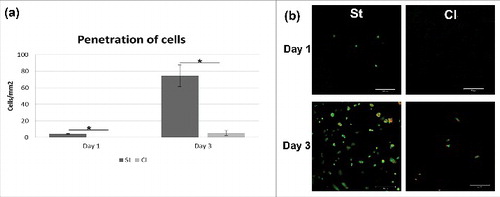
The improved penetration of cells through structured nanofibers was another hypothesis tested in the experiment. Nanofibers were seeded with cells in a 24-well plate, where cover glasses were placed on the bottom. Glasses were fluorescently stained and visualized using confocal microscopy. The penetrated cells were counted and the results were statistically evaluated (). Chondrocytes penetrated well through the St nanofibrous layer. A small amount of cells was visible on the glass just 24 hours after seeding (4.3±0.5/mm2). On the other hand, no penetrating cells were detected on classic scaffold (Cl) on day 1 (p = 0.006). In the following days, the cells migrated, proliferated and spread on the glass coverslips under structured nanofibers (74.3±13.0/mm2 on day 3). The amount of cells was significantly bigger (p = 0.027) compared to classic nanofibers (5.3±3.0/mm2). The results confirmed that the patterned structure with areas with larger pores improved cell penetration and may be crucial for efficient colonization of the scaffolds.
Figure 7. Cell penetration through nanofibrous layers. Chondrocyte were seeded on Cl and St nanofibrous layers and their penetration through layers were visualized using confocal microscopy. Penetration was significantly higher on St scaffold (a) (*p<0.05). Cell nuclei were stained using propidium iodide (red color) and cell membranes using DiOC6(3) (green color)(b).
Real-time PCR analysis
The expression of typical chondrogenic markers, type II collagen and aggrecan, were detected using real-time-PCR analysis. These proteins are important components of the hyaline cartilage extracellular matrix.
The production of aggrecan was at its maximum level on day 7, and there were no significant differences between groups. The highest and the most balanced aggrecan production was seen on the Cl throughout the whole experiment, except day 14, where the highest expression was seen on the 3D St ().
Figure 8. Gene expression on markers of chondrogenic differentiation. The expression of markers of hyaline cartilage production – aggrecan (a) and type II collagen (b) and marker of dedifferentiation – type I collagen (c) were detected on the 3D St, 3D Cl, St and Cl samples on days 1, 7, 14, and 21. All samples were scaled relative to the median of the GAPDH expression level, which was used as an endogenous control gene (*p<0.05, **p<0.001).
The expression of type II collagen mRNA was low in all samples. However, large differences between groups and experimental days were visible (). On day 1, no expression of type II collagen was seen on the 3D Cl, and the other samples were comparable. Low expression continued on the 3D Cl on days 7 and 14, but the highest expression was seen on day 21. Collagen II was more stably produced on the 3D St and St, with the maximum on day 21. The chondrocytes on the Cl expressed type II collagen throughout the whole experiment, with the highest expression on day 14.
Collagen type I is a typical protein for fibrocartilage and is also produced in the bone extracellular matrix. The expression of type I collagen was visible for the duration of the experiment. After an initial increase in all samples on day 7, a decrease in expression was shown on days 14 and 21 (). The highest collagen type I expression was shown on the St nanofibers on days 1, 7, and 21, with a decrease on day 14. Compared to the St, the Cl showed lower production, except on the 14th day. Similarly, expression on the 3D St was higher compared to the 3D Cl from day 7.
Production of chondrogenic marker type II collagen
The chondrogenic differentiation of cells seeded on scaffolds was detected as a production of markers specific for the cartilage extracellular matrix. Type II collagen was chosen as a protein typical for hyaline cartilage. From it is visible that cells started to produce type II procollagen after 7 days of cultivation on all types of scaffolds. Type II procollagen production was lower on 3D composite scaffolds (3D St and 3D Cl). An increase in production was seen on nanofibrous scaffolds with an increasing number of cells.
Figure 9. Immunohistochemical staining of type II procollagen (green) and propidium iodide staining (cell nuclei, red) of the polycaprolactone composite 3D printed scaffolds with structured (3D St) or classical nanofibers (3D Cl), classical (Cl), and structured (St) nanofibers on days 7 and 21 (a). Staining showed higher cell density and also type II procollagen production on both, the Cl and St nanofiber scaffolds. The amount of type II procollagen on images was quantified and related to number of cells (b) (*p<0.05, **p<0.001).
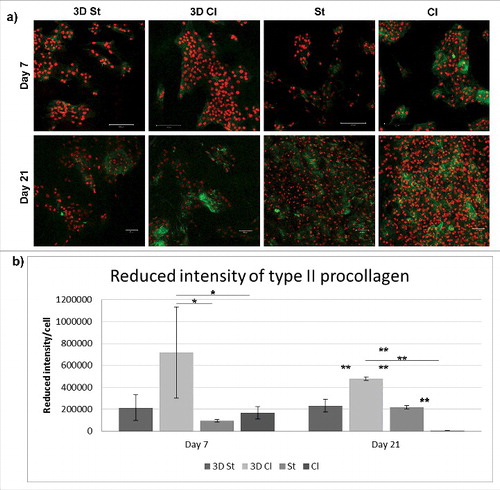
An antibody detecting type II procollagen was used for the detection of new collagen expression since it does not recognize the matured form of type II collagen. The results confirm the observation made using qPCR. Collagen expression on day 7 was visible in all samples to a lower extent, except for the Cl scaffolds. With an increase in cell number and the colonization of the scaffold, the presence of pro-collagen type II increased since the intensity per cell remained the same or increased. The results demonstrate that the scaffold supports the artificial production of the chondrogenic ECM necessary for successful cartilage repair.
Discussion
3D printing revolutionizes the possibilities for developing scaffolds with a custom morphology and shape. This method enables the transfer from a computer created scaffold design (CAD, computer-aided design) to printed matrices with a well-defined shape and pore size. Unlike other methods (e.g. hydrogels, foams, nanofibers), the architecture is controlled by the user, which makes this technology popular in both technical and biomedical applications. Freeform fabrication (FFF) is an easy method of 3D printing, where the polymer melt is extracted from the jet, which results in fibers and pores the size of tens to hundreds of micrometers. The low resolution is a consequence of using bigger nozzles as the small nozzles tend to clog. The resolution is low with a minimum line size of 100 µm; the minimum size of the 3D object is 300 µm.Citation7,Citation18 In our 3D scaffolds, the measured diameter of the lines was above 400 µm.
The main disadvantage of 3D printed scaffolds for cartilage tissue engineering is the small distinguishability, resulting in fibers with a large pore size and smooth surface. However, the developed microfibers and shapes lack nanostructured topology mimicking the natural fibrous ECM. The smooth surface of the fibers does not provide a sufficient number of contact points and limits cell adhesion on 3D printed scaffolds. Therefore, several studies have been dedicated to the surface enhancement of these materials.Citation13,Citation32 Common surface modification includes the addition of nano-roughness, a patterned surface,Citation14 increasing porosity,Citation7,Citation9 a coating with extracellular matrix proteinsCitation15,Citation33 or hydrogels,Citation34 or chemical modification of the surface.Citation12,Citation35 Another approach covers composite scaffold preparation using foams or hydrogels,Citation4,Citation9,Citation36 microfibers, or nanofibers.Citation20,Citation37
Electrospun nanofibers have gained much attention recently due to their unique properties. A fibrous mesh composed of nanofibers with a diameter mimicking the extracellular matrix provides an extremely high specific surface. Therefore the nanofibers were shown to be ideal for cell adhesion and proliferation.Citation19 A combination of these two materials, 3D printed microfibers providing customized scaffold morphology and mechanical support, with nanofibers providing pro-adhesive and porous substrate for cells, seems to be promising for skeletal tissue engineering. The often used 3D printed scaffolds combined with naturally-derived hydrogels provide specific binding sites for cells, and a more natural environment for chondrocyte adhesion, proliferation, and differentiation. In bigger scaffolds, the lower diffusion in gel should be taken into account. In addition, hydrogel degradation is fast and cannot be tailored; moreover, their composition may differ in different lots.
On the other hand, nanofibrous layers also have some limitations. Even though nanofibrous layers have large porosity, the pore size is too small for cells to infiltrate into the deeper layers and penetrate through. This problem was overcome in our previous study, where a patterned collector was used to prepare the structured layer.Citation24 Structured nanofibers contain areas with either dense or sparse nanofibers. Pores in the sparse areas of the scaffold were big enough to allow MSCs to penetrate through the scaffold. The phenomenon was also confirmed in the present study, where the penetration of chondrocytes was significantly faster on the St compared to the Cl nanofibrous layers. Therefore, structured nanofibrous layers in composites with 3D printed microfibers enable better penetration and uniform distribution of cells in the scaffold.
The process previously described for the combination of 3D printing and electrospun nanofibers is based on a complex method. In the study by Kim et al., nanofibers were electrospun on every single 3D printed microfibrous layer.Citation17 The process was repeated until the desired scaffold size and shape was achieved. However, in addition to the high complexity and slow processing speed, a further problem arose from insulation of the electric field (the PCL scaffold is an insulator) and improper electrospinning process. PCL is a non-conductive polymer and the electrostatic forces between the grounded collector and spinning electrode decrease when the thickness of the polymeric layer increases.Citation38 Therefore, the electrospinning process is slower and may result in the formation of aberrant fibers and beads affecting the morphology of the final scaffold. The non-conductive scaffolds shield the electric field and the process is stopped at a critical scaffold thickness. Such technology enables scaffolds to be produced with limited dimensions. The methodology reported in the present study overcomes this limitation by employing the 2 step process. The first step is used for separate fabrication of the 3D printed single layer grids and electrospun nanofibers. The pre-made components are combined by gluing in the second step. Therefore, the dimensions of the scaffolds are not limited – the process enables stacking of any thickness of fibers. The size of the construct may be somehow limited by the printing area of the 3D printer and width of the electrospun mesh.
High porosity and good pore interconnection of the composite 3D printed/electrospun scaffolds enabled a good exchange of nutrition even in the deeper layers. Nutrition exchange is, next to cell penetration, another critical parameter for the 3D scaffold. In the experiment, chondrocytes' presence in the 3D St and 3D Cl was confirmed by confocal microscopy, even at a depth of 600 µm throughout the whole 28 day experiment.
Nanofibers were shown to be an excellent surface for cell adhesion and proliferation. This was confirmed by increased proliferation throughout the whole experiment. Cell proliferation on the composite scaffolds (3D St, 3D Cl) was slower compared to the electrospun fibrous scaffold and stagnated during the first 21 days of the experiment. Higher proliferation of this part of the scaffold was detected on day 28, which is in accordance with the confocal microscopy pictures. The lower cell amount on the composite scaffolds (3D St, 3D Cl) was caused by the area covered by the 3D smooth fibers. The poor proliferation on the 3D printed control sample without the electrospun fibers shows that the smooth PCL fibers were an unfavorable surface for cell proliferation and acted rather as a barrier for the cells. We hypothesize that due to the poor adhesion to the smooth 3D printed PCL fibers, the cells spend more energy on migration and colonization of the scaffold compared to the plain electrospun scaffolds. As a result, the cells on 3D Cl showed the highest cell viability during the 21 days of the experiment. Similar results were shown for 3D St on day 7 and 14. The cell number on the scaffold was lower compared to the electrospun scaffolds St and Cl and the energy spending per cell was higher. Nevertheless, these results may also be caused by better exchange of nutrients on the composite scaffolds. Cells on the composite scaffolds (3D Cl and 3D St) had a larger growth area and improved diffusion of nutrients through a more 3D scaffold.
The expression of chondrogenic markers was low, but a statistical difference was detected between the groups. Similar levels were observed in the study of Mintz et al.Citation38 Both investigated chondrogenic proteins; type II collagen and aggrecan were synthesized the most on classic nanofibrous scaffolds (Cl). Type I collagen was expressed in a much higher concentration on all scaffolds, especially during the first week. This may be the consequence of partial dedifferentiation of the chondrocytes during their 2D culture before seeding and only a 21-day culture after seeding under static conditions. While comparing the 3D St and 3D Cl scaffolds, the 3D St showed a higher expression of aggrecan on day 14, a higher expression of type II collagen from day 1 until day 14, and a higher expression of type I collagen during the whole cultivation. Although the 3D St scaffold did not improve cell growth or cell viability compared to the 3D Cl, it had a stimulatory effect on extracellular matrix component expression. Interestingly, no type II collagen expression was found on the 3D Cl on days 1 and 14, but it was the highest on day 21. The chondrogenic differentiation is enhanced by a high cell density, which is more expected in less homogeneous 3D St scaffolds. Thus the 3D St scaffolds seem to be suitable scaffolds for cartilage regeneration.
While type II collagen is a specific marker for hyaline cartilage, type I collagen is typically synthesized in fibrous cartilage and it is described as a sign of the dedifferentiation of chondrocytes. On the other hand, type I collagen is a natural compound of the bone extracellular matrix. A higher expression of type I collagen could refer to the hypertrophy of chondrocytes and the osteoconductive properties of scaffolds.Citation39
The 3D scaffolds had higher 3D space for cell growth and resulted in delayed reaching of confluence. Cells in non-confluent cultures often show higher proliferation rate than in confluent cultures. As result, the chondrocytes on 3D st and 3D Cl were longer in M-phase compared to nanofiberous scaffolds – Cl and St. The cells on Cl and St reached confluence on day 14, while in 3D St and 3D Cl at day 28. After reaching confluence, the intercellular contact of chondrocytes stimulates production of late chondrogenic markers, such as collagen II. Especially, N-cadherins were shown to play pivotal role in this process.Citation40,Citation41 This is consistent with later increase of collagen II in 3D St and 3D Cl groups (on day 21), while in non-3D printed scaffolds (Cl and St) the collagen II production was higher at day 14. Similarly, with increase of collagen II production, the collagen I production was decreased.
Tested scaffolds composed of 3D printed grid with nanofibers combine advantage of both materials. 3D printed grid serve as a mechanical support and its big pores give enough space for cartilage ECM formation. As the PCL polymer slowly degrades it is replaced with newly formed ECM. On the other hand, cartilage ECM is formed with network of collagen and non-collagenous proteins and proteoglycans.Citation42 Nanofibers mimic these structure and support adhesion of infiltrated cells. Moreover, using of structured nanofibers enable better infiltration of cells into the scaffold.
Conclusion
A composite scaffold combining 3D printed PCL microfibers and patterned electrospun PCL nanofibers fulfilled our expectation for excellent cell infiltration, cell viability and good cell proliferation. On the other hand, partial chondrocyte dedifferentiation including a lower expression of aggrecan and type II collagen, and a higher expression of type I collagen was shown during in vitro cultivation under static conditions. Type I collagen expression of chondrocytes can indicate the osteoinductive properties of the composite scaffold. Other experiments will be needed to confirm the chondroinductive properties of the scaffold.
Disclosure of potential conflicts of interest
No potential conflicts of interest were disclosed.
Funding
This work was supported by the project “Nanofiber materials for tissue engineering”, reg. No. CZ.1.05/3.1.00/14.0308, which is co-financed by the European Social Fund and the state budget of the Czech Republic; the Grant Agency of Charles University under Grants Nos. 1246314, 1262414, 1228214, 545313; the Czech Science Foundation Grant No. 15–15697S; the University Centre for Energy Efficient Buildings (UCEEB); the Ministry of Education, Youth, and Sports of the Czech Republic under Research Programs NPU I:LO1508 and NPU I:LO1309); the Internal Grant Agency of the Ministry of Health of the Czech Republic under Grant No. NT12156 and MZ-VES project no. 16–29680A and 16–28637A; University Hospital Motol under project 9775; and the Ministry of Interior of the Czech Republic under program BV III/1-VS, No VI20152018010.
References
- Goldstein TA, Smith BD, Zeltsman D, Grande D, Smith LP. Introducing a 3-dimensionally Printed, Tissue-Engineered Graft for Airway Reconstruction: A Pilot Study. Otolaryngol Head Neck Surg. 2015;153(6):1001–6. doi:10.1177/0194599815605492. PMID:26392025.
- Rosenzweig DH, Carelli E, Steffen T, Jarzem P, Haglund L. 3D-Printed ABS and PLA Scaffolds for Cartilage and Nucleus Pulposus Tissue Regeneration. Int J Mol Sci. 2015;16(7):15118–35. doi:10.3390/ijms160715118. PMID:26151846.
- Kim SS, Utsunomiya H, Koski JA, Wu BM, Cima MJ, Sohn J. Survival and function of hepatocytes on a novel three-dimensional synthetic biodegradable polymer scaffold with an intrinsic network of channels. Ann Surg. 1998;228. doi:10.1097/00000658-199807000-00002. PMID:9671060.
- Merceron TK, Burt M, Seol YJ, Kang HW, Lee SJ, Yoo JJ, Atala A. A 3D bioprinted complex structure for engineering the muscle-tendon unit. Biofabrication. 2015;7(3):1758–5090. doi:10.1088/1758-5090/7/3/035003..
- Inzana JA, Trombetta RP, Schwarz EM, Kates SL, Awad HA. 3D printed bioceramics for dual antibiotic delivery to treat implant-associated bone infection. Eur Cell Mater. 2015;30:232–47. doi:10.22203/eCM.v030a16. PMID:26535494.
- Hsieh FY, Lin HH, Hsu SH. 3D bioprinting of neural stem cell-laden thermoresponsive biodegradable polyurethane hydrogel and potential in central nervous system repair. Biomaterials. 2015;71:48–57. doi:10.1016/j.biomaterials.2015.08.028. PMID:26318816.
- Chia HN, Wu BM. Recent advances in 3D printing of biomaterials. J Biol Eng. 2015;9(1):1–14. doi:10.1186/s13036-015-0001-4. PMID:25745515.
- Elomaa L, Teixeira S, Hakala R, Korhonen H, Grijpma DW, Seppala JV. Preparation of poly(epsilon-caprolactone)-based tissue engineering scaffolds by stereolithography. Acta Biomater. 2011;7(11):3850–6. doi:10.1016/j.actbio.2011.06.039. PMID:21763796.
- Gao G, Cui X. Three-dimensional bioprinting in tissue engineering and regenerative medicine. Biotechnol Lett. 2016;38(2):203–11. doi:10.1007/s10529-015-1975-1. PMID:26466597.
- Ventola CL. Medical Applications for 3D Printing: Current and Projected Uses. Pharmacy and Therapeutics. 2014;39(10):704–711. PMID:25336867.
- Lee J-S, Hong JM, Jung JW, Shim J-H, Oh J-H, Cho D-W. 3D printing of composite tissue with complex shape applied to ear regeneration. Biofabrication. 2014;6(2):024103. doi:10.1088/1758-5082/6/2/024103.
- Kim SS, Utsunomiya H, Koski JA, Wu BM, Cima MJ, Sohn J, Mukai K, Griffith LG, Vacanti JP. Survival and function of hepatocytes on a novel three-dimensional synthetic biodegradable polymer scaffold with an intrinsic network of channels. Ann Surg. 1998;228(1):8–13. doi:10.1097/00000658-199807000-00002. PMID:9671060.
- Zhu W, O'Brien C, O'Brien JR, Zhang LG. 3D nano/microfabrication techniques and nanobiomaterials for neural tissue regeneration. Nanomedicine. 2014;9(6):859–75. doi:10.2217/nnm.14.36. PMID:24981651.
- Park CJ, Kim HW, Jeong S, Seo S, Park Y, Moon HS, Lee JH. Anti-Reflux Ureteral Stent with Polymeric Flap Valve Using Three-Dimensional Printing: An In Vitro Study. J Endourol. 2015;29(8):933–8. doi:10.1089/end.2015.0154. PMID:25811682.
- Pati F, Shim J-H, Lee J-S, Cho D-W. 3D printing of cell-laden constructs for heterogeneous tissue regeneration. Manufacturing Letters. 2013;1(1):49–53. doi:10.1016/j.mfglet.2013.09.004.
- Park SA, Kim HJ, Lee SH, Lee JH, Kim HK, Yoon TR, Kim W. Fabrication of nano/microfiber scaffolds using a combination of rapid prototyping and electrospinning systems. Polymer Engineering & Science. 2011;51(9):1883–90. doi:10.1002/pen.21982.
- Kim G, Son J, Park S, Kim W. Hybrid Process for Fabricating 3D Hierarchical Scaffolds Combining Rapid Prototyping and Electrospinning. Macromolecular Rapid Communications. 2008;29(19):1577–81. doi:10.1002/marc.200800277.
- Li X, Cui R, Sun L, Aifantis KE, Fan Y, Feng Q, Cui F, Watari F. 3D-Printed Biopolymers for Tissue Engineering Application. International Journal of Polymer Science. 2014;2014:13. doi:10.1155/2014/829145.
- Lannutti J, Reneker D, Ma T, Tomasko D, Farson D. Electrospinning for tissue engineering scaffolds. Materials Science and Engineering: C. 2007;27(3):504–9. doi:10.1016/j.msec.2006.05.019.
- Lee SJ, Heo DN, Park JS, Kwon SK, Lee JH, Kim WD, Kwon IK, Park SA. Characterization and preparation of bio-tubular scaffolds for fabricating artificial vascular grafts by combining electrospinning and a 3D printing system. Phys Chem Chem Phys. 2015;17(5):2996–9. doi:10.1039/C4CP04801F. PMID:25557615.
- Badami AS, Kreke MR, Thompson MS, Riffle JS, Goldstein AS. Effect of fiber diameter on spreading, proliferation, and differentiation of osteoblastic cells on electrospun poly(lactic acid) substrates. Biomaterials. 2006;27(4):596–6. doi:10.1016/j.biomaterials.2005.05.084. PMID:16023716.
- Bashur CA, Dahlgren LA, Goldstein AS. Effect of fiber diameter and orientation on fibroblast morphology and proliferation on electrospun poly(d,l-lactic-co-glycolic acid) meshes. Biomaterials. 2006;27(33):5681–88. doi:10.1016/j.biomaterials.2006.07.005. PMID:16914196.
- Yasuda K, Inoue S, Tabata Y. Influence of culture method on the proliferation and osteogenic differentiation of human adipo-stromal cells in nonwoven fabrics. Tissue Eng. 2004;10(9–10):1587–96. doi:10.1089/1076327042500418 10.1089/ten.2004.10.1587. PMID:15588418.
- Rampichova M, Chvojka J, Buzgo M, Prosecka E, Mikes P, Vyslouzilova L, Tvrdik D, Kochova P, Gregor T, Lukas D and others. Elastic three-dimensional poly (epsilon-caprolactone) nanofibre scaffold enhances migration, proliferation and osteogenic differentiation of mesenchymal stem cells. Cell Prolif. 2013;46(1):23–37. doi:10.1111/cpr.12001. PMID:23216517.
- Sirc J, Hobzova R, Kostina N, Munzarova M, Juklickova M, Lhotka M, Kubinova S, Zajicov A, Michalek J. Morphological Characterization of Nanofibers: Methods and Application in Practice. Journal of Nanomaterials. 2012;2012:14. doi:10.1155/2012/327369.
- Plencner M, East B, Tonar Z, Otahal M, Prosecka E, Rampichova M, Krejci T, Litvinec A, Buzgo M, Mickova A and others. Abdominal closure reinforcement by using polypropylene mesh functionalized with poly-epsilon-caprolactone nanofibers and growth factors for prevention of incisional hernia formation. Int J Nanomedicine. 2014;9:3263–77. doi:10.2147/IJN.S63095. PMID:25031534.
- Mickova A, Buzgo M, Benada O, Rampichova M, Fisar Z, Filova E, Tesarova M, Lukas D, Amler E. Core/shell nanofibers with embedded liposomes as a drug delivery system. Biomacromolecules. 2012;13(4):952–62. doi:10.1021/bm2018118. PMID:22401557.
- Rampichova M, Buzgo M, Chvojka J, Prosecka E, Kofronova O, Amler E. Cell penetration to nanofibrous scaffolds: Forcespinning(R), an alternative approach for fabricating 3D nanofibers. Cell Adh Migr. 2014;8(1):36–41. doi:10.4161/cam.27477. PMID:24429388.
- Rampichová M, Chvojka J, Buzgo M, Prosecká E, Mikeš P, Vysloužilová L, Tvrdík D, Kochová P, Gregor T, Lukáš D and others. Elastic three-dimensional poly (ϵ-caprolactone) nanofibre scaffold enhances migration, proliferation and osteogenic differentiation of mesenchymal stem cells. Cell Proliferation. 2013;46(1):23–37. doi:10.1111/cpr.12001. PMID:23216517.
- Pham QP, Sharma U, Mikos AG. Electrospun poly(epsilon-caprolactone) microfiber and multilayer nanofiber/microfiber scaffolds: characterization of scaffolds and measurement of cellular infiltration. Biomacromolecules. 2006;7(10):2796–805. doi:10.1021/bm060680j. PMID:17025355.
- Nedjari S, Schlatter G, Hebraud A. Thick electrospun honeycomb scaffolds with controlled pore size. Materials Letters. 2015;142:180–183. doi:10.1016/j.matlet.2014.11.118.
- Pati F, Song T-H, Rijal G, Jang J, Kim SW, Cho D-W. Ornamenting 3D printed scaffolds with cell-laid extracellular matrix for bone tissue regeneration. Biomaterials. 2015;37:230–41. doi:10.1016/j.biomaterials.2014.10.012. PMID:25453953.
- Uchida N, Sivaraman S, Amoroso NJ, Wagner WR, Nishiguchi A, Matsusaki M, Akashi M, Nagatomi J. Nanometer-sized extracellular matrix coating on polymer-based scaffold for tissue engineering applications. J Biomed Mater Res A. 2016;104(1):94–103. doi:10.1002/jbm.a.35544. PMID:26194176.
- Zhao X, Irvine SA, Agrawal A, Cao Y, Lim PQ, Tan SY, Venkatraman SS. 3D patterned substrates for bioartificial blood vessels – The effect of hydrogels on aligned cells on a biomaterial surface. Acta Biomater. 2015;26:159–68. doi:10.1016/j.actbio.2015.08.024. PMID:26297885.
- Luk JZ, Cork J, Cooper-White J, Grondahl L. Use of two-step grafting to fabricate dual-functional films and site-specific functionalized scaffolds. Langmuir. 2015;31(5):1746–54. doi:10.1021/la504629h. PMID:25598325.
- Shim JH, Kim JY, Park M, Park J, Cho DW. Development of a hybrid scaffold with synthetic biomaterials and hydrogel using solid freeform fabrication technology. Biofabrication. 2011;3(3):1758–5082. doi:10.1088/1758-5082/3/3/034102..
- Wang J, Yang M, Zhu Y, Wang L, Tomsia AP, Mao C. Phage nanofibers induce vascularized osteogenesis in 3D printed bone scaffolds. Adv Mater. 2014;26(29):4961–6. doi:10.1002/adma.201400154. PMID:24711251.
- Mintz BR, Cooper JA, Jr. Hybrid hyaluronic acid hydrogel/poly(varepsilon-caprolactone) scaffold provides mechanically favorable platform for cartilage tissue engineering studies. J Biomed Mater Res A. 2014;102(9):2918–26. doi:10.1002/jbm.a.34957. PMID:24115629.
- Bianco P, Cancedda FD, Riminucci M, Cancedda R. Bone formation via cartilage models: the “borderline” chondrocyte. Matrix Biol 1998;17(3):185–92. doi:10.1016/S0945-053X(98)90057-9. PMID:9707341.
- Nakazora S, Matsumine A, Iino T, Hasegawa M, Kinoshita A, Uemura K, Niimi R, Uchida A, Sudo A. The cleavage of N-cadherin is essential for chondrocyte differentiation. Biochem Biophys Res Commun. 2010;400(4):493–9. doi:10.1016/j.bbrc.2010.08.070. PMID:20735983.
- Schulze-Tanzil G, de Souza P, Villegas Castrejon H, John T, Merker HJ, Scheid A, Shakibaei M. Redifferentiation of dedifferentiated human chondrocytes in high-density cultures. Cell Tissue Res. 2002;308(3):371–9. doi:10.1007/s00441-002-0562-7. PMID:12107430.
- Sophia Fox AJ, Bedi A, Rodeo SA. The basic science of articular cartilage: structure, composition, and function. Sports Health. 2009;1(6):461–8. doi:10.1177/1941738109350438. PMID:23015907.