
ABSTRACT
Cervical cancer (CC) is a very usual reproductive malignant tumor in women. RNA polymerase II-associated factor 1 (PAF1) and flotillin-2 (FLOT2) both have been discovered to key participators in cancers’ progression. However, the effects of PAF1/FLOT2 axis on CC development have not been probed. In this study, PAF1 and FLOT2 exhibited higher expression, and silencing of PAF1 down-regulated FLOT2 expression in CC. In addition, the regulatory effects of PAF1 suppression on CC progression were reversed after FLOT2 overexpression. Next, inhibition of PAF1 slowed the tumor growth in vivo through modulating FLOT2. Besides, down-regulation of PAF1 reduced FLOT2 expression to retard the MEK/ERK1/2 pathway. In conclusion, knockdown of PAF1 suppressed CC progression via retarding FLOT2-mediated MEK/ERK1/2 pathway. Our findings illustrated that the PAF1/FLOT2 axis may be useful bio-targets for CC treatment.
Introduction
Cervical cancer (CC) is one of the most familiar malignancies at the female reproductive system, with about 500,000 new confirmed cases and exceeds 200,000 deaths each year [Citation1–3]. In latest decades, the death rate of early and medium stage CC has declined due to the improvement strategies of early diagnosis and surgical treatment [Citation3–5]. However, the prognosis of advanced CC patients keeps bad because of the higher rate of tumor recurrence and metastasis [Citation6,Citation7]. Some of the molecular mechanisms underlying CC progression have been investigated, but the precise course of CC development maintains largely indistinct. Hence, looking for effective bio-molecular targets for CC treatment is pivotal.
RNA Polymerase II-Associated Factor 1 (PAF1), another name is pancreatic differentiation protein 2 (PD2), which is one subunit of the PAF1 complex (PAF1C) [Citation8]. The PAF1C is made up of six proteins (PAF1, CDC73, CTR9, RTF1, LEO1, and SKI8), and universally conserved in disparate species [Citation9]. PAF1 has been testified to be a hinge participator in numerous cellular processes, containing cell cycle, stem cell self-renewal and oncogenic transformation [Citation8,Citation10]. PAF1 is highly expressed in multifarious cancers and joins in the regulation of their progression. For example, cigarette smoke up-regulates PAF1 expression to enhance pancreatic cancer stem cell features [Citation11]. Additionally, SUMO modification of PAF1/PD2 in pancreatic ductal adenocarcinoma accelerates radiation resistance [Citation12]. PAF1 complex stimulates c-MYC transcription to facilitate tumorigenesis in non-small cell lung cancer [Citation13]. Furthermore, in CC, PAF1 reduces IER5 transcription to relieve radiosensitivity [Citation14]. These reports confirm the key location of PAF1 at cancer regulatory networks, and the other impacts of PAF1 on CC need to be further probed.
Flotillin-2 (FLOT2) is a highly conserved and generally expressed protein, which seated in a peculiar cholesterol-rich microdomain on the cytomembrane [Citation15]. Flotillins have been discovered to be involved in a variety of biological processes, such as membrane transport, axon growth, and diversified signaling pathways [Citation16,Citation17]. FLOT2 also has been disclosed to be a pivotal regulator in cancers’ progression [Citation18–20]. Interestingly, PAF1 negatively regulated FLOT2 expression in pancreatic cancer [Citation21]. However, the impacts of PAF1/FLOT2 axis on CC development have not been studied.
In this study, we aimed to research the functions of PAF1 and FLOT2 in CC. Findings illustrated that PAF1 and FLOT2 were both up-regulated in CC cells, and silencing PAF1 inhibited FLOT2 expression. PAF1 knockdown weakened cell proliferation, migration, invasion and EMT progress in CC by inhibiting FLOT2, and retarded the activation of the MEK/ERK1/2 pathway.
Materials and methods
Tissue samples
CC tissues (n = 25) and adjacent normal tissues (n = 25) were gathered from CC patients in the Affiliated Changzhou No.2 People’s Hospital of Nanjing Medical University. All CC patients have signed the informed consents. This study was approved by the Ethics Committee of the Affiliated Changzhou No.2 People’s Hospital of Nanjing Medical University. The collected tissues were kept in liquid nitrogen for further experiments.
Cell lines and culture
The normal cervical epithelial cell line HcerEpic and four cervical cancer cell lines (HeLa, C33A, SiHa, and CaSki) were gained from American Tissue Culture Collection (ATCC, USA). The RPMI-1640 medium (Gibco, USA) along with 10% fetal bovine serum (FBS, Gibco, USA) was utilized to culture these cells in a moist incubator with 5% CO2 at 37°C.
Cell transfection
The siRNAs targeting PAF1 (si-PAF1#1, si-PAF1#2) with negative control (siNC), pcDNA3.1 targeting FLOT2 (oe-FLOT2) with negative control (Vector) were acquired from Ribobio (Guangzhou, China). Lipofectamine 2000 (Invitrogen, USA) was performed to transfect these plasmids into HeLa and C33A cells.
RT-qPCR
TRIzol reagent (Invitrogen, USA) was employed to isolate total RNA from CC tissues or cells, and the SuperScript™ II Reverse Transcriptase Kit (Invitrogen, USA) was adopted to made the transcription of RNA to cDNA. The qRT-PCR was performed through the SYBR Premix Ex Taq™ (Takara, Shanghai, China). The relative mRNA expressions of genes were calculated through the 2−∆∆Ct method with normalizing to β-actin (the internal reference).
The primer sequences were displayed as following:
PAF1 forward, 5′-CTCACAGCATTACAGCAAACC-3′, and reverse, 5′-GTCTCTTCTACAGGCAGGAAAT-3′;
FLOT2 forward, 5′-CCGTGGCTGTGAGCAGTT-3′, and reverse, 5′-TGTCATACACGTCCTTGATGGT-3′;
β-actin forward, 5′-GGACATCCGCAAAGACCTGTA-3′, and reverse, 5′-GCTCAGGAGGAGCAATGATCT-3′.
Western blot
CC tissues or cells were lysed with RIPA lysis buffer (Thermo Fisher Scientific, Inc.) to obtain proteins. The SDS-PAGE was utilized for protein electrophoresis. Next, the proteins were transferred to the PVDF membranes (Beyotime, Shanghai, China). After being blocked, the membranes were mixed with primary antibodies at 4°C overnight. After washing, the appropriate HRP-conjugated secondary antibodies (1:2,000; ab7090; Abcam) were put into the membranes for cultivation. The protein blots were evaluated through the chemiluminescence detection kit (Thermo Fisher Scientific, Inc.).
The primary antibodies were: PAF1 (1:5000; ab137519; Abcam), FLOT2 (1/1000; ab96507), Vimentin (1:1000; ab92547), N-cadherin (1 µg/ml; ab18203), E-cadherin (1:10000; ab40772), MEK (1:1,000; ab32091), p-MEK (1:1000; ab96379), ERK1/2 (1:1,000; ab17942), p-ERK1/2 (1 µg/ml; ab278538) and β-actin (1 µg/ml; ab8226).
CCK-8
Cell counting kit-8 (CCK-8; Dojindo Laboratories, Kumamoto, Japan) was adopted to assess cell proliferation in line with manufacturer’s instructions. The CC cells (1 × 10⁴ cells/well) were put in the 96-well plate for 48 h, and the CCK-8 solution (10 μL) was mixed into each well for 4 h. At last, the absorbance was determined through a spectrophotometer (Thermo Fisher Scientific, MA, USA).
Colony formation assay
The 6-well plate were placed with 1000 CC cells/well, and kept in one incubator with 5% CO2 at 37°C for 14 days. Next, the formed colonies were subjected with 4% paraformaldehyde for fixing and 0.1% crystal violet for staining. The images were captured under a microscope.
TUNEL assay
In situ cell death detection kit (Minneapolis, MN) was utilized for TUNEL assay. CC cells in 24-well plates were cultured for 24 h, and then subjected to 4% paraformaldehyde for fixation and 0.1% Triton X100 for permeabilization. After rinsing, TUNEL solution (50 μL) was utilized to treat cells for 1 h in dark. Lastly, apoptotic cells were evaluated under a fluorescence microscopy.
Wound healing assay
The CC cells (1 × 10⁶ cells/well) were placed in 6-well plates, until the cell confluence attained 90%. The wound was generated with a 200 μL-pipette tips. After rinsing, the incubation of cells were performed for another 24 h. Images of the wound were acquired at 0 and 24 h under a light microscopy.
Transwell assay (invasion)
Cell invasion assay was made through the Transwell chambers (Corning Life Sciences, Corning, NY, USA) covered with the Matrigel (Becton Dickinson, USA). The 200 μL medium without serum containing 1 × 10⁵ CC cells was set into the upper chambers, and the 600 μL medium with 20% FBS was set into the lower chambers. Post 24 h, the invaded cells were subjected to 90% ethanol for fixing and 0.1% crystal violet for dyeing. The number of invaded cells was determined through a light microscope (Olympus Corporation, Tokyo, Japan).
In vivo assay
Female BALB/c nude mice (6-week-old, n = 20) were obtained from the Vital River company (Beijing, China). Mice were randomly separated into four groups (n = 5 for each group). The transfected CC cells were subcutaneously injected into mice at the right flanks. After 5 weeks, mice were killed. The size, volume and weight of tumors were evaluated. The Animal Care and Use Committee of the Affiliated Changzhou No.2 People’s Hospital of Nanjing Medical University approved this work.
IHC assay
The paraffin-embedded tumor tissues were cut into the 4 μm sections, and then subject to dewaxing and re-hydration. Post blocking, the sections were cultured with PAF1, FLOT2 and Ki-67 primary antibodies at 4°C overnight, and further mixed with secondary antibody (1:1000, ab7090, Abcam, Shanghai, China). Next, the sections were treated with diaminobenzidine (DAB) for dyeing and hematoxylin for re-dyeing. Images were gained through a microscope (Nikon, Tokyo, Japan).
Statistical analysis
GraphPad Prism software, version 8.0 (GraphPad Software, La Jolla, CA) was employed to execute the statistical analysis. The data are represented as the mean ± standard deviation (SD). The correlation between PAF1 and FLOT2 was examined through the Pearson’s correlation analysis. All experiments were made at least three replications. The comparisons among two or more groups were analyzed through the Student’s t-test and one-way analysis of variance (ANOVA). P < .05 is considered statistically significant.
Results
Silencing of PAF1 down-regulated FLOT2 expression in CC
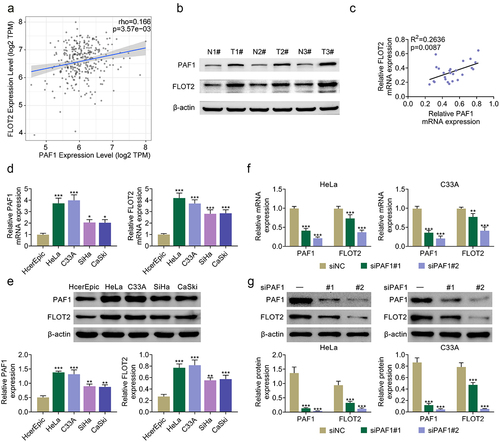
At first, the positive correlation between PAF1 and FLOT2 in CC tissues was discovered through TIMER 2.0 online website (). The protein expressions of PAF1 and FLOT2 were both up-regulated CC tumor tissues compared with the normal tissues (). Moreover, the negative correlation between PAF1 and FLOT2 in CC tissues (n = 25) were also confirmed (). The PAF1 and FLOT2 mRNA and protein expression were assessed in normal cervical epithelial cell line (HcerEpic) and CC cell lines (HeLa, C33A, SiHa, CaSki). Results demonstrated that the mRNA and protein expression of PAF1 and FLOT2 were both up-regulated in CC cell lines (). Next, the knockdown efficiency of siPAF1#1/2 for PAF1 was confirmed, and it was discovered that the FLOT2 expression was markedly reduced after silencing PAF1 (). To sum up, PAF1 and FLOT2 exhibited higher expression, and silencing of PAF1 down-regulated FLOT2 expression in CC.
Figure 1. Silencing of PAF1 down-regulated FLOT2 expression in CC. (a) the correlation between PAF1 and FLOT2 in CC tissues was confirmed through TIMER 2.0 online website. (b) the protein expressions of PAF1 and FLOT2 were detected in normal tissues and CC tumor tissues through western blot. (c) the correlation between PAF1 and FLOT2 in CC tissues (n = 25) was verified. (d) the mRNA expression of PAF1 and FLOT2 were examined in human normal cervical epithelial cell line (HcerEpic) and CC cell lines (HeLa, C33A, SiHa, CaSki) through RT-qPCR. (e) the protein expression of PAF1 and FLOT2 were detected in human normal cervical epithelial cell line (HcerEpic) and CC cell lines (HeLa, C33A, SiHa, CaSki) through western blot. (f-g) the mRNA and protein expressions of PAF1 and FLOT2 were tested in HeLa and C33A cells after PAF1 knockdown through RT-qPCR and western blot. *p < 0.05, **p < 0.01, ***p < 0.001.
Suppression of PAF1 weakened CC cell proliferation and strengthened cell apoptosis through modulating FLOT2
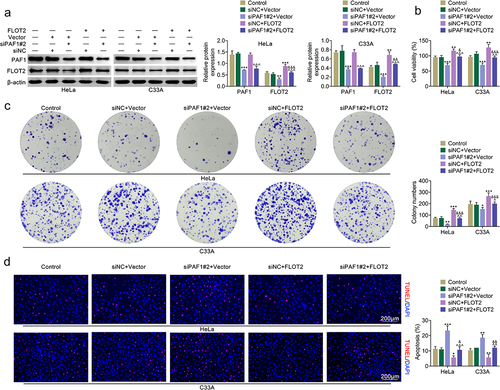
As displayed in Figure S1A-B, the mRNA and protein expressions of PAF1 and FLOT2 were both decreased after PAF1 knockdown, but these effects were reversed by PAF1 overexpression. Further experiments demonstrated that the PAF1 protein expression was not changed after FLOT2 overexpression. The overexpression efficiency of FLOT2 was determined, and the decreased FLOT2 protein expression mediated by PAF1 knockdown could be reversed after FLOT2 overexpression (). Furthermore, the cell viability was weakened after inhibiting PAF1, but strengthened after overexpressing FLOT2. And, the weakened cell proliferation induced by PAF1 repression could be rescued after FLOT2 overexpression (). Additionally, the cell apoptosis was elevated after PAF1 knockdown, but lessened after FLOT2 up-regulation. And, the elevated cell apoptosis stimulated by PAF1 knockdown was attenuated after FLOT2 up-regulation (). These data proved that the regulatory effects of PAF1 suppression on CC cell proliferation and cell apoptosis were reversed after FLOT2 overexpression.
Figure 2. Suppression of PAF1 weakened CC cell proliferation and strengthened cell apoptosis through modulating FLOT2. Groups were separated into the control, siNc+vector, siPaf1#2+vector, siNC+FLOT2 and siPAF1#2+FLOT2 group. (a) the protein expression of PAF1 and FLOT2 were measured in HeLa and C33A cells through western blot. (b-c) the cell proliferation was verified in HeLa and C33A cells through CCK-8 and colony formation assays. (d) the cell apoptosis was identified in HeLa and C33A cells through TUNEL assay. *p < 0.05, **p < 0.01, ***p < 0.001 vs the siNc+vector group; ^p < 0.05, ^^p < 0.01, ^^^p < 0.001 vs the siPaf1#2+vector group; &p < .05, &&p < .01, &&&p < .001 vs the siNC+FLOT2 group.
Knockdown of PAF1 reduced CC cell migration, invasion and EMT progress through modulating FLOT2
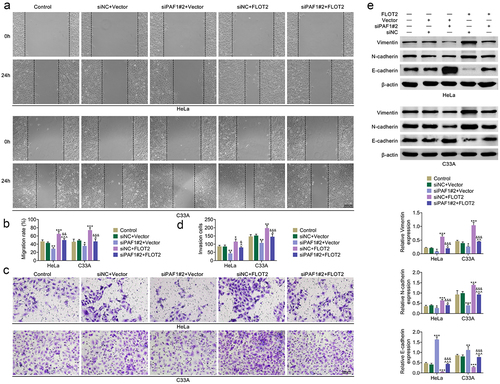
The cell migration was reduced after suppressing PAF1, but enhanced after overexpressing FLOT2. And, the reduced cell migration triggered by PAF1 inhibition was reversed after FLOT2 overexpression (). Through Transwell assay, it was revealed that cell invasion was decreased after PAF1 knockdown, but increased after FLOT2 enhancement. And, the decreased cell migration stimulated by PAF1 knockdown was rescued after enhancing FLOT2 (). Next, the EMT progress related proteins were evaluated. The protein levels of Vimentin and N-cadherin were down-regulated after PAF1 inhibition, but up-regulated after FLOT2 overexpression. The protein level of E-cadherin was up-regulated after PAF1 inhibition, but down-regulated after FLOT2 overexpression. And, the down-regulated Vimentin and N-cadherin as well as the up-regulated E-cadherin levels mediated by PAF1 suppression were reversed after FLOT2 overexpression (). Taken together, knockdown of PAF1 reduced CC cell migration, invasion and EMT progress through modulating FLOT2.
Figure 3. Knockdown of PAF1 reduced CC cell migration and invasion through modulating FLOT2. Groups were separated into the control, siNc+vector, siPaf1#2+vector, siNC+FLOT2 and siPAF1#2+FLOT2 group. (a-b) the cell migration was confirmed in HeLa and C33A cells through wound healing assay. (c-d) the cell invasion was assessed in HeLa and C33A cells through Transwell assay. (e) the protein expression of Vimentin, N-cadherin and E-cadherin were evaluated in HeLa and C33A cells through western blot. *p < 0.05, **p < 0.01, ***p < 0.001 vs the siNc+vector group; ^p < 0.05, ^^p < 0.01, ^^^p < 0.001 vs the siPaf1#2+vector group; &p < 0.05, &&p < 0.01, &&&p < 0.001 vs the siNC+FLOT2 group.
Inhibition of PAF1 slowed the tumor growth in vivo through modulating FLOT2
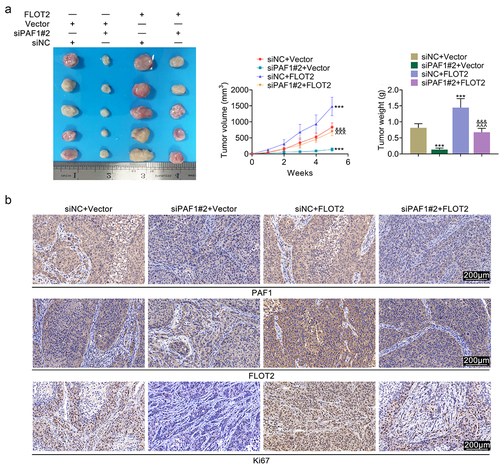
In vivo assays were made to further assess the PAF1/FLOT2 axis. The tumor size, volume and weight were all decreased after PAF1 inhibition, but increased after FLOT2 up-regulation. And, the decreased tumor growth triggered by PAF1 inhibition was offset after FLOT2 up-regulation (). IHC assay indicated that the PAF1 protein expression was not affected by FLOT2 overexpression. The FLOT2 and Ki67 protein expression were reduced after PAF1 knockdown, but enhanced after FLOT2 overexpression. And, the reduced FLOT2 and Ki67 protein expression mediated by PAF1 knockdown were neutralized after FLOT2 overexpression (). These findings suggested that inhibition of PAF1 slowed the tumor growth in vivo through modulating FLOT2.
Figure 4. Inhibition of PAF1 slowed the tumor growth in vivo through modulating FLOT2. Groups were separated into the siNc+vector, siPaf1#2+vector, siNC+FLOT2 and siPAF1#2+FLOT2 group. (a) the tumor size, volume and weight were determined through in vivo assay. (b) the protein expressions of PAF1, FLOT2 and Ki67 in tumor tissues were tested through IHC assay. ***p < 0.001 vs the siNc+vector group; ^^^p < 0.001 vs the siPaf1#2+vector group; &&&p < 0.001 vs the siNC+FLOT2 group.
Down-regulation of PAF1 retarded the MEK/ERK1/2 pathway through modulating FLOT2
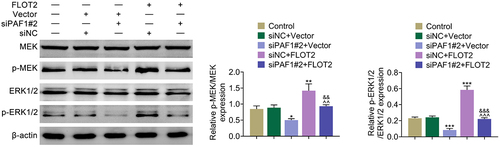
Further exploration illustrated that the p-MEK/MEK and p-ERK1/2/ERK1/2 protein levels were down-regulated after repressing PAF1, but up-regulated after overexpressing FLOT2. And, the down-regulated p-MEK/MEK and p-ERK1/2/ERK1/2 protein levels induced by repressing PAF1 were reversed after overexpressing FLOT2 (). In general, down-regulation of PAF1 retarded the MEK/ERK1/2 pathway through modulating FLOT2.
Figure 5. Repression of PAF1 retarded the MEK/ERK1/2 pathway through modulating FLOT2. Groups were separated into the control, siNc+vector, siPaf1#2+vector, siNC+FLOT2 and siPAF1#2+FLOT2 group. The protein expression of MEK, p-MEK, ERK1/2 and p-ERK1/2 were examined in HeLa cells through western blot. *p < 0.05, **p < 0.01, ***p < 0.001 vs the siNc+vector group; ^^p < 0.01, ^^^p < 0.001 vs the siPaf1#2+vector group; &&p < 0.01, &&&p < 0.001 vs the siNC+FLOT2 group.
Discussion
More and more proteins have been participated into the progression of CC through the protein-protein interaction way. For example, EDC4 interacts with RPA to accelerate cisplatin resistance in CC through improving DNA damage [Citation22]. In addition, CD36 interacts with TGF-β to aggravate the EMT progress and metastasis in CC [Citation23]. GRSF1-mediated MIR-G-1 enhances TMED5 and LMNB1 expression in CC to facilitate malignant behavior and nuclear autophagy [Citation24]. Moreover, CIP2A contributes to EMT progress in CC through cooperating with H-Ras [Citation25]. Additionally, transcription factor AP-2β degrades β-catenin to weaken CC cell proliferation [Citation26].
PAF1 has been disclosed to be a key participator in cancers’ progression, and FLOT2 also has the same effects. Recent some studies have displayed that higher expression of FLOT2 is associated with the aggravation of several human cancers. For instance, silencing of FLOT2 suppresses the CRC cell invasion and migration [Citation27]. In addition, the TBL1X/FLOT2 positive feedback loop strengthened metastasis in nasopharyngeal carcinoma [Citation28]. FLOT2 stabilizes EphA2 to aggravate glioma growth and invasion [Citation29]. Circ_001569/miR-185-5p/FLOT2 axis strengthens cell proliferation and EMT progress in osteosarcoma [Citation30]. Furthermore, miR-449a/FLOT2 axis suppresses TGF-β-triggered EMT progress in gastric cancer [Citation31]. Interestingly, it has been discovered that the promoter of FLOT2 is occupied by PAF1, indicating that FLOT2 can be directly regulated by PAF1, and results revealed that PAF1 negatively regulated FLOT2 expression in pancreatic cancer [Citation21]. However, the effects of PAF1/FLOT2 axis on CC development keep vague. In this study, firstly, it was demonstrated that PAF1 and FLOT2 exhibited higher expression, and silencing of PAF1 down-regulated FLOT2 expression in CC. In addition, the regulatory effects of PAF1 suppression on CC cell proliferation, cell apoptosis, cell migration and invasion were reversed after FLOT2 overexpression. Next, through in vivo assay, it was proved that inhibition of PAF1 slowed the tumor growth in vivo through modulating FLOT2.
The MEK/ERK1/2 pathway exploits advantages in the regulation of multifold cancers. For example, autophagy affects chronic arsenic exposure-mediated bronchial cell malignant transformation through the MEK/ERK1/2 pathway [Citation32]. GSTP1 targets MYC to retard the MEK/ERK1/2 pathway in prostate cancer, thereby weakens the cell viability and motility [Citation33]. Additionally, DGCR5 modulates the MEK/ERK1/2 pathway to accelerate gallbladder cancer development [Citation34]. Besides, isocorydine retards the Ras/MEK/ERK signaling pathway to suppress cell proliferation in endometrial carcinoma [Citation35]. In this work, down-regulation of PAF1 reduced FLOT2 expression to retard the MEK/ERK1/2 pathway.
In conclusion, knockdown of PAF1 reduced CC cell proliferation, migration and invasion via retarding FLOT2-mediated MEK/ERK1/2 pathway. This discovery implied that PAF1/FLOT2 axis may be resultful targets for CC therapeutic strategy. The clinical significance of this work is to search potential targets for the treatment of CC, and realize individualized treatments. PAF1/FLOT2 is a potential target of CC, and inhibition of PAF1/FLOT2 May suppress CC progression. However, our current work has some limitations for the influences of PAF1/FLOT2 axis on CC progression. In the future, more experiments were made to further investigate the other regulatory roles of PAF1/FLOT2 axis in CC.
Availability of data and materials
All data generated or analyzed during this study are included in this published article.
Ethics approval
All procedures performed in studies involving human participants were in accordance with the standards upheld by the Ethics Committee of the Affiliated Changzhou No.2 People’s Hospital of Nanjing Medical University and with those of the 1964 Helsinki Declaration and its later amendments for ethical research involving human subjects.
All animal experiments were approved by the Ethics Committee of the Affiliated Changzhou No.2 People’s Hospital of Nanjing Medical University for the use of animals and conducted in accordance with the National Institutes of Health Laboratory Animal Care and Use Guidelines.
Author’s contribution
All authors contributed to the study conception and design. Material preparation and the experiments were performed by Bin Tang. Data collection and analysis were performed by Bin Tang and Shulan Dou. The first draft of the manuscript was written by Shulan Dou and all authors commented on previous versions of the manuscript. All authors read and approved the final manuscript.
Supplemental Material
Download MS Word (110.3 KB)Disclosure statement
No potential conflict of interest was reported by the authors.
Supplementary material
Supplemental data for this article can be accessed online at https://doi.org/10.1080/19336918.2023.2260641
Additional information
Funding
References
- Johnson CA, James D, Marzan A, et al. Cervical cancer: an overview of pathophysiology and management. Semin Oncol Nurs. 2019;35(2):166–174. doi: 10.1016/j.soncn.2019.02.003
- Tsikouras P, Zervoudis S, Manav B, et al. Cervical cancer: screening, diagnosis and staging. Journal Of BUON: Official Journal Of The Balkan Union Of Oncology. 2016;21(2):320–325.
- Pimple SA, Mishra GA. Global strategies for cervical cancer prevention and screening. Minerva Ginecol. 2019;71(4):313–320. doi: 10.23736/S0026-4784.19.04397-1
- Fang J, Zhang H, Jin S. Epigenetics and cervical cancer: from pathogenesis to therapy. Tumour Biol. 2014;35(6):5083–5093. doi: 10.1007/s13277-014-1737-z
- Olthof ER, van der Velden J, Painter RC, et al. Morbidity of radical hysterectomy combined with caesarean section in pregnant patients with cervical cancer. Eur J Gynaecol Oncol. 2021;42(2):300–306.
- Li H, Wu X, Cheng X. Advances in diagnosis and treatment of metastatic cervical cancer. J Gynecol Oncol. 2016;27(4):e43. doi: 10.3802/jgo.2016.27.e43
- Duan J-Q, Huang H-G, Shui C-L, et al. The cardioprotective effect of dexmedetomidine on elderly patients with cervical cancer in the trendelenburg position. Signa Vitae. 2021;17(5):117–121.
- Karmakar S, Dey P, Vaz AP, et al. PD2/PAF1 at the crossroads of the cancer network. Cancer Res. 2018;78(2):313–319. doi: 10.1158/0008-5472.CAN-17-2175
- Jaehning JA. The Paf1 complex: platform or player in RNA polymerase II transcription? Biochim Biophys Acta Gene Regul Mech. 2010;1799(5–6):379–388. doi: 10.1016/j.bbagrm.2010.01.001
- Belotserkovskaya R, Reinberg D. Facts about FACT and transcript elongation through chromatin. Curr Opin Genet Dev. 2004;14(2):139–146. doi: 10.1016/j.gde.2004.02.004
- Nimmakayala RK, Seshacharyulu P, Lakshmanan I, et al. Cigarette smoke induces stem cell features of pancreatic cancer cells via PAF1. Gastroenterology. 2018;155(3):892–908.e896. doi: 10.1053/j.gastro.2018.05.041
- Rauth S, Karmakar S, Shah A, et al. SUMO modification of PAF1/PD2 enables PML interaction and promotes radiation resistance in pancreatic ductal adenocarcinoma. Mol Cell Biol. 2021;41(12):e0013521. doi: 10.1128/MCB.00135-21
- Zhi X, Giroux-Leprieur E, Wislez M, et al. Human RNA polymerase II associated factor 1 complex promotes tumorigenesis by activating c-MYC transcription in non-small cell lung cancer. Biochem Biophys Res Commun. 2015;465(4):685–690. doi: 10.1016/j.bbrc.2015.08.017
- Zheng JJ, He Y, Liu Y, et al. Novel role of PAF1 in attenuating radiosensitivity in cervical cancer by inhibiting IER5 transcription. Radiat Oncol. 2020;15(1):131. doi: 10.1186/s13014-020-01580-w
- Liu FT, Qu QG, Zhu ZM. Up-regulation of flot-2 protein is related to lymph node metastasis and poor prognosis in human solid tumors. Minerva Chir. 2017;72(2):146–156. doi: 10.23736/S0026-4733.16.07261-8
- Banning A, Kurrle N, Meister M, et al. Flotillins in receptor tyrosine kinase signaling and cancer. Cells. 2014;3(1):129–149. doi: 10.3390/cells3010129
- Zhao F, Zhang J, Liu YS, et al. Research advances on flotillins. Virol J. 2011;8(1):479. doi: 10.1186/1743-422X-8-479
- Liu L XX, Wang WD, Zhu L, et al. Roles of flotillins in tumors. J Zhejiang Univ Sci B. 2018;19(3):171–182.
- Deng Y, Ge P, Tian T, et al. Prognostic value of flotillins (flotillin-1 and flotillin-2) in human cancers: a meta-analysis. Clin Chim Acta. 2018;481:90–98. doi: 10.1016/j.cca.2018.02.036
- Her E-J, Kwon H, Chae B, et al. High D-dimer is a predictor for short-term mortality in patients with active cancer and acute pulmonary embolism. Signa Vitae. 2021;17(5):58–63.
- Karmakar S, Rauth S, Nallasamy P, et al. RNA polymerase II-Associated factor 1 regulates stem cell features of pancreatic cancer cells, independently of the PAF1 complex, via interactions with PHF5A and DDX3. Gastroenterology. 2020;159(5):1898–1915.e. doi: 10.1053/j.gastro.2020.07.053
- Wu X, Zhong Y, Chen Q, et al. Enhancer of mRNA decapping protein 4 (EDC4) interacts with replication protein a (RPA) and contributes to Cisplatin resistance in cervical cancer by alleviating DNA damage. Hereditas. 2020;157(1):41. doi: 10.1186/s41065-020-00154-w
- Deng M, Cai X, Long L, et al. CD36 promotes the epithelial–mesenchymal transition and metastasis in cervical cancer by interacting with TGF-β. J Transl Med. 2019;17(1):352. doi: 10.1186/s12967-019-2098-6
- Yang Z, Sun Q, Guo J, et al. GRSF1-mediated MIR-G-1 promotes malignant behavior and nuclear autophagy by directly upregulating TMED5 and LMNB1 in cervical cancer cells. Autophagy. 2019;15(4):668–685. doi: 10.1080/15548627.2018.1539590
- Wu Y, Gu TT, Zheng PS. CIP2A cooperates with H-Ras to promote epithelial-mesenchymal transition in cervical-cancer progression. Cancer Lett. 2015;356(2 Pt B):646–655. doi: 10.1016/j.canlet.2014.10.013
- Wang F, Huang W, Hu X, et al. Transcription factor AP-2β suppresses cervical cancer cell proliferation by promoting the degradation of its interaction partner β-catenin. molecular carcinogenesis. Mol Carcinog. 2017;56(8):1909–1923. doi: 10.1002/mc.22646
- Zhong C, Zheng F, Ye S, et al. Effect of FLOT2 gene expression on invasion and metastasis of colorectal cancer and its molecular mechanism under Nanotechnology and RNA interference. Bio Med Res Int. 2022;2022:1–11. doi: 10.1155/2022/2897338
- Xu H, Yan X, Zhu H, et al. TBL1X and Flot2 form a positive feedback loop to promote metastasis in nasopharyngeal carcinoma. Int J Biol Sci. 2022;18(3):1134–1149. doi: 10.7150/ijbs.68091
- Song T, Hu Z, Liu J, et al. FLOT2 upregulation promotes growth and invasion by interacting and stabilizing EphA2 in gliomas. Biochem Biophys Res Commun. 2021;548:67–73. doi: 10.1016/j.bbrc.2021.02.062
- Xiao B, Zhang X, Li X, et al. Circ_001569 regulates FLOT2 expression to promote the proliferation, migration, invasion and EMT of osteosarcoma cells through sponging miR-185-5p. Open Life Sciences. 2020;15(1):476–487. doi: 10.1515/biol-2020-0050
- Li Q, Peng J, Li X, et al. Liu T: miR-449a targets Flot2 and inhibits gastric cancer invasion by inhibiting TGF-β-mediated EMT. Diagn Pathol. 2015;10:202. doi: 10.1186/s13000-015-0435-5
- Wu L, Wang Z, Li X, et al. Autophagy mediates bronchial cell malignant transformation induced by chronic arsenic exposure via MEK/ERK1/2 pathway. Toxicol Lett. 2020;332:155–163. doi: 10.1016/j.toxlet.2020.06.006
- Wang J XX, Yang HT, Luo H, et al. Overexpression of glutathione S-transferase P1 inhibits the viability and motility of prostate cancer via targeting MYC and inactivating the MEK/ERK1/2 pathways. Oncol Res. 2017. doi: 10.3727/096504017X14978850961299
- Liu S, Chu B, Cai C, et al. DGCR5 promotes gallbladder cancer by sponging MiR-3619-5p via MEK/ERK1/2 and JNK/p38 MAPK pathways. J Cancer. 2020;11(18):5466–5477. doi: 10.7150/jca.46351
- Fu Y, Jin R-R, Li Y-L, et al. Isocorydine inhibits the proliferation of human endometrial carcinoma HEC-1B cells by downregulating the Ras/MEK/ERK signaling pathway. Eur J Gynaecol Oncol. 2021;42(3):548–553.